Weston P. Bioinformatics Software Engineering: Delivering Effective Applications
Подождите немного. Документ загружается.

BEGIN, PROCESS, END: PROCESS FLOW DIAGRAMS 57
Read File
Open File Read Lines Close File
Read Line
*
Until End of File
Figure 8.2 Process flow diagram: repeated process
Open File
Exit
O
If Fail
If Success
Continue
O
Figure 8.3 Process flow diagram: selection process
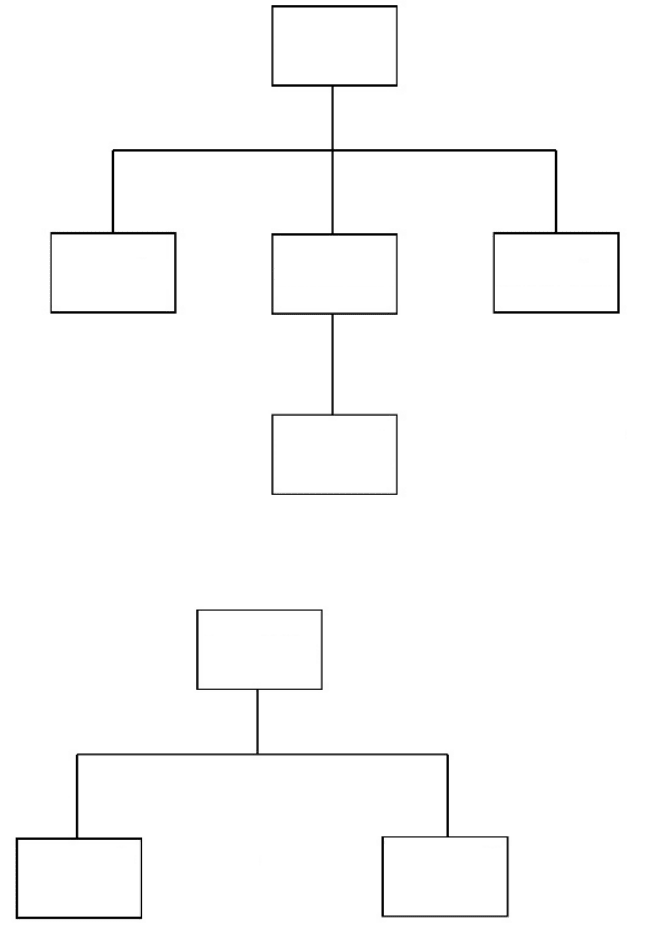
There are a couple of points to note about the example overleaf.
First, the use of an exit box is optional. One alternative would be to
design the process flow diagram so that (for example) ‘Process Lines’
descended from the ‘Continue’ option of ‘Open File’. Instead, you can
58 DATA IN, DATA OUT AND DATA TRANSFORMATION
Open
File
If Fail
If Success
Continue
Process
Line
Read
Line
Exit Continue
If
Unexpected
Data
If
Expected
Data
Process
Lines
Process
File
Close
File
Until End of File
*
Exit
Check
Data
Figure 8.4 Process flow diagram: complex process
see that I have arranged the major sub-stages of the program – open a
file, process its contents, close it – in a sequential horizontal line at the
top of the diagram. I prefer the method used here as I feel it makes the
logic clearer.
Secondly, there is more processing that could be added to this
diagram, such as how to handle failing to open the file, and how to
compile the report from the data read in. We will look later on at cre-
ating flow diagrams for these processes.
But it is important to be clear that by drawing process flow diagrams
to represent your understanding of what is happening at the various
stages in the program, you can break down the required functionality
into sections, each of which has a beginning, a middle and an end.
And each of these sections can be made up of further sub-units of
functionality, which themselves may have a beginning, a middle and an
end. Breaking down the work to be done into its component parts like
this should continue until you are happy that the processing to be
carried out can be clearly defined.
In the next chapter we will go on to look at pseudocode, which is a
simple way of describing the processing involved at each stage of a
program. The reason for this is that one good test of whether your
analysis is adequate is trying to turn your diagrams into the minimal
subset of natural language that pseudocode is written in.
You may well find that you don’t need to do this much analysis for
all areas of the program. However, even if you decide not to do process
flow diagrams for the whole system, it is a very useful technique when
planning the implementation of more logically complex modules or
code sections.
So, now that we have seen a way to graphically represent what our
program is going to do, let’s explore how we can clarify what will be
going into it, and what will be coming out, by drawing pictures of its
data.
Boxes in boxes: data structure diagrams
Just as we can draw how your program will work, so we can model
the shape of the data that your program will need to deal with.
Just as a process flow diagram defines a beginning, a middle and an
end for each processing element, so data structure diagrams describe
for each stage what data goes in, what data comes out, and thus how
it is transformed.
BOXES IN BOXES: DATA STRUCTURE DIAGRAMS 59
Let’s return to the sample program that we looked at briefly earlier,
to work with sequence assemblies. First we will look at how we can
use data structure diagrams to describe the data that it will be dealing
with, and then we will examine how we can use process flow diagrams
to show what happens to that data.
Remember that there’s no point in writing code if you don’t know
how to prove it works, and equally there’s no point even reading in
data unless you know what data to expect.
So, let’s make sure we know what data will be involved in (for
example) reading in the details of an assembly of sequences into con-
tiguous sub-sections, and summarizing the information that we dis-
cover into a report.
Each assembly will be made up of a number of groups of sequences
of individual DNA bases, represented by a long string of letters, like
‘ACTTGGTCCAATTGGCACAC’, that have been assembled together.
These groups are known as contigs, because they are contiguous – each
sequence in a contig contains one or more sections where the arrange-
ment of its bases matches a section of another sequence.
If you’re not a molecular biologist, think of a painting of some
flowers. It will be made up of lots of small dabs of paint, of various
colours, shades and thicknesses. If we then group a number of these
paint marks together, we may have a leaf, a shadow, or a vase. And if
we put all of these groupings together, we have a masterpiece, espe-
cially if your own child created it.
The sequence data is like the individual paint marks. The contigs –
the groups of sequences that go together – are like the leaf, the shadow
and the vase. And the assembly is what we get when we put all these
parts of the picture together.
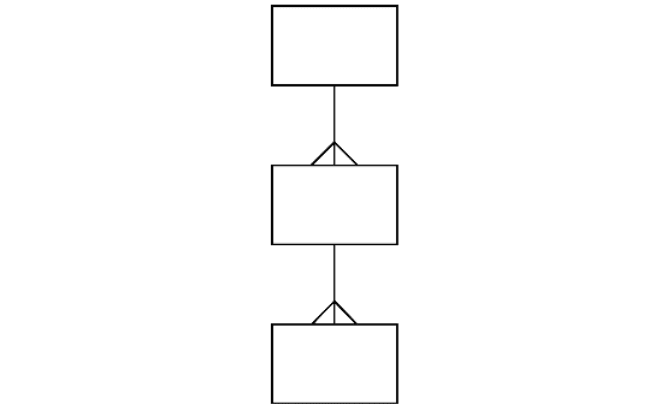
Let’s just slightly rephrase our definition of how our data is
structured.
• Each assembly is made up of contigs.
• Each contig is made up of sequences.
• Each sequence is made up of bases.
We can represent this graphically, by using a simple crow’s foot
symbol to represent ‘is made up of’. Take a look at Figure 8.5, which
shows an assembly of contiguous sequences.
This is a very simple representation of the data that we will be dealing
with – we’ve not even shown the bases. In a moment, we’ll see a more
60 DATA IN, DATA OUT AND DATA TRANSFORMATION
exhaustive way of representing the data we’ll be working with; for now,
just make sure you understand what we’ve done here. Try doing a data
structure diagram of your favourite painting, for example.
Remember, to produce these drawings you don’t need any fancy
software, merely a handy 1-bit analogue portable recording device,
or pencil, and the world’s most popular information transmission
medium, paper.
And with the addition of an eraser, we have an infinitely adaptable
way of capturing ideas, whether in the form of user stories, screen
drawings, or data structure and process flow diagrams.
You may wish at a later stage of the project to convert these pencil
sketches to more formal representations for the purpose of document-
ing your application, as I have done for my publishers.
However, the important thing for us is to capture an understanding,
shared between ourselves, our customers and our program’s users, of
what information the application needs to be able to cope with.
The technique illustrated here is simple and clear enough to be under-
stood by customers, especially if they work with this type of data. Rep-
resenting their data like this helps to ensure that you and they are in
agreement about what will go into, be processed by, and come out of
your program.
Furthermore, the act of trying to create data structure diagrams can
often lead to clarifying discussions that can help both you and your
BOXES IN BOXES: DATA STRUCTURE DIAGRAMS 61
Assembly
Contig
Sequence
Figure 8.5 Data structure diagram: simple assembly structure
customers reach a better understanding of the details of the work that
you will be doing for them.
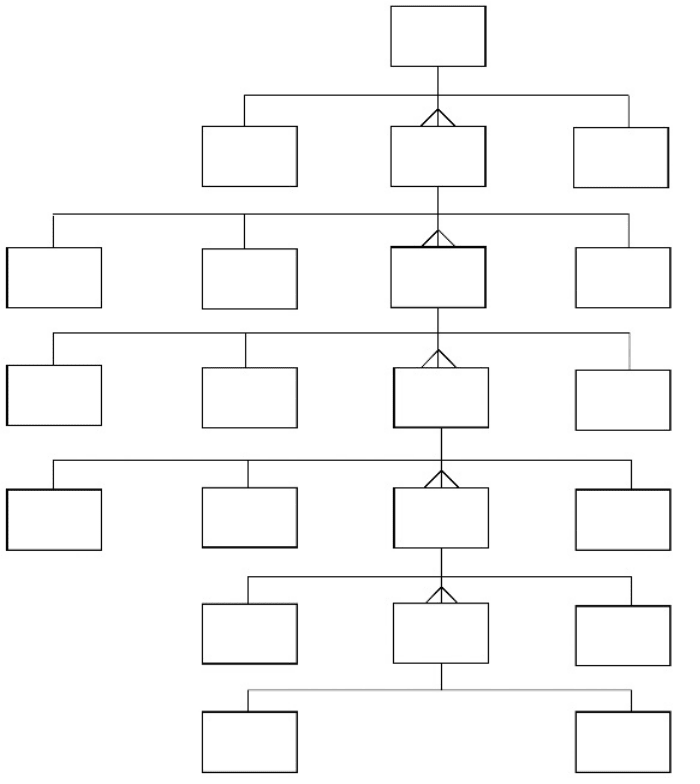
For example, we showed a simple diagram of how an assembly of is
made up of groups of contiguous sequences of bases. Let’s expand that
into a more accurate – though arguably still incomplete – representa-
tion (Figure 8.6). Note that this version shows not just ‘one or more
of’ relationships, but it is more precise: either ‘only one of’ or ‘between
(a number) and (another number, possibly unknown) of’ connections
are used.
62 DATA IN, DATA OUT AND DATA TRANSFORMATION
Assembly
Contig
Assembly
Length
Contig
Count
Contig
Index
Sequence
Index
Position
Index
Base
Repeat
Sequencing
Vector
Vector
Poor
Quality
Cloning
Vector
Tags
Quality
Sequence
Name
Position
Average
Quality
Length
Sequence
Average
Depth
1,n
2,n
1,n
0,4
0,2
Figure 8.6 Data structure diagram: complex assembly structure

9
Where to Start?
Having looked in the previous chapter at how to make sure that you
understand in detail what your program has to do, and how, we are
now going to look at what to do when you are unsure where to begin
your implementation.
Now this may be because parts of the specification or design still
need more work, and you may feel that you would rather wait until
all these stages are fully complete. However, in bioinformatics, this is
often not a good idea, as scientists tend to always think of new things
that they would like your program to do, as soon as they see what is
possible.
And if you are producing prototypes and proofs of concepts, you will
almost certainly be analyzing, designing and developing in parallel. We
will look later on at how acquiring this capability may well be helpful
later in the development process; for now, let’s just say that as soon as
you feel confident that you know how to do something, it’s a good idea
to get to work on it.
So the first step in starting coding is to determine in your mind what
you know, and what you don’t know. You will have to wait to find out
what you don’t know you don’t know, but that will become clear soon
enough: for now, just deal with what you know you have to do.
There is some basic functionality that you will need under almost all
circumstances, so let’s think what might be involved in implementing
it. Then we will explore how we can go from the information we have,
to pseudocode (if required), and end up with working code.
Bioinformatics Software Engineering: Delivering Effective Applications. Paul Weston
Copyright
2004 John Wiley & Sons, Ltd. ISBN: 0-470-85772-2
You will need to get in data
Few programs have no need for data to be supplied to them, so it is
likely that you will need to plan how to accept user input, read files,
or handle messages.
You will need to check that this data has actually been supplied, that
it is of the right type or format, and that it contains information of
usable quality.
Start as simply as possible – get in data and display it. Then think
about how you can check that it is the right data, and if it is, what you
need to do with it.
• Does it need to be passed to another part of the program?
• Does it need to be reformatted, or modified, or transformed in
some other way?
• What will you do if there is a problem?
These questions may highlight areas where, for instance, we need to
add more detail to our designs, or we may find things we hadn’t thought
about.
But if you’re wondering where to start the actual programming, take
another look at that last question. The second code section in nearly
every new program of mine handles reading in the data it needs – but
the first code I write handles what happens if I forget the program’s
calling parameters, or don’t tell it where the data is, or give it the wrong
type of data.
You will need to cope with errors, because they
will happen
Whatever can go wrong, will. So, therefore, for any program that takes
a non-trivial amount of time to run, try designing error-catching code
that sends you an email and/or prints to a log file.
If you are writing proof-of-concept code, or developing a module in
isolation, this may be overkill at first, but as your code grows in size
and complexity it will become more and more necessary.
Start by handling errors that you can deliberately create – try to open
64 WHERE TO START?
a file that you know is not there, for instance. What does your program
do in this case?
• Does it stop running silently, with no indication of what has gone
wrong?
• Does it keep going for a while, then crash later on when an unini-
tialized variable is encountered?
• Does it give an error message, saying ‘Something has gone wrong
with the program’?
• Or does it politely inform the user that it is unable to find the spec-
ified file, and give them the opportunity to correct the situation?
Diagramming how you handle this situation can rapidly become a non-
trivial challenge, particularly if you consider cases where an error can
be repeated, such as when a user keeps specifying the wrong type of
data file, or compounded, where the user becomes flustered and starts
pressing keys at random.
A simple solution is to show it in a repeat loop until the user exits
or corrects the errors, as in Figure 9.1.
You will need to report results
After error handling and data gathering, it is time to write code that
displays the required output. In the beginning, make this as straight-
forward as possible, and just print your results out to screen, to email,
or to a log file, until you are happy that they are valid. Then – and only
then – should you start to think about more complex and sophisticated
output presentation techniques.
At this early stage of development it is sometimes useful to combine
the result-reporting mechanism with the error handling discussed
above, so that one simple code section is responsible for giving all mes-
sages to you.
You will also need to consider what sort of results you will plan to
deliver at each stage of the development process.
For example, proof-of-concept code may get away with producing
correct output from a given dataset without falling over. But as your
application develops and matures, it is likely that your customers may
YOU WILL NEED TO REPORT RESULTS 65
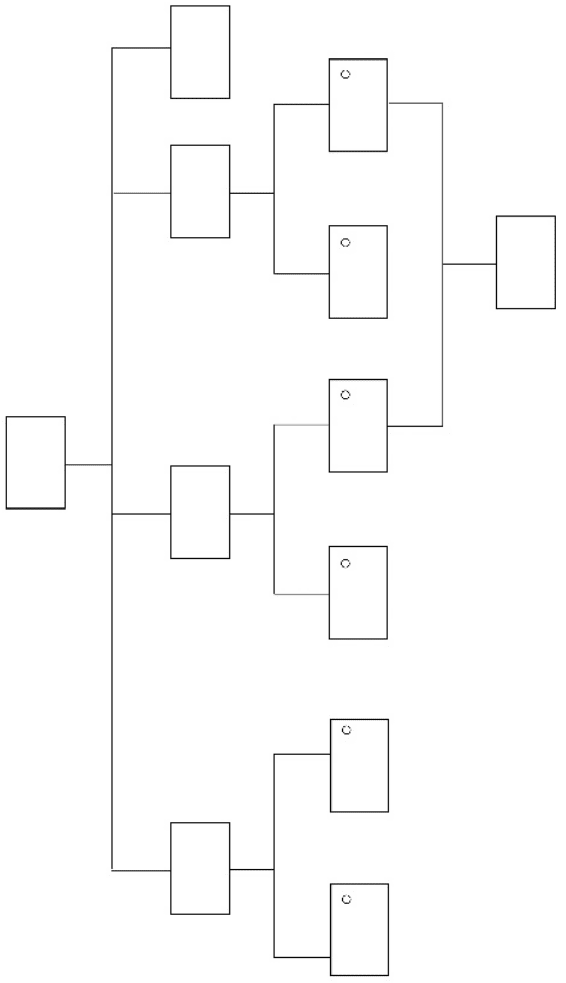
66 WHERE TO START?
Process
File
Valid
Filename?
Valid
File?
Return
Filename
Exit
Selected?
Exit Continue
Continue
If
Yes
If
No
If
Yes
If
No
If
No
If
Yes
Report
Error
Report
Error
Continue
Restart
Figure 9.1 Process flow diagram: looping until success or exit