Wooldridge J. Introductory Econometrics: A Modern Approach (Basic Text - 3d ed.)
Подождите немного. Документ загружается.


Before proceeding, it is important to remember that we are testing hypotheses about
the population parameters. We are not testing hypotheses about the estimates from a par-
ticular sample. Thus, it never makes sense to state a null hypothesis as “H
0
:
ˆ
1
0” or,
even worse, as “H
0
: .237 0” when the estimate of a parameter is .237 in the sample. We
are testing whether the unknown population value,
1
, is zero.
Some treatments of regression analysis define the t statistic as the absolute value of
(4.5), so that the t statistic is always positive. This practice has the drawback of making
testing against one-sided alternatives clumsy. Throughout this text, the t statistic always
has the same sign as the corresponding OLS coefficient estimate.
Testing against One-Sided Alternatives
In order to determine a rule for rejecting H
0
, we need to decide on the relevant alterna-
tive hypothesis. First, consider a one-sided alternative of the form
H
1
:
j
0. (4.6)
This means that we do not care about alternatives to H
0
of the form H
1
:
j
0; for
some reason, perhaps on the basis of introspection or economic theory, we are ruling
out population values of
j
less than zero. (Another way to think about this is that the
null hypothesis is actually H
0
:
j
0; in either case, the statistic t
ˆ
j
is used as the test
statistic.)
How should we choose a rejection rule? We must first decide on a significance level
or the probability of rejecting H
0
when it is in fact true. For concreteness, suppose we have
decided on a 5% significance level, as this is the most popular choice. Thus, we are will-
ing to mistakenly reject H
0
when it is true 5% of the time. Now, while t
ˆ
j
has a t distribu-
tion under H
0
—so that it has zero mean—under the alternative
j
0, the expected value
of t
ˆ
j
is positive. Thus, we are looking for a “sufficiently large” positive value of t
ˆ
j
in
order to reject H
0
:
j
0 in favor of H
1
:
j
0. Negative values of t
ˆ
j
provide no evidence
in favor of H
1
.
The definition of “sufficiently large,” with a 5% significance level, is the 95
th
percentile
in a t distribution with n k 1 degrees of freedom; denote this by c. In
other words, the rejection rule is that H
0
is rejected in favor of H
1
at the 5% significance
level if
t
ˆ
j
c. (4.7)
By our choice of the critical value c,rejection of H
0
will occur for 5% of all random sam-
ples when H
0
is true.
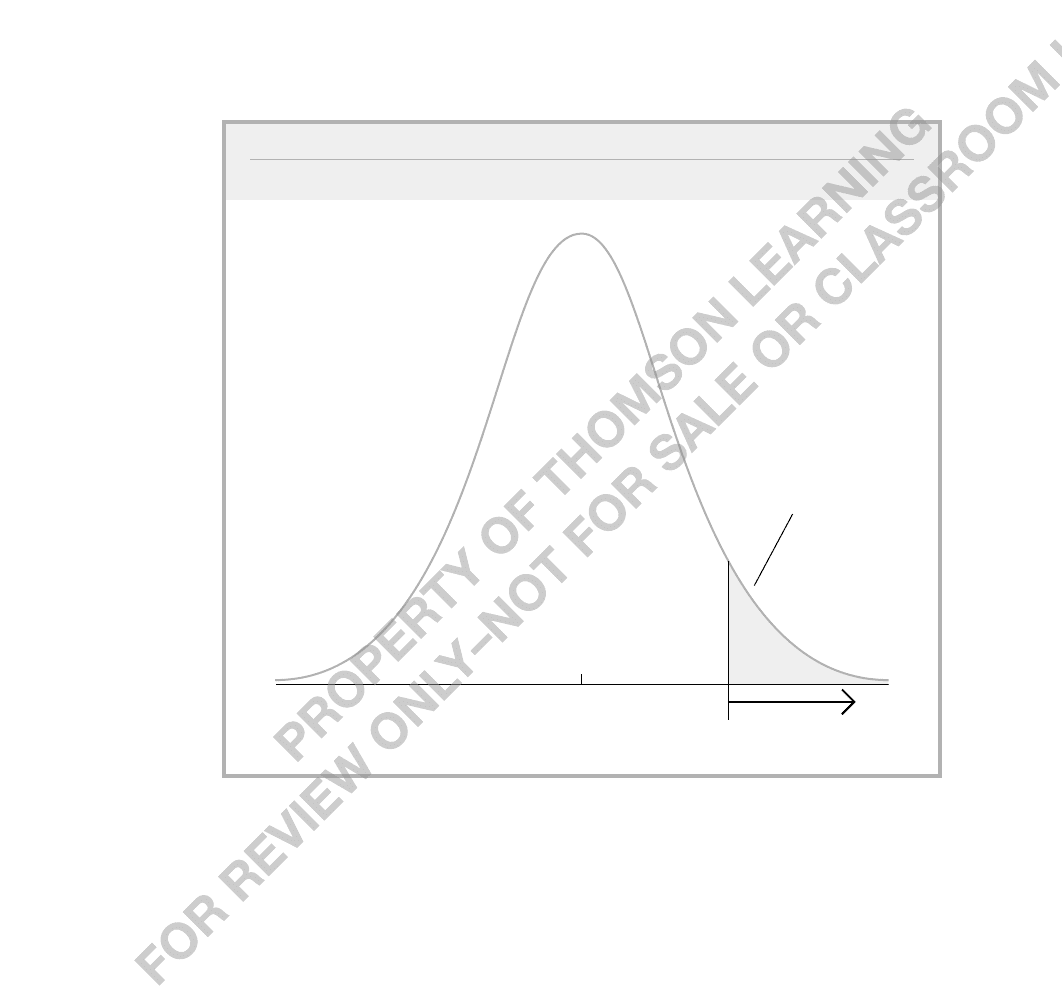
The rejection rule in (4.7) is an example of a one-tailed test. In order to obtain c,we
only need the significance level and the degrees of freedom. For example, for a 5% level
test and with n k 1 28 degrees of freedom, the critical value is c 1.701. If t
ˆ
j
1.701, then we fail to reject H
0
in favor of (4.6) at the 5% level. Note that a negative value
for t
ˆ
j
, no matter how large in absolute value, leads to a failure in rejecting H
0
in favor of
(4.6). (See Figure 4.2.)
Chapter 4 Multiple Regression Analysis: Inference 129
The same procedure can be used with other significance levels. For a 10% level test
and if df 21, the critical value is c 1.323. For a 1% significance level and if df 21,
c 2.518. All of these critical values are obtained directly from Table G.2. You should
note a pattern in the critical values: as the significance level falls, the critical value
increases, so that we require a larger and larger value of t
ˆ
j
in order to reject H
0
. Thus, if
H
0
is rejected at, say, the 5% level, then it is automatically rejected at the 10% level as
well. It makes no sense to reject the null hypothesis at, say, the 5% level and then to redo
the test to determine the outcome at the 10% level.
As the degrees of freedom in the t distribution gets large, the t distribution approaches
the standard normal distribution. For example, when n k 1 120, the 5% critical
value for the one-sided alternative (4.7) is 1.658, compared with the standard normal value
of 1.645. These are close enough for practical purposes; for degrees of freedom greater
than 120, one can use the standard normal critical values.
130 Part 1 Regression Analysis with Cross-Sectional Data
FIGURE 4.2
5% rejection rule for the alternative H
1
:
j
0 with 28 df.
0
1.701
rejection
region
Area = .05

Chapter 4 Multiple Regression Analysis: Inference 131
EXAMPLE 4.1
(Hourly Wage Equation)
Using the data in WAGE1.RAW gives the estimated equation
log(wage) .284 .092 educ .0041 exper .022) tenure
(.104) (.007) (.0017) (.003)
n 526, R
2
.316,
where standard errors appear in parentheses below the estimated coefficients. We will follow
this convention throughout the text. This equation can be used to test whether the return to
exper, controlling for educ and tenure, is zero in the population, against the alternative that
it is positive. Write this as H
0
:
exper
0 versus H
1
:
exper
0. (In applications, indexing a
parameter by its associated variable name is a nice way to label parameters, since the numer-
ical indices that we use in the general model are arbitrary and can cause confusion.) Remem-
ber that
exper
denotes the unknown population parameter. It is nonsense to write “H
0
: .0041
0” or “H
0
:
ˆ
exper
0.”
Since we have 522 degrees of freedom, we can use the standard normal critical values.
The 5% critical value is 1.645, and the 1% critical value is 2.326. The t statistic for
ˆ
exper
is
t
exper
.0041/.0017 2.41,
and so
ˆ
exper
, or exper, is statistically significant even at the 1% level. We also say that “
ˆ
exper
is statistically greater than zero at the 1% significance level.”
The estimated return for another year of experience, holding tenure and education fixed,
is not especially large. For example, adding three more years increases log(wage) by 3(.0041)
.0123, so wage is only about 1.2% higher. Nevertheless, we have persuasively shown that
the partial effect of experience is positive in the population.
The one-sided alternative that the parameter is less than zero,
H
1
:
j
0,
(4.8)
also arises in applications. The rejection rule for alternative (4.8) is just the mirror image
of the previous case. Now, the critical value comes from the left tail of the t distribution.
In practice, it is easiest to think of the rejection rule as
t
ˆ
j
c,
(4.9)
where c is the critical value for the alternative H
1
:
j
0. For simplicity, we always assume
c is positive, since this is how critical values are reported in t tables, and so the critical
value c is a negative number.

For example, if the significance level
is 5% and the degrees of freedom is 18,
then c 1.734, and so H
0
:
j
0 is
rejected in favor of H
1
:
j
0 at the 5%
level if t
ˆ
j
1.734. It is important to
remember that, to reject H
0
against the
negative alternative (4.8), we must get a
negative t statistic. A positive t ratio, no
matter how large, provides no evidence in
favor of (4.8). The rejection rule is illus-
trated in Figure 4.3.
132 Part 1 Regression Analysis with Cross-Sectional Data
FIGURE 4.3
5% rejection rule for the alternative H
1
:
j
0 with 18 df.
0
–1.734
rejection
region
Area = .05
Let community loan approval rates be determined by
apprate
0
1
percmin
2
avginc
3
avgwlth
4
avgdebt u,
where percmin is the percent minority in the community, avginc is
average income, avgwlth is average wealth, and avgdebt is some
measure of average debt obligations. How do you state the null
hypothesis that there is no difference in loan rates across neigh-
borhoods due to racial and ethnic composition, when average
income, average wealth, and average debt have been controlled
for? How do you state the alternative that there is discrimination
against minorities in loan approval rates?
QUESTION 4.2

Chapter 4 Multiple Regression Analysis: Inference 133
EXAMPLE 4.2
(Student Performance and School Size)
There is much interest in the effect of school size on student performance. (See, for example,
The New York Times Magazine, 5/28/95.) One claim is that, everything else being equal, stu-
dents at smaller schools fare better than those at larger schools. This hypothesis is assumed
to be true even after accounting for differences in class sizes across schools.
The file MEAP93.RAW contains data on 408 high schools in Michigan for the year 1993. We
can use these data to test the null hypothesis that school size has no effect on standardized test
scores against the alternative that size has a negative effect. Performance is measured by the per-
centage of students receiving a passing score on the Michigan Educational Assessment Program
(MEAP) standardized tenth-grade math test (math10). School size is measured by student enroll-
ment (enroll). The null hypothesis is H
0
:
enroll
0, and the alternative is H
1
:
enroll
0. For now,
we will control for two other factors, average annual teacher compensation (totcomp) and the
number of staff per one thousand students (staff). Teacher compensation is a measure of teacher
quality, and staff size is a rough measure of how much attention students receive.
The estimated equation, with standard errors in parentheses, is
math10 2.274 .00046 totcomp .048 staff .00020 enroll
(6.113) (.00010) (.040) (.00022)
n 408, R
2
.0541.
The coefficient on enroll, .00020, is in accordance with the conjecture that larger schools
hamper performance: higher enrollment leads to a lower percentage of students with a pass-
ing tenth-grade math score. (The coefficients on totcomp and staff also have the signs we
expect.) The fact that enroll has an estimated coefficient different from zero could just be due
to sampling error; to be convinced of an effect, we need to conduct a t test.
Since n k 1 408 4 404, we use the standard normal critical value. At the 5%
level, the critical value is 1.65; the t statistic on enroll must be less than 1.65 to reject H
0
at the 5% level.
The t statistic on enroll is .00020/.00022 .91, which is larger than 1.65: we fail to
reject H
0
in favor of H
1
at the 5% level. In fact, the 15% critical value is 1.04, and since
.91 1.04, we fail to reject H
0
even at the 15% level. We conclude that enroll is not sta-
tistically significant at the 15% level.
The variable totcomp is statistically significant even at the 1% significance level because its
t statistic is 4.6. On the other hand, the t statistic for staff is 1.2, and so we cannot reject H
0
:
staff
0 against H
1
:
staff
0 even at the 10% significance level. (The critical value is c
1.28 from the standard normal distribution.)
To illustrate how changing functional form can affect our conclusions, we also estimate the
model with all independent variables in logarithmic form. This allows, for example, the school
size effect to diminish as school size increases. The estimated equation is
math10 207.66 21.16 log(totcomp) 3.98 log(staff ) 1.29 log(enroll)
(48.70) (4.06) (4.19) (0.69)
n 408, R
2
.0654.

134 Part 1 Regression Analysis with Cross-Sectional Data
The t statistic on log(enroll) is about 1.87; since this is below the 5% critical value 1.65,
we reject H
0
:
log(enroll)
0 in favor of H
1
:
log(enroll)
0 at the 5% level.
In Chapter 2, we encountered a model where the dependent variable appeared in its original
form (called level form), while the independent variable appeared in log form (called level-log
model). The interpretation of the parameters is the same in the multiple regression context,
except, of course, that we can give the parameters a ceteris paribus interpretation. Holding tot-
comp and staff fixed, we have math10 1.29[log(enroll)], so that
math10 (1.29/100)(%enroll) .013(%enroll).
Once again, we have used the fact that the change in log(enroll), when multiplied by 100, is
approximately the percentage change in enroll. Thus, if enrollment is 10% higher at a school,
math10 is predicted to be .013(10)
0.13 percentage points lower (math10 is measured as
a percent).
Which model do we prefer: the one using the level of enroll or the one using log(enroll)?
In the level-level model, enrollment does not have a statistically significant effect, but in the
level-log model it does. This translates into a higher R-squared for the level-log model, which
means we explain more of the variation in math10 by using enroll in logarithmic form (6.5%
to 5.4%). The level-log model is preferred, as it more closely captures the relationship
between math10 and enroll. We will say more about using R-squared to choose functional
form in Chapter 6.
Two-Sided Alternatives
In applications, it is common to test the null hypothesis H
0
:
j
0 against a two-sided
alternative; that is,
H
1
:
j
0.
(4.10)
Under this alternative, x
j
has a ceteris paribus effect on y without specifying whether the
effect is positive or negative. This is the relevant alternative when the sign of
j
is not well
determined by theory (or common sense). Even when we know whether
j
is positive or
negative under the alternative, a two-sided test is often prudent. At a minimum, using a two-
sided alternative prevents us from looking at the estimated equation and then basing the
alternative on whether
ˆ
j
is positive or negative. Using the regression estimates to help us
formulate the null or alternative hypotheses is not allowed because classical statistical infer-
ence presumes that we state the null and alternative about the population before looking at
the data. For example, we should not first estimate the equation relating math performance
to enrollment, note that the estimated effect is negative, and then decide the relevant alter-
native is H
1
:
enroll
0.
When the alternative is two-sided, we are interested in the absolute value of the t sta-
tistic. The rejection rule for H
0
:
j
0 against (4.10) is
t
ˆ
j
c,
(4.11)
where denotes absolute value and c is an appropriately chosen critical value. To find c,
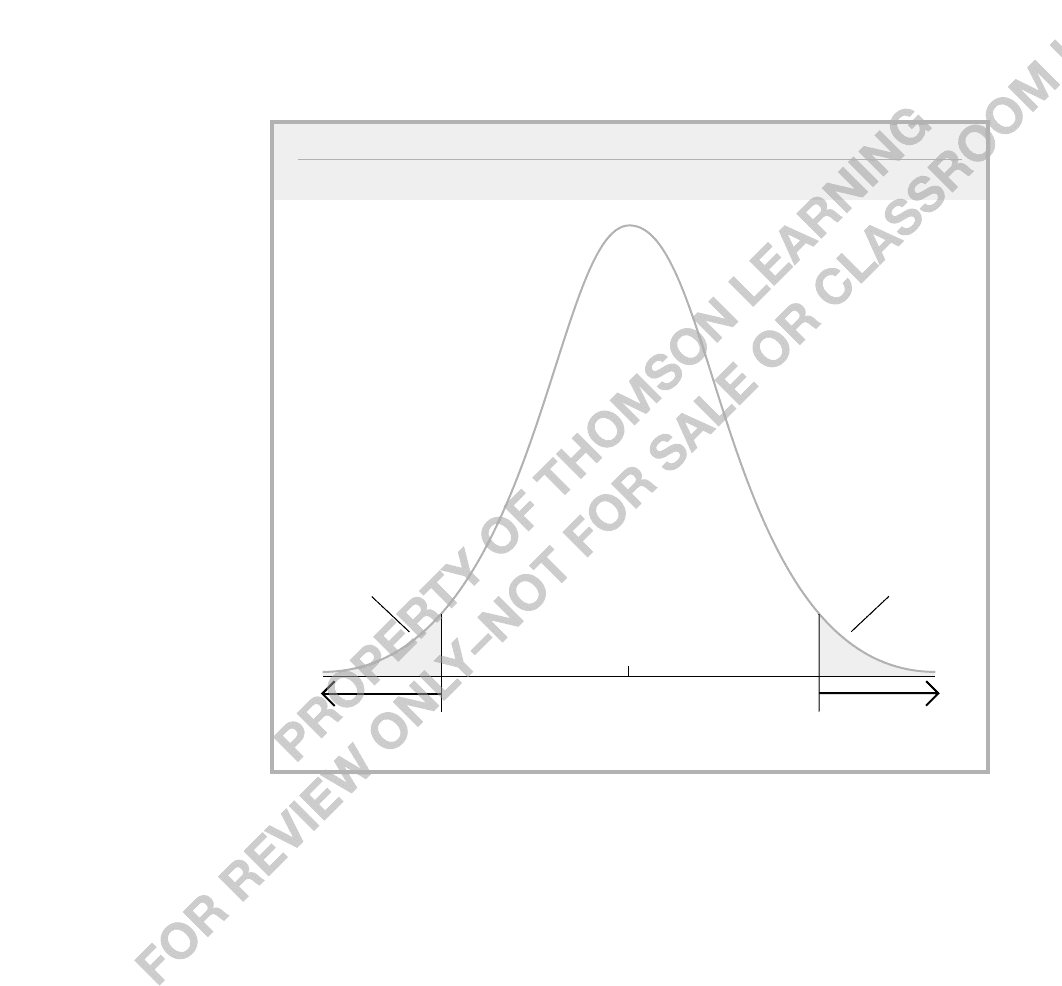
we again specify a significance level, say 5%. For a two-tailed test, c is chosen to make
the area in each tail of the t distribution equal 2.5%. In other words, c is the 97.5
th
per-
centile in the t distribution with n k 1 degrees of freedom. When n k 1 25,
the 5% critical value for a two-sided test is c 2.060. Figure 4.4 provides an illustration
of this distribution.
When a specific alternative is not stated, it is usually considered to be two-sided. In
the remainder of this text, the default will be a two-sided alternative, and 5% will be the
default significance level. When carrying out empirical econometric analysis, it is always
a good idea to be explicit about the alternative and the significance level. If H
0
is rejected
in favor of (4.10) at the 5% level, we usually say that “x
j
is statistically significant,or
statistically different from zero, at the 5% level.” If H
0
is not rejected, we say that “x
j
is
statistically insignificant at the 5% level.”
Chapter 4 Multiple Regression Analysis: Inference 135
0
–2.06
rejection
region
Area = .025
2.06
rejection
region
Area = .025
FIGURE 4.4
5% rejection rule for the alternative H
1
:
j
0 with 25 df.

136 Part 1 Regression Analysis with Cross-Sectional Data
EXAMPLE 4.3
(Determinants of College GPA)
We use GPA1.RAW to estimate a model explaining college GPA (colGPA), with the average
number of lectures missed per week (skipped) as an additional explanatory variable. The esti-
mated model is
colGPA 1.39 .412 hsGPA .015 ACT .083) skipped
(.33) (.094) (.011) (.026)
n 141, R
2
.234.
We can easily compute t statistics to see which variables are statistically significant, using a
two-sided alternative in each case. The 5% critical value is about 1.96, since the degrees of
freedom (141 4 137) is large enough to use the standard normal approximation. The
1% critical value is about 2.58.
The t statistic on hsGPA is 4.38, which is significant at very small significance levels. Thus,
we say that “hsGPA is statistically significant at any conventional significance level.” The t sta-
tistic on ACT is 1.36, which is not statistically significant at the 10% level against a two-sided
alternative. The coefficient on ACT is also practically small: a 10-point increase in ACT, which
is large, is predicted to increase colGPA by only .15 point. Thus, the variable ACT is practically,
as well as statistically, insignificant.
The coefficient on skipped has a t statistic of .083/.026 3.19, so skipped is statistically
significant at the 1% significance level (3.19 2.58). This coefficient means that another lec-
ture missed per week lowers predicted colGPA by about .083. Thus, holding hsGPA and ACT
fixed, the predicted difference in colGPA between a student who misses no lectures per week
and a student who misses five lectures per week is about .42. Remember that this says nothing
about specific students, but pertains to average students across the population.
In this example, for each variable in the model, we could argue that a one-sided alter-
native is appropriate. The variables hsGPA and skipped are very significant using a two-
tailed test and have the signs that we expect, so there is no reason to do a one-tailed test.
On the other hand, against a one-sided alternative (
3
0), ACT is significant at the 10%
level but not at the 5% level. This does not change the fact that the coefficient on ACT is
pretty small.
Testing Other Hypotheses about b
j
Although H
0
:
j
0 is the most common hypothesis, we sometimes want to test whether
j
is equal to some other given constant. Two common examples are
j
1 and
j
1.
Generally, if the null is stated as
H
0
:
j
a
j
, (4.12)
where a
j
is our hypothesized value of
j
, then the appropriate t statistic is
t (
ˆ
j
a
j
)/se(
ˆ
j
).

Chapter 4 Multiple Regression Analysis: Inference 137
As before, t measures how many estimated standard deviations
ˆ
j
is away from the hypoth-
esized value of
j
. The general t statistic is usefully written as
t .
(4.13)
Under (4.12), this t statistic is distributed as t
nk1
from Theorem 4.2. The usual t statis-
tic is obtained when a
j
0.
We can use the general t statistic to test against one-sided or two-sided alternatives. For
example, if the null and alternative hypotheses are H
0
:
j
1 and H
1
:
j
1, then we find
the critical value for a one-sided alternative exactly as before: the difference is in how we
compute the t statistic, not in how we obtain the appropriate c. We reject H
0
in favor of
H
1
if t c. In this case, we would say that “
ˆ
j
is statistically greater than one” at the appro-
priate significance level.
EXAMPLE 4.4
(Campus Crime and Enrollment)
Consider a simple model relating the annual number of crimes on college campuses (crime)
to student enrollment (enroll):
log(crime)
0
1
log(enroll) u.
This is a constant elasticity model, where
1
is the elasticity of crime with respect to enroll-
ment. It is not much use to test H
0
:
1
0, as we expect the total number of crimes to increase
as the size of the campus increases. A more interesting hypothesis to test would be that the
elasticity of crime with respect to enrollment is one: H
0
:
1
1. This means that a 1% increase
in enrollment leads to, on average, a 1% increase in crime. A noteworthy alternative is H
1
:
1
1, which implies that a 1% increase in enrollment increases campus crime by more than
1%. If
1
1, then, in a relative sense—not just an absolute sense—crime is more of a prob-
lem on larger campuses. One way to see this is to take the exponential of the equation:
crime exp(
0
)enroll
1
exp(u).
(See Appendix A for properties of the natural logarithm and exponential functions.) For
0
0 and u 0, this equation is graphed in Figure 4.5 for
1
1,
1
1, and
1
1.
We test
1
1 against
1
1 using data on 97 colleges and universities in the United
States for the year 1992, contained in the data file CAMPUS.RAW. The data come from the
FBI’s Uniform Crime Reports, and the average number of campus crimes in the sample is about
394, while the average enrollment is about 16,076. The estimated equation (with estimates
and standard errors rounded to two decimal places) is
log(crime) 6.63 1.27 log(enroll)
(1.03) (0.11)
n 97, R
2
.585.
(4.14)
(estimate hypothesized value)
standard error

138 Part 1 Regression Analysis with Cross-Sectional Data
FIGURE 4.5
Graph of crime enroll
1
for
1
1,
1
1, and
1
1.
0
b
1
= 1
crime
enroll
b
1
> 1
b
1
< 1
0
The estimated elasticity of crime with respect to enroll, 1.27, is in the direction of the alter-
native
1
1. But is there enough evidence to conclude that
1
1? We need to be careful
in testing this hypothesis, especially because the statistical output of standard regression pack-
ages is much more complex than the simplified output reported in equation (4.14). Our first
instinct might be to construct “the” t statistic by taking the coefficient on log(enroll) and divid-
ing it by its standard error, which is the t statistic reported by a regression package. But this
is the wrong statistic for testing H
0
:
1
1. The correct t statistic is obtained from (4.13): we
subtract the hypothesized value, unity, from the estimate and divide the result by the stan-
dard error of
ˆ
1
: t (1.27 1)/.11 .27/.11 2.45. The one-sided 5% critical value for a
t distribution with 97 2 95 df is about 1.66 (using df 120), so we clearly reject
1
1 in favor of
1
1 at the 5% level. In fact, the 1% critical value is about 2.37, and so we
reject the null in favor of the alternative at even the 1% level.
We should keep in mind that this analysis holds no other factors constant, so the elasticity of
1.27 is not necessarily a good estimate of ceteris paribus effect. It could be that larger enrollments
are correlated with other factors that cause higher crime: larger schools might be located in higher
crime areas. We could control for this by collecting data on crime rates in the local city.