Ahmed S.N. Physics and Engineering of Radiation Detection
Подождите немного. Документ загружается.

586 Chapter 10. Software for Data Analysis
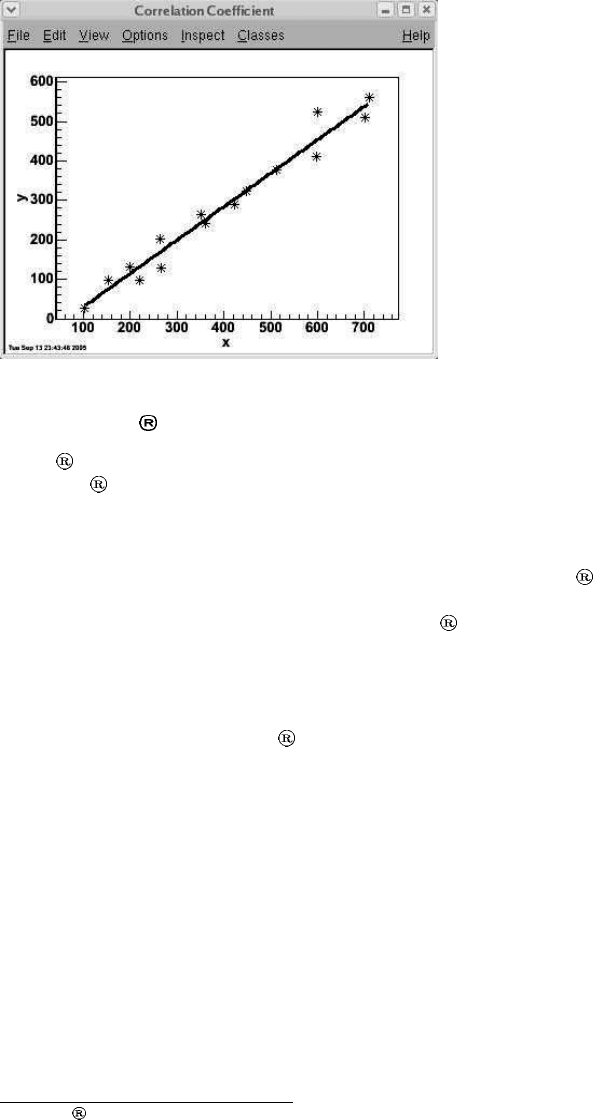
Figure 10.1.14: Straight line fit
of the data.
10.1.B Origin
Origin
1
is an easy-to-use and a very versatile data analysis package developed by
OriginLab
Corporation. One of its attractive features is its ability to produce
production and presentation quality graphics. But perhaps its strongest point is its
use of well tested numerical algorithms from Numerical Algorithms Group (NAG).
These algorithms and their C libraries have been independently developed and tested
by the NAG and are known to produce dependable results. Origin
provides access
to these libraries from not only the simple menu driven point-and-click commands
but also through its own C language called Origin
C. This slightly modified form
of ANSI C language includes some features of C++ as well. Its compiler has been
built to fully recognize ANSI C and therefore a user can choose to write code in
simple C and still be able to call NAG routines.
Following are some examples of the types of analysis performed through NAG
data analysis routines in Origin
.
Descriptive statistics
Correlation analysis
Regression analysis
Interpolation
Curve fitting
Surface fitting
Nonparametric statistics
Fourier transformation
1
Origin
is a registered trademark of OriginLab Corporation.
10.1. Standard Analysis Packages 587
Most of the tasks in Origin can be performed through its menu driven com-
mands. However to develop a complete customized data analysis package one can
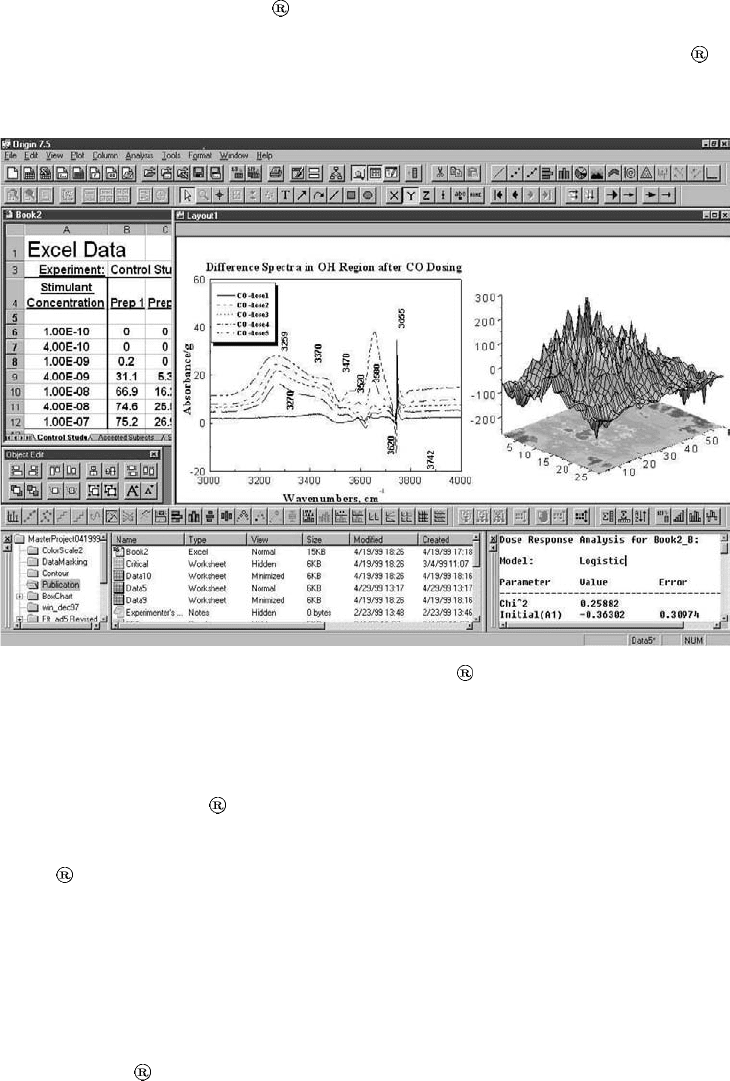
choose to use its programming environment. A typical screen shot of Origin
is
shown in Fig.10.1.15. Note that here we have converted the image into gray scale
from its original multicolor version.
Figure 10.1.15: A typical screen shot of Origin (courtesy of OriginLab)
B.1 Data Import Capabilities
In order to make Origin compatible with most of the standard software packages,
its authors have designed it such that it could handle very diverse data file types
used by other standard softwares. Following are some of the data formats for which
Origin
has built in import utilities.
ASCII delimited text (DAT, CSV, TXT, etc.)
Lotus
Data Interchange Format
Thermo Galactic SPC
MATLAB
MiniTab
588 Chapter 10. Software for Data Analysis
LabTech
SigmaPlot
Sound (WAV)
Mathematica
Kaleidagraph
pCLAMP (Axon binary and data files)
Microsoft Excel spreadsheet
In addition to these formats, it can also access data from SQL
2
Server, MySQL
3
,
Microsoft Access and other databases using ODBC
4
. The user can also import data
written in any other format as long as the details of the format are known. In this
way Origin
can handle any ASCII or binary data type. The good thing about
built in data import function is that the user can import data without worrying
about the format.
The newer version of Origin
has a data import wizard that takes the user
stepwise through the process. The user then has the option to select different options
including the format of items to be imported. Several data filtration options are also
available, which can save the user from performing these function later in the code.
B.2 Graphics Capabilities
The graphics capabilities of Origin are one of the finest available in commercial
data analysis packages. With Origin
one can generate essentially any type of two
or three dimensional graph. The graphs can be generated either using Origin
C
language or through menu driven commands. The graphs can also be edited using
user interfaces.
B.3 Data Analysis Capabilities
Origin ’s data analysis libraries are based on NAG
5
routines, which are not only
reliable but are also known for fast algorithms. This assures the user that the
analysis is being performed by one of the best codes available.
Origin
provides the user with a very broad range of data analysis libraries
and methods. Following are some examples of the types of analysis that can be
performed in Origin
. This list is not complete and the interested reader should
consult Origin
manualforanuptodatelist.
Linear and Polynomial Regression
Nonlinear Curve Fitting
2
Structured Query Language or SQL is a computer language used for data handling from relational
database management systems.
3
MySQL is a multithreaded, multiuser SQL database management system.
4
ODBC is an acronym for Open Database Connectivity. It provides a standard software application
programming interface method for using database management systems.
5
NAG stands for Numerical Algorithms Group. The group has released a large number of numerical
computation libraries for C and C++.
10.1. Standard Analysis Packages 589
Signal Analysis
Baseline and Peak Finding
Curve smoothing
Descriptive Statistics
One and Two Way ANOVA
t-Test
Survival Analysis
B.4 Programming Environment
Origin has a powerful development environment Code Builder to write, compile,
link, run, and debug code in its specifically designed language Origin
C.Origin
C is fully compatible with ANSI C but also includes some features of C++. A strong
base of NAG C libraries are also available to facilitate designing of custom analysis
packages.
B.5 Examples
LetusnowhavealookatafewexamplesofOrigin usage. It should be pointed
out that here we will be performing very simple analyses, which are not meant to
analyze the effectiveness of Origin
as a data analysis package. We simply want
that the user gets a glimpse of how one uses Origin
and how easy it is to use as
an analysis platform.
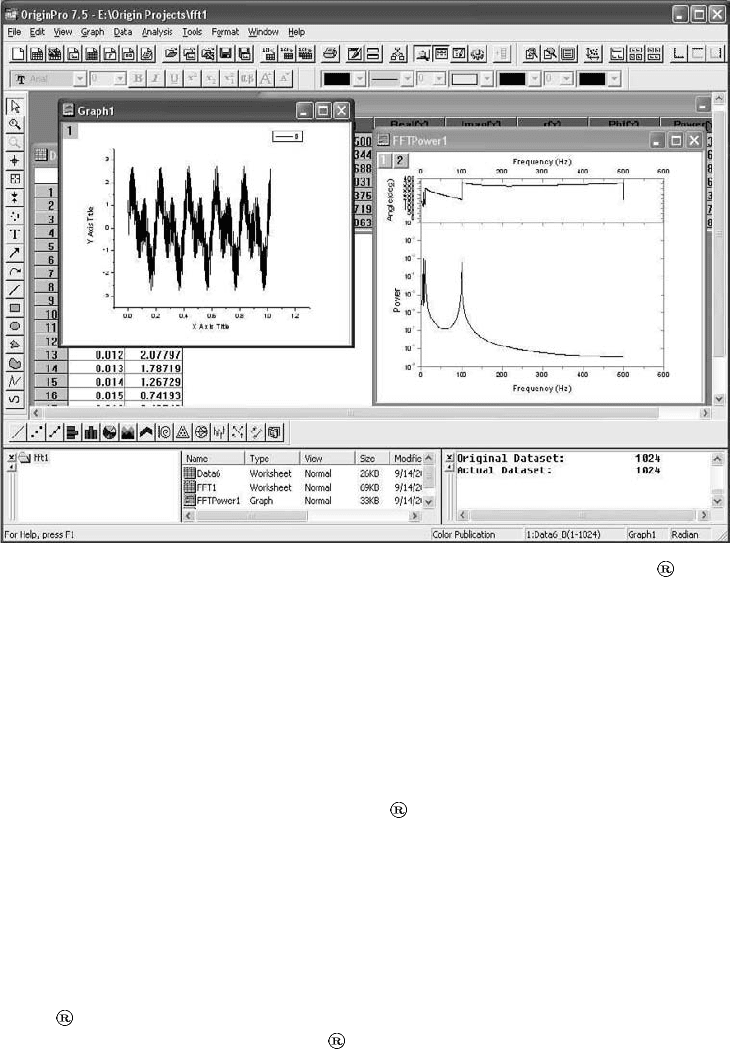
Let us first assume that we have some data that we have gathered from a detector
at equal intervals of time. First we want to quickly look at the data and have a
qualitative idea of its time evolution. For this first we must import the data into
Origin
’s spreadsheet. The newer version of Origin has an import wizard,which
can be used to import any type of data. Import wizard is a very user friendly
interface that guides the user step wise through the data import process. At the
end, it dumps the data in the chosen spreadsheet. We use this wizard to import
the data and then plot it by first selecting the columns and then invoking the Line
command from the Plot pull down menu. This produces the desired graph as shown
on the left of Fig.10.1.16. Now, by looking at this time series we realize that there
are some periodicity in the data. The best way to determine the periodicities is to
perform a fast Fourier transform or FFT of the data. Performing FFT in Origin
is simply a matter of a few mouse clicks since a number of FFT algorithms are
already built into its library. First we select the data columns and then from the
Analysis pull down menu we invoke the FFT method. A pop up menu appears,
where one could change the box method for FFT, choose between Amplitude and
Power, and select some other functions. The result of the FFT appears in a new table
that contains frequencies, real and imaginary components, phase, and amplitude or
power. The amplitude or power density and phase are also automatically plotted in
a publication quality template as shown on the right side of Fig.10.1.16. It is obvious
that the frequencies in the data get clearly marked in the power density spectrum.
This method of finding periodicities in the data is very common. It, however, has a
590 Chapter 10. Software for Data Analysis
Figure 10.1.16: Plotting a time series and performing FFT in Origin .
limitation that the data must be regularly spaced and must have been sampled at
or above the Nyquist frequency (see chapter on data analysis and statistics). For
irregularly spaced data one can use Lomb method instead of Fourier transform.
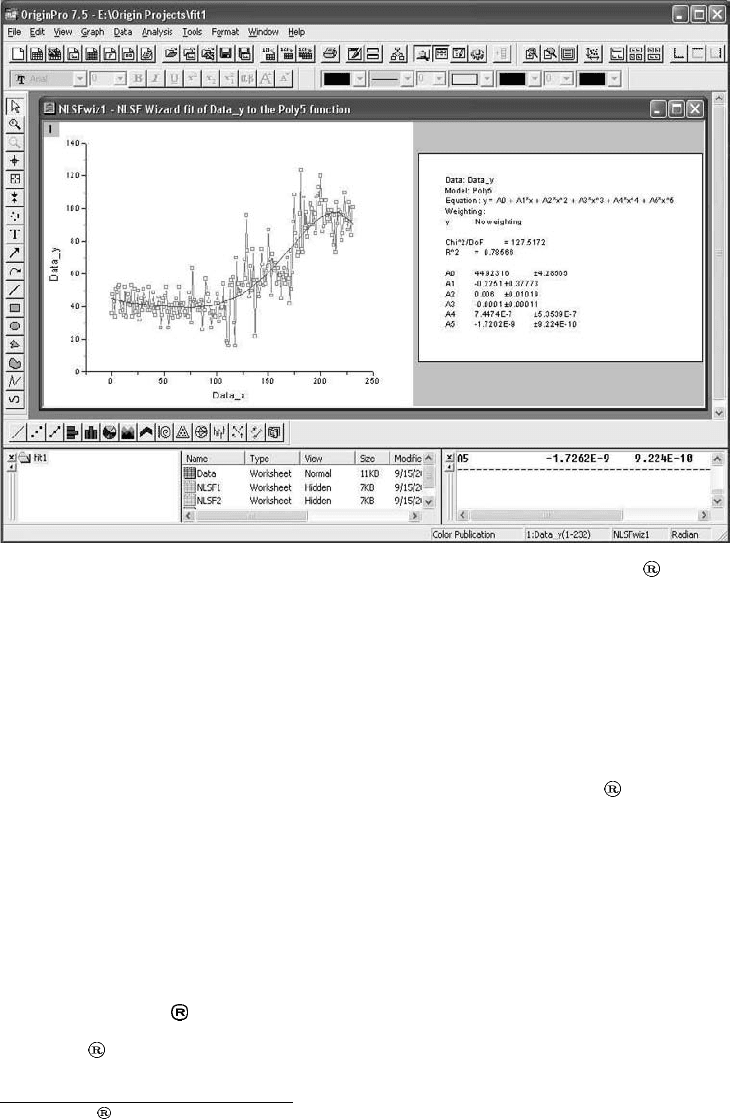
Let us now move to another example. What we now want is to fit a nonlinear
function to some data. We follow the same steps as outlined in the previous example
to import the data and to plot it. Then from the Tools pull down menu we select
Nonlinear fit wizard method. A pop up window appears where one could choose the
fitting function or define a new one. Origin
has a very large number of built in
functions and one rarely needs to define another one. For our example, we chose
to fit a 5th order polynomial to the data. The result is shown in Fig.10.1.17. The
statistics related to the fit are also displayed along with the plot. The fitted curve
itself is superimposed on the actual data plot, giving the user a qualitative way to
judge the fit. Another very useful feature of fitting wizard is that it also shows a
visual of the selected fitting function, which gives the user some idea of whether the
function would be a good fit to the data or not.
All of the fitting functions available in the fitting wizard are also available in
Origin
C. Hence, if one decides to write a code for data analysis, all these methods
can be called by using built in Origin
C functions. This route is generally chosen
for analysis of large datasets that have to be analyzed repeatedly through the same
method. In such a case one is better off writing a code once and running it each
time instead of invoking the menu driven functions time and again.
10.1. Standard Analysis Packages 591
Figure 10.1.17: Result of fitting a 5th order polynomial in Origin .
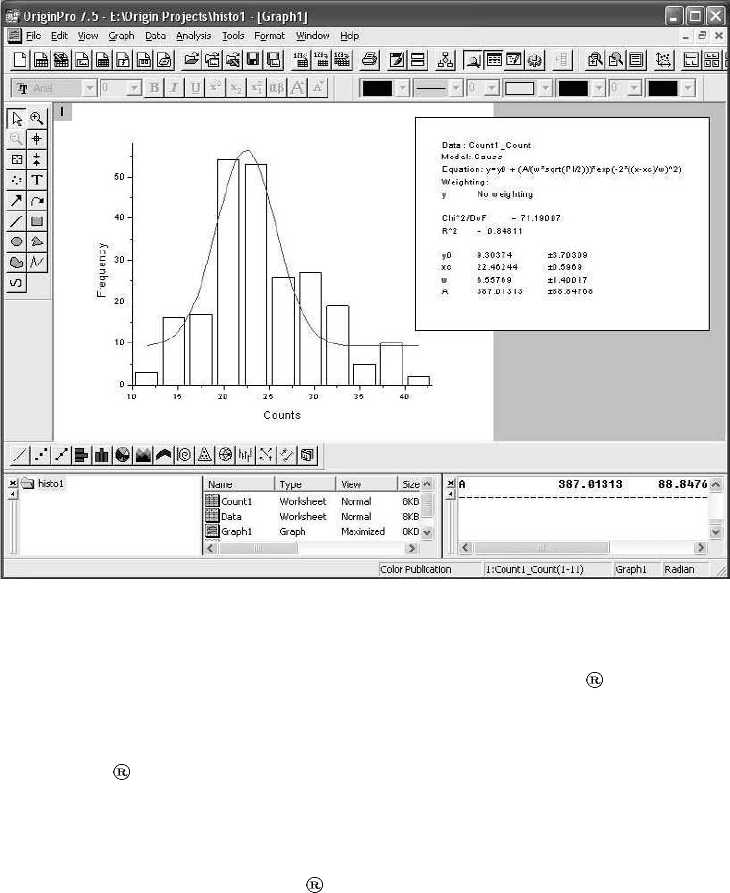
We now go to another example. Suppose we have a dataset of which we want
draw a histogram. Recall that a histogram is a plot of the frequencies at which the
parameter assumes different values. A histogram is a very important tool since it
characterizes the distribution function of the parameter under consideration. And if
we know the distribution function of a parameter we can determine the expectation
value of the parameter under any confidence interval (see chapter on data analysis).
So,wehavesomedatathatweimportusingimportwizardofOrigin
.Thenfrom
the Statistics pull down menu we choose the frequency function. A pop up menu
appear with minimum and maximum values of the parameter along with a bin size.
All these values can be changed if needed. The result of the frequency count appears
in a table, which can then be plotted by using the Plot pull down menu. Fig.10.1.18
shows the histogram plotted as a bar chart. As the second step to the process we
tried to fit a Gaussian function to it using the fitting wizard. The result has been
plotted on the same histogram.
10.1.C MATLAB
MATLAB
6
is a very powerful high level computing language and interactive devel-
opment environment developed by Mathworks. It is capable of handling extremely
6
MATLAB
is a registered trademark of The MathWorks, Inc.
592 Chapter 10. Software for Data Analysis
Figure 10.1.18: A histogram and its Gaussian fit.
complicated data analysis and visualization tasks. The MATLAB
programming
language is an easy-to-learn and easy-to-use high level language, which, together
with its interactive environment, provides the user with the capability of integrating
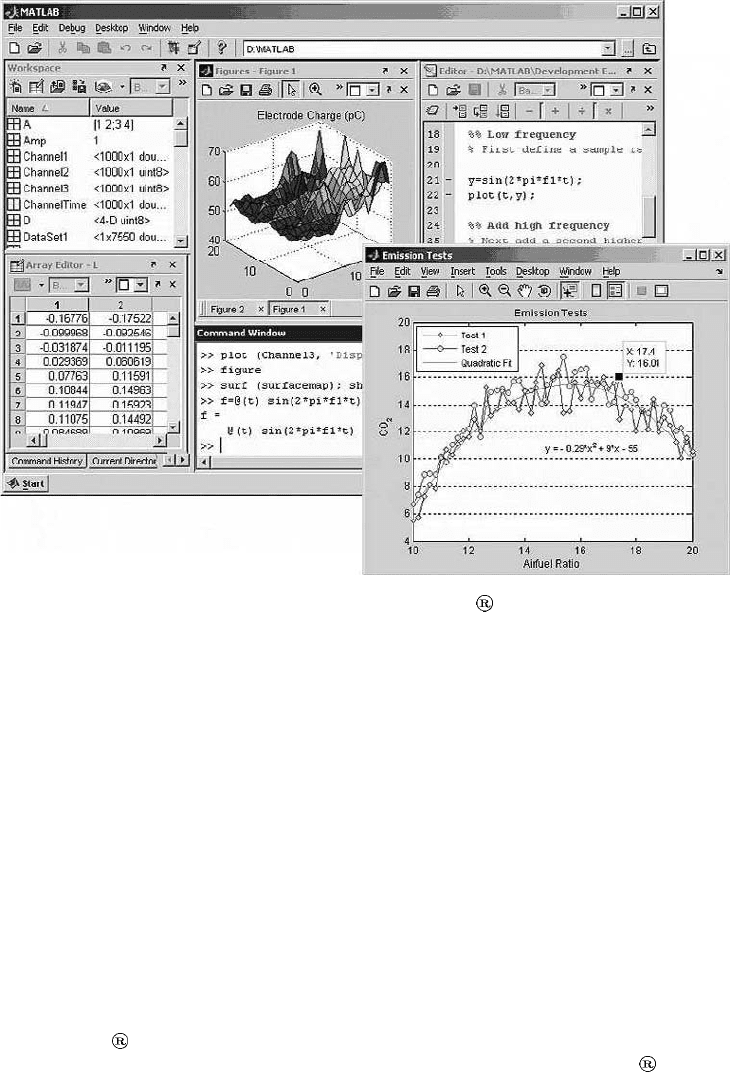
the code with other languages, such as C, C++, and Fortran. A typical screen shot
of MATLAB
’s development environment is shown in Fig.10.1.19. It should be
noted that here the original multicolor image has been transformed into gray scale.
C.1 Toolboxes
A very strong feature of MATLAB is that it has a number of very powerful tool-
boxes to perform specific tasks. These toolboxes are add ons to the standard package
and must therefore be installed before their respective functions could be used. Some
of these toolboxes are listed below.
Statistics toolbox
Curve fitting toolbox
Optimization toolbox
Control system toolbox
10.1. Standard Analysis Packages 593
Figure 10.1.19: A typical screen shot of MATLAB ’s interactive development
environment (courtesy of Mathworks).
Fuzzy logic toolbox
Signal processing toolbox
Filter design toolbox
Image processing toolbox
Image acquisition toolbox
Data acquisition toolbox
Instrument control toolbox
Database toolbox
Of course here we have listed only a few of the full range of toolboxes available
in MATLAB
. For the complete and up to date list the reader should refer to the
web site of Mathworks. A quick look at this list reveals that MATLAB
is more
than a simple data analysis package. Data analysis is merely a part of the extremely
diverse tasks it can perform.
594 Chapter 10. Software for Data Analysis
C.2 Data Acquisition and Import Capabilities
MATLAB allows the user to import data from different sources in a variety of
formats, such as
ASCII text file,
Microsoft Excel file,
Image file in any standard graphics format,
Sound file, and
Video file.
The user can also access other types of binary files, files from web pages, and
XML files through low-level functions available in MATLAB
.
MATLAB
also has a data acquisition tool box, which can be used to acquire
data from hardware devices. Examples of such devices are computer’s standard
communication ports and custom designed computer interface cards. The online
data acquisition coupled with real time analysis libraries and database support make
MATLAB
a complete data acquisition, analysis, and storage system.
C.3 Data Analysis Capabilities
As mentioned before MATLAB has a number of toolboxes to handle essentially any
data analysis task. However the standard package also has most of the commonly
used data analysis functions, such as
Descriptive Statistics,
Curve Fitting,
Correlation,
Filtering,
Fourier transformation,
Matrix analysis,
Interpolation, and
Smoothing.
C.4 Visualization Capabilities
MATLAB has very strong and user friendly plotting libraries to produce publica-
tion level plots. It also has an interactive environment where users can modify and
create graphics. This environment can be used to change the shape and properties of
any object on the figure. One can also drag-and-drop new data sets onto an existing
figure. Furthermore, operations like zooming in/out, rotating, and panning are also
available.
Any type of two and three dimensional graph can be produced in MATLAB
through a few mouse clicks or by writing a few lines of code. The figures generated
are of very high quality and ready for publication. The two dimensional plotting
functions available in MATLAB
include the following.
10.1. Standard Analysis Packages 595
Scatter, line, bar, and pie charts
Histograms
Animations
Polygons and surfaces
MATLAB
also has three dimensional plotting capabilities. For example, one
can create surface, contour, or mesh plots from data and also create 3-D surfaces
interactively.
C.5 Programming Environment
As stated earlier, MATLAB is a high level programming language with very strong
library support. There are very large number of mathematical and statistical func-
tions available in MATLAB
that can be accessed through high level commands of
its language. MATLAB
language is different from traditional programming lan-
guages in that it has a high level and very easy-to-use syntax. For example, the user
does not have to worry about declaring variables or initializing them before use. A
new user can learn the basic syntax very quickly and can even start writing the code
in the first learning session.
C.6 Examples
Let us now have a look at a few examples of MATLAB usage. What we want is
to first generate a time series consisting of three sinusoidal frequencies and white
noise. We then want to plot the series. After that we want to perform its Fourier
transform and plot the power spectral density. Although we can perform these tasks
on the command line interface of MATLAB
but it is always better to write all
the commands in a macro and run it. The program written in the code editor of
MATLAB
is shown in Fig.10.1.20. The different lines in the code are explained
below.
Line 1-3: Comments that are ignored by the compiler.
Line 5: Generates the time axis from 0 to 5 seconds at steps of 0.001 second.
This is equivalent to sampling the data at 1/0.001 = 1 kHz. Hence, according
to the Nyquist theorem, we should be able to identify frequencies of up to 500
Hz in the dataset.
Line 6: Generates the data (which could be ADC counts) consisting of four
sinusoids with frequencies of 50 Hz, 100 Hz, 150 Hz, and 100 Hz.Wehave
arbitrarily assigned weights to these sinusoids as well. The factor 300 is also
arbitrary and is meant to keep the data values positive at all times.
Line 7: Adds white (random) noise to the values generated in the previous
step.
Line 8: Creates first canvas for the figure. This is not needed if one intends
to generate only one figure.
Line 9: Plots the time series (see Fig.10.1.21).