Anderson D.R., Sweeney D.J., Williams T.A. Essentials of Statistics for Business and Economics
Подождите немного. Документ загружается.


11.1 Inferences About the Difference Between Two Population Proportions 455
b. What is the point estimate of the proportion of men who say slots is their favorite game?
c. Provide a 95% confidence interval estimate of the difference between the proportion
of women and proportion of men who say slots is their favorite game.
6. BusinessWeek reported that there seems to be a difference by age group in how well people
like life in Russia (BusinessWeek, March 10, 2008). The following sample data are consis-
tent with the BusinessWeek findings and show the responses by age group to the question:
“Do you like life in Russia?”
a. State the hypotheses that can be used to determine whether the population proportions
of delayed departures differ at these two airports.
Chicago O’Hare Atlanta Hartsfield-Jackson
Flights 900 1200
Delayed Departures 252 312
a. What is the point estimate of the proportion of Russians aged 17 to 26 who like life in
Russia?
b. What is the point estimate of the proportion of Russians aged 40 and over who like life
in Russia?
c. Provide a 95% confidence interval estimate of the difference between the proportion
of young Russians aged 17 to 26 and older Russians aged 40 and over who like life in
Russia.
7. An American Automobile Association (AAA) study investigated the question of whether a
man or a woman was more likely to stop and ask for directions (AAA, January 2006). The
situation referred to in the study stated the following: “If you and your spouse are driving
together and become lost, would you stop and ask for directions?” Asample representative
of the data used by AAA showed 300 of 811 women said that they would stop and ask for
directions, while 255 of 750 men said that they would stop and ask for directions.
a. The AAA research hypothesis was that women would be more likely to say that they
would stop and ask for directions. Formulate the null and alternative hypotheses for
this study.
b. What is the percentage of women who indicated that they would stop and ask for
directions?
c. What is the percentage of men who indicated that they would stop and ask for
directions?
d. At
α ⫽ .05, test the hypothesis. What is the p-value, and what conclusion would you
expect AAA to draw from this study?
8. Chicago O’Hare and Atlanta Hartsfield-Jackson are the two busiest airports in the United
States. The congestion often leads to delayed flight arrivals as well as delayed flight
departures. The Bureau of Transportation tracks the on-time and delayed performance at
major airports (Travel & Leisure, November 2006). A flight is considered delayed if it is
more than 15 minutes behind schedule. The following sample data show the delayed
departures at Chicago O’Hare and Atlanta Hartsfield-Jackson airports.
Russian Age Group
17–26 40 and over
Sample 300 260
Responded Yes 192 117
CH011.qxd 8/16/10 6:57 PM Page 455
Copyright 2010 Cengage Learning. All Rights Reserved. May not be copied, scanned, or duplicated, in whole or in part. Due to electronic rights, some third party content may be suppressed from the eBook and/or eChapter(s).
Editorial review has deemed that any suppressed content does not materially affect the overall learning experience. Cengage Learning reserves the right to remove additional content at any time if subsequent rights restrictions require it.

456 Chapter 11 Comparisons Involving Proportions and a Test of Independence
Liked the
Age Group Sample Size Ad a Lot
Under 30 100 49
30 to 49 150 54
a. Formulate a hypothesis test that can be used to determine whether the population
proportions for the two age groups differ.
b. What is the point estimate of the difference between the two population proportions?
c. Conduct the hypothesis test and report the p-value. At α ⫽ .05, what is your conclusion?
d. Discuss the appeal of the advertisements to the younger and the older age groups.
Would the Miller Lite organization find the results of the USA Today Ad Track poll
encouraging? Explain.
11.2 Hypothesis Test for Proportions
of a Multinomial Population
In this section, we consider hypothesis tests concerning the proportion of elements in a
population belonging to each of several classes or categories. In contrast to the preceding
section, we deal with a single population: a multinomial population. The parameters of
the multinomial population are the proportion of elements belonging to each category; the
hypothesis tests we describe concern the value of those parameters. The multinomial proba-
bility distribution can be thought of as an extension of the binomial distribution to the case
of three or more categories of outcomes. On each trial of a multinomial experiment, one
and only one of the outcomes occurs. Each trial of the experiment is assumed independent,
and the probabilities of the outcomes stay the same for each trial.
As an example, consider the market share study being conducted by Scott Marketing
Research. Over the past year market shares stabilized at 30% for company A, 50% for
b. What is the point estimate of the proportion of flights that have delayed departures at
Chicago O’Hare?
c. What is the point estimate of the proportion of flights that have delayed departures at
Atlanta Hartsfield-Jackson?
d. What is the p-value for the hypothesis test? What is your conclusion?
9. A2003 New York Times/
CBS News poll sampled 523 adults who were planning a vacation
during the next six months and found that 141 were expecting to travel by airplane (New
York Times News Service, March 2, 2003). A similar survey question in a May 1993 New
York Times/
CBS News poll found that of 477 adults who were planning a vacation in the
next six months, 81 were expecting to travel by airplane.
a. State the hypotheses that can be used to determine whether a significant change occurred
in the population proportion planning to travel by airplane over the 10-year period.
b. What is the sample proportion expecting to travel by airplane in 2003? In 1993?
c. Use α ⫽ .01 and test for a significant difference. What is your conclusion?
d. Discuss reasons that might provide an explanation for this conclusion.
10. During the 2003 Super Bowl, Miller Lite Beer’s commercial referred to as “The Miller Lite
Girls” ranked among the top three most effective advertisements aired during the Super
Bowl (USA Today, December 29, 2003). The survey of advertising effectiveness, con-
ducted by USA Today’s Ad Track poll, reported separate samples by respondent age group
to learn about how the Super Bowl advertisement appealed to different age groups. The
following sample data apply to the “The Miller Lite Girls” commercial.
CH011.qxd 8/16/10 6:57 PM Page 456
Copyright 2010 Cengage Learning. All Rights Reserved. May not be copied, scanned, or duplicated, in whole or in part. Due to electronic rights, some third party content may be suppressed from the eBook and/or eChapter(s).
Editorial review has deemed that any suppressed content does not materially affect the overall learning experience. Cengage Learning reserves the right to remove additional content at any time if subsequent rights restrictions require it.

company B, and 20% for company C. Recently company C developed a “new and im-
proved” product to replace its current entry in the market. Company C retained Scott Mar-
keting Research to determine whether the new product will alter market shares.
In this case, the population of interest is a multinomial population; each customer is clas-
sified as buying from company A, company B, or company C. Thus, we have a multinomial
population with three outcomes. Let us use the following notation for the proportions.
Scott Marketing Research will conduct a sample survey and compute the proportion
preferring each company’s product. Ahypothesis test will then be conducted to see whether
the new product caused a change in market shares. Assuming that company C’s new prod-
uct will not alter the market shares, the null and alternative hypotheses are stated as follows.
If the sample results lead to the rejection of H
0
, Scott Marketing Research will have evi-
dence that the introduction of the new product affects market shares.
Let us assume that the market research firm has used a consumer panel of 200 customers
for the study. Each individual was asked to specify a purchase preference among the three
alternatives: company A’s product, company B’s product, and company C’s new product.
The 200 responses are summarized here.
H
0
:
H
a
:
p
A
⫽ .30, p
B
⫽ .50, and p
C
⫽ .20
The population proportions are not
p
A
⫽ .30, p
B
⫽ .50, and p
C
⫽ .20
p
A
⫽
p
B
⫽
p
C
⫽
market share for company A
market share for company B
market share for company C
11.2 Hypothesis Test for Proportions of a Multinomial Population 457
Thus, we see that the expected frequency for each category is found by multiplying the
sample size of 200 by the hypothesized proportion for the category.
The goodness of fit test now focuses on the differences between the observed fre-
quencies and the expected frequencies. Large differences between observed and expected
Observed Frequency
Company A’s Company B’s Company C’s
Product Product New Product
48 98 54
The consumer panel of
200 customers in which
each individual is asked to
select one of three
alternatives is equivalent to
a multinomial experiment
consisting of 200 trials.
Expected Frequency
Company A’s Company B’s Company C’s
Product Product New Product
200(.30) ⫽ 60 200(.50) ⫽ 100 200(.20) ⫽ 40
We now can perform a goodness of fit test that will determine whether the sample
of 200 customer purchase preferences is consistent with the null hypothesis. The goodness
of fit test is based on a comparison of the sample of observed results with the expected
results under the assumption that the null hypothesis is true. Hence, the next step is to com-
pute expected purchase preferences for the 200 customers under the assumption that
p
A
⫽ .30, p
B
⫽ .50, and p
C
⫽ .20. Doing so provides the expected results.
The assumptions for the
multinomial experiment
parallel those for the
binomial experiment with
the exception that the
multinomial has three or
more outcomes per trial.
CH011.qxd 8/16/10 6:57 PM Page 457
Copyright 2010 Cengage Learning. All Rights Reserved. May not be copied, scanned, or duplicated, in whole or in part. Due to electronic rights, some third party content may be suppressed from the eBook and/or eChapter(s).
Editorial review has deemed that any suppressed content does not materially affect the overall learning experience. Cengage Learning reserves the right to remove additional content at any time if subsequent rights restrictions require it.
458 Chapter 11 Comparisons Involving Proportions and a Test of Independence
TEST STATISTIC FOR GOODNESS OF FIT
(11.8)
where
Note: The test statistic has a chi-square distribution with k ⫺ 1 degrees of freedom
provided that the expected frequencies are 5 or more for all categories.
f
i
⫽
e
i
⫽
k ⫽
observed frequency for category i
expected frequency for category i
the number of categories
χ
2
⫽
兺
k
i⫽1
( f
i
⫺ e
i
)
2
e
i
Let us continue with the Scott Market Research example and use the sample data to test
the hypothesis that the multinomial population retains the proportions p
A
⫽ .30, p
B
⫽ .50,
and p
C
⫽ .20. We will use an α ⫽ .05 level of significance. We proceed by using the
observed and expected frequencies to compute the value of the test statistic. With the ex-
pected frequencies all 5 or more, the computation of the chi-square test statistic is shown
in Table 11.1. Thus, we have χ
2
⫽ 7.34.
We will reject the null hypothesis if the differences between the observed and expected
frequencies are large. Large differences between the observed and expected frequencies
will result in a large value for the test statistic. Thus the test of goodness of fit will always
be an upper tail test. We can use the upper tail area for the test statistic and the p-value ap-
proach to determine whether the null hypothesis can be rejected. With k ⫺ 1 ⫽ 3 ⫺ 1 ⫽ 2
degrees of freedom, Table 11.2 shows the following areas in the upper tail and their corre-
sponding chi-square (χ
2
) values:
The test for goodness of fit
is always a one-tailed test
with the rejection occurring
in the upper tail of the
chi-square distribution.
Area in Upper Tail .10 .05 .025 .01
χ
2
Value (2 df) 4.605 5.991 7.378 9.210
χ
2
⫽ 7.34
frequencies cast doubt on the assumption that the hypothesized proportions or market
shares are correct. Whether the differences between the observed and expected frequencies
are “large” or “small” is a question answered with the aid of the following test statistic.
Squared Difference
Observed Expected Squared Divided by
Hypothesized Frequency Frequency Difference Difference Expected Frequency
Category Proportion ( f
i
)(e
i
)(f
i
ⴚ e
i
)(f
i
ⴚ e
i
)
2
( f
i
ⴚ e
i
)
2
/e
i
Company A .30 48 60 ⫺12 144 2.40
Company B .50 98 100 ⫺2 4 0.04
Company C .20 54 40 14 196 4.90
Total 200 χ
2
⫽ 7.34
TABLE 11.1
COMPUTATION OF THE CHI-SQUARE TEST STATISTIC FOR THE SCOTT MARKETING
RESEARCH MARKET SHARE STUDY
CH011.qxd 8/16/10 6:57 PM Page 458
Copyright 2010 Cengage Learning. All Rights Reserved. May not be copied, scanned, or duplicated, in whole or in part. Due to electronic rights, some third party content may be suppressed from the eBook and/or eChapter(s).
Editorial review has deemed that any suppressed content does not materially affect the overall learning experience. Cengage Learning reserves the right to remove additional content at any time if subsequent rights restrictions require it.
11.2 Hypothesis Test for Proportions of a Multinomial Population 459
Degrees
Area in Upper Tail
of Freedom .99 .975 .95 .90 .10 .05 .025 .01
1 .000 .001 .004 .016 2.706 3.841 5.024 6.635
2 .020 .051 .103 .211 4.605 5.991 7.378 9.210
3 .115 .216 .352 .584 6.251 7.815 9.348 11.345
4 .297 .484 .711 1.064 7.779 9.488 11.143 13.277
5 .554 .831 1.145 1.610 9.236 11.070 12.832 15.086
6 .872 1.237 1.635 2.204 10.645 12.592 14.449 16.812
7 1.239 1.690 2.167 2.833 12.017 14.067 16.013 18.475
8 1.647 2.180 2.733 3.490 13.362 15.507 17.535 20.090
9 2.088 2.700 3.325 4.168 14.684 16.919 19.023 21.666
10 2.558 3.247 3.940 4.865 15.987 18.307 20.483 23.209
11 3.053 3.816 4.575 5.578 17.275 19.675 21.920 24.725
12 3.571 4.404 5.226 6.304 18.549 21.026 23.337 26.217
13 4.107 5.009 5.892 7.041 19.812 22.362 24.736 27.688
14 4.660 5.629 6.571 7.790 21.064 23.685 26.119 29.141
15 5.229 6.262 7.261 8.547 22.307 24.996 27.488 30.578
16 5.812 6.908 7.962 9.312 23.542 26.296 28.845 32.000
17 6.408 7.564 8.672 10.085 24.769 27.587 30.191 33.409
18 7.015 8.231 9.390 10.865 25.989 28.869 31.526 34.805
19 7.633 8.907 10.117 11.651 27.204 30.144 32.852 36.191
20 8.260 9.591 10.851 12.443 28.412 31.410 34.170 37.566
21 8.897 10.283 11.591 13.240 29.615 32.671 35.479 38.932
22 9.542 10.982 12.338 14.041 30.813 33.924 36.781 40.289
23 10.196 11.689 13.091 14.848 32.007 35.172 38.076 41.638
24 10.856 12.401 13.848 15.659 33.196 36.415 39.364 42.980
25 11.524 13.120 14.611 16.473 34.382 37.652 40.646 44.314
26 12.198 13.844 15.379 17.292 35.563 38.885 41.923 45.642
27 12.878 14.573 16.151 18.114 36.741 40.113 43.195 46.963
28 13.565 15.308 16.928 18.939 37.916 41.337 44.461 48.278
29 14.256 16.047 17.708 19.768 39.087 42.557 45.722 49.588
30 14.953 16.791 18.493 20.599 40.256 43.773 46.979 50.892
40 22.164 24.433 26.509 29.051 51.805 55.758 59.342 63.691
60 37.485 40.482 43.188 46.459 74.397 79.082 83.298 88.379
80 53.540 57.153 60.391 64.278 96.578 101.879 106.629 112.329
100 70.065 74.222 77.929 82.358 118.498 124.342 129.561 135.807
*Note: A more extensive table is provided as Table 3 of Appendix B.
TABLE 11.2
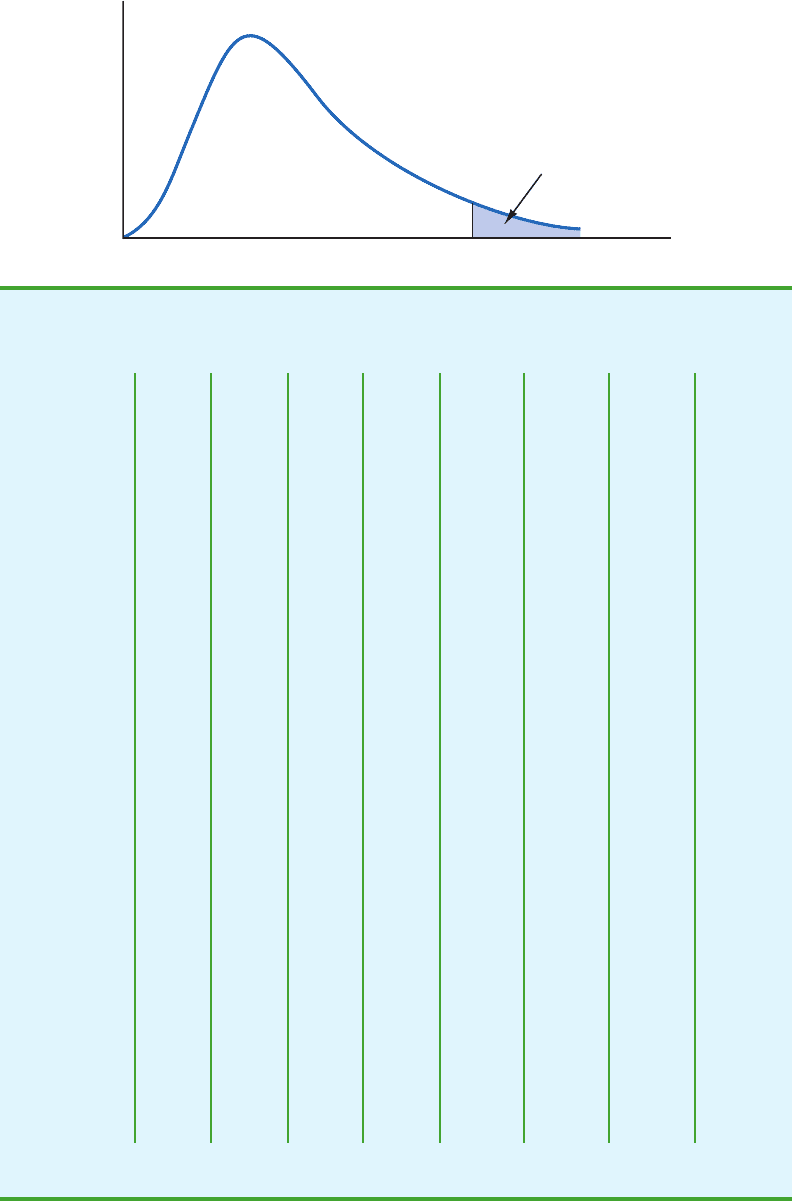
SELECTED VALUES FROM THE CHI-SQUARE DISTRIBUTION TABLE*
Area or
probability
χ
2
α
CH011.qxd 8/16/10 6:57 PM Page 459
Copyright 2010 Cengage Learning. All Rights Reserved. May not be copied, scanned, or duplicated, in whole or in part. Due to electronic rights, some third party content may be suppressed from the eBook and/or eChapter(s).
Editorial review has deemed that any suppressed content does not materially affect the overall learning experience. Cengage Learning reserves the right to remove additional content at any time if subsequent rights restrictions require it.

460 Chapter 11 Comparisons Involving Proportions and a Test of Independence
The test statistic χ
2
⫽ 7.34 is between 5.991 and 7.378. Thus, the corresponding upper
tail area or p-value must be between .05 and .025. With p-value ⱕ α ⫽ .05, we reject H
0
and conclude that the introduction of the new product by company C will alter the current
market share structure. Minitab or Excel procedures provided in Appendix F at the back of
the book can be used to show that χ
2
⫽ 7.34 provides a p-value ⫽ .0255.
Instead of using the p-value, we could use the critical value approach to draw the same
conclusion. With α ⫽ .05 and 2 degrees of freedom, the critical value for the test statistic
is The upper tail rejection rule becomes
With 7.34 ⬎ 5.991, we reject H
0
. The p-value approach and critical value approach provide
the same hypothesis testing conclusion.
Although no further conclusions can be made as a result of the test, we can compare the
observed and expected frequencies informally to obtain an idea of how the market share
structure may change. Considering company C, we find that the observed frequency of
54 is larger than the expected frequency of 40. Because the expected frequency was based
on current market shares, the larger observed frequency suggests that the new product will
have a positive effect on company C’s market share. Comparisons of the observed and ex-
pected frequencies for the other two companies indicate that company C’s gain in market
share will hurt company A more than company B.
Let us summarize the general steps that can be used to conduct a goodness of fit test for
a hypothesized multinomial population distribution.
Reject H
0
if χ
2
ⱖ 5.991
χ
2
.05
⫽ 5.991.
MULTINOMIAL DISTRIBUTION GOODNESS OF FIT TEST: A SUMMARY
1. State the null and alternative hypotheses.
H
0
: The population follows a multinomial distribution with specified
probabilities for each of the k categories
H
a
: The population does not follow a multinomial distribution with the
specified probabilities for each of the k categories
2. Select a random sample and record the observed frequencies f
i
for each
category.
3. Assume the null hypothesis is true and determine the expected frequency e
i
in
each category by multiplying the category probability by the sample size.
4. Compute the value of the test statistic.
5. Rejection rule:
where α is the level of significance for the test and there are k ⫺ 1 degrees of
freedom.
p-value approach:
Critical value approach:
Reject H
0
if p-value ⱕ α
Reject H
0
if χ
2
ⱖ χ
2
α
χ
2
⫽
兺
k
i⫽1
( f
i
⫺ e
i
)
2
e
i
CH011.qxd 8/16/10 6:57 PM Page 460
Copyright 2010 Cengage Learning. All Rights Reserved. May not be copied, scanned, or duplicated, in whole or in part. Due to electronic rights, some third party content may be suppressed from the eBook and/or eChapter(s).
Editorial review has deemed that any suppressed content does not materially affect the overall learning experience. Cengage Learning reserves the right to remove additional content at any time if subsequent rights restrictions require it.

11.2 Hypothesis Test for Proportions of a Multinomial Population 461
Exercises
Methods
11. Test the following hypotheses by using the χ
2
goodness of fit test.
A sample of size 200 yielded 60 in category A, 120 in category B, and 20 in category C.
Use α ⫽ .01 and test to see whether the proportions are as stated in H
0
.
a. Use the p-value approach.
b. Repeat the test using the critical value approach.
12. Suppose we have a multinomial population with four categories: A, B, C, and D. The null hy-
pothesis is that the proportion of items is the same in every category. The null hypothesis is
A sample of size 300 yielded the following results.
Use α ⫽ .05 to determine whether H
0
should be rejected. What is the p-value?
Applications
13. During the first 13 weeks of the network television season, the Saturday evening 8:00 p.m.
to 9:00 p.m. audience proportions were recorded as
ABC 29%, CBS 28%, NBC 25%, and
independents 18%. A sample of 300 homes two weeks after a Saturday night schedule re-
vision yielded the following viewing audience data:
ABC 95 homes, CBS 70 homes, NBC
89 homes, and independents 46 homes. Test with α ⫽ .05 to determine whether the view-
ing audience proportions changed.
14.
M&M/MARS, makers of M&M’s
®
Chocolate Candies, conducted a national poll in which
more than 10 million people indicated their preference for a new color. The tally of this
poll resulted in the replacement of tan-colored
M&Ms with a new blue color. In the
brochure “Colors,” made available by
M&M/MARS Consumer Affairs, the distribution of
colors for the plain candies is as follows:
A: 85 B: 95 C: 50 D: 70
H
0
: p
A
⫽ p
B
⫽ p
C
⫽ p
D
⫽ .25
H
0
:
H
a
:
p
A
⫽ .40, p
B
⫽ .40, and p
C
⫽ .20
The population proportions are not
p
A
⫽ .40, p
B
⫽ .40, and p
C
⫽ .20
In a follow-up study, samples of 1-pound bags were used to determine whether the reported
percentages were indeed valid. The following results were obtained for one sample of 506
plain candies.
Brown Yellow Red Orange Green Blue
30% 20% 20% 10% 10% 10%
Brown Yellow Red Orange Green Blue
177 135 79 41 36 38
test
SELF
test
SELF
Use α ⫽ .05 to determine whether these data support the percentages reported by the
company.
CH011.qxd 8/16/10 6:57 PM Page 461
Copyright 2010 Cengage Learning. All Rights Reserved. May not be copied, scanned, or duplicated, in whole or in part. Due to electronic rights, some third party content may be suppressed from the eBook and/or eChapter(s).
Editorial review has deemed that any suppressed content does not materially affect the overall learning experience. Cengage Learning reserves the right to remove additional content at any time if subsequent rights restrictions require it.

462 Chapter 11 Comparisons Involving Proportions and a Test of Independence
15. Where do women most often buy casual clothing? Data from the U.S. Shopper Database
provided the following percentages for women shopping at each of the various outlets (The
Wall Street Journal, January 28, 2004).
The other category included outlets such as Target, Kmart, and Sears as well as numerous
smaller specialty outlets. No individual outlet in this group accounted for more than 5% of
the women shoppers. A recent survey using a sample of 140 women shoppers in Atlanta,
Georgia, found 42 Walmart, 20 traditional department store, 8 JC Penney, 10 Kohl’s,
21 mail order, and 39 other outlet shoppers. Does this sample suggest that women shop-
pers in Atlanta differ from the shopping preferences expressed in the U.S. Shopper Data-
base? What is the p-value? Use
α ⫽ .05. What is your conclusion?
16. The American Bankers Association collects data on the use of credit cards, debit cards, per-
sonal checks, and cash when consumers pay for in-store purchases (The Wall Street Jour-
nal, December 16, 2003). In 1999, the following usages were reported.
Outlet Percentage Outlet Percentage
Walmart 24 Kohl’s 8
Traditional department stores 11 Mail order 12
JC Penney 8 Other 37
In-Store Purchase Percentage
Credit card 22
Debit card 21
Personal check 18
Cash 39
Asample taken in 2003 found that for 220 in-stores purchases, 46 used a credit card, 67 used
a debit card, 33 used a personal check, and 74 used cash.
a. At α ⫽ .01, can we conclude that a change occurred in how customers paid for in-store
purchases over the four-year period from 1999 to 2003? What is the p-value?
b. Compute the percentage of use for each method of payment using the 2003 sample data.
What appears to have been the major change or changes over the four-year period?
c. In 2003, what percentage of payments was made using plastic (credit card or debit card)?
17. The Wall Street Journal’s Shareholder Scoreboard tracks the performance of 1000 major
U.S. companies (The Wall Street Journal, March 10, 2003). The performance of each
company is rated based on the annual total return, including stock price changes and the
reinvestment of dividends. Ratings are assigned by dividing all 1000 companies into five
groups from A (top 20%), B (next 20%), to E (bottom 20%). Shown here are the one-year
ratings for a sample of 60 of the largest companies. Do the largest companies differ in per-
formance from the performance of the 1000 companies in the Shareholder Scoreboard?
Use α ⫽ .05.
ABC D E
5 8 15 20 12
18. How well do airline companies serve their customers? A study showed the following
customer ratings: 3% excellent, 28% good, 45% fair, and 24% poor. In a similar study of
service by telephone companies, assume that a sample of 400 adults found the following
CH011.qxd 8/16/10 6:57 PM Page 462
Copyright 2010 Cengage Learning. All Rights Reserved. May not be copied, scanned, or duplicated, in whole or in part. Due to electronic rights, some third party content may be suppressed from the eBook and/or eChapter(s).
Editorial review has deemed that any suppressed content does not materially affect the overall learning experience. Cengage Learning reserves the right to remove additional content at any time if subsequent rights restrictions require it.

11.3 Test of Independence 463
customer ratings: 24 excellent, 124 good, 172 fair, and 80 poor. Is the distribution of the
customer ratings for telephone companies different from the distribution of customer rat-
ings for airline companies? Test with α ⫽ .01. What is your conclusion?
11.3 Test of Independence
Another important application of the chi-square distribution involves using sample data to
test for the independence of two variables. Let us illustrate the test of independence by con-
sidering the study conducted by the Alber’s Brewery of Tucson, Arizona. Alber’s manu-
factures and distributes three types of beer: light, regular, and dark. In an analysis of the
market segments for the three beers, the firm’s market research group raised the question
of whether preferences for the three beers differ among male and female beer drinkers. If
beer preference is independent of the gender of the beer drinker, one advertising campaign
will be initiated for all of Alber’s beers. However, if beer preference depends on the gender
of the beer drinker, the firm will tailor its promotions to different target markets.
A test of independence addresses the question of whether the beer preference (light,
regular, or dark) is independent of the gender of the beer drinker (male, female). The hy-
potheses for this test of independence are
Table 11.3 can be used to describe the situation being studied.After identification of the pop-
ulation as all male and female beer drinkers, a sample can be selected and each individual
asked to state his or her preference for the threeAlber’s beers. Every individual in the sam-
ple will be classified in one of the six cells in the table. For example, an individual may be
amale preferringregularbeer [cell(1,2)], a femalepreferring lightbeer[cell (2,1)],a female
preferring dark beer [cell (2,3)], and so on. Because we have listed all possible combina-
tions of beer preference and gender or, in other words, listed all possible contingencies,
Table 11.3 is called a contingency table. The test of independence uses the contingency
table format and for that reason is sometimes referred to as a contingency table test.
Suppose a simple random sample of 150 beer drinkers is selected. After tasting each
beer, the individuals in the sample are asked to state their preference or first choice. The
crosstabulation in Table 11.4 summarizes the responses for the study. As we see, the data
for the test of independence are collected in terms of counts or frequencies for each cell or
category. Of the 150 individuals in the sample, 20 were men who favored light beer, 40 were
men who favored regular beer, 20 were men who favored dark beer, and so on.
The data in Table 11.4 are the observed frequencies for the six classes or categories. If
we can determine the expected frequencies under the assumption of independence between
H
0
:
H
a
:
Beer preference is independent of the gender of the beer drinker
Beer preference is not independent of the gender of the beer drinker
Beer Preference
Light Regular Dark
Male cell(1,1) cell(1,2) cell(1,3)
Gender
Female cell(2,1) cell(2,2) cell(2,3)
TABLE 11.3
CONTINGENCY TABLE FOR BEER PREFERENCE AND GENDER
OF BEER DRINKER
To test whether two
variables are independent,
one sample is selected and
crosstabulation is used to
summarize the data for the
two variables
simultaneously.
CH011.qxd 8/16/10 6:57 PM Page 463
Copyright 2010 Cengage Learning. All Rights Reserved. May not be copied, scanned, or duplicated, in whole or in part. Due to electronic rights, some third party content may be suppressed from the eBook and/or eChapter(s).
Editorial review has deemed that any suppressed content does not materially affect the overall learning experience. Cengage Learning reserves the right to remove additional content at any time if subsequent rights restrictions require it.

464 Chapter 11 Comparisons Involving Proportions and a Test of Independence
beer preference and gender of the beer drinker, we can use the chi-square distribution to de-
termine whether there is a significant difference between observed and expected frequencies.
Expected frequencies for the cells of the contingency table are based on the following
rationale. First we assume that the null hypothesis of independence between beer prefer-
ence and gender of the beer drinker is true. Then we note that in the entire sample of
150 beer drinkers, a total of 50 prefer light beer, 70 prefer regular beer, and 30 prefer dark
beer. In terms of fractions we conclude that
⁵⁰
⁄
₁₅₀
⫽
¹
⁄
₃
of the beer drinkers prefer light beer,
⁷⁰
⁄
₁₅₀
⫽
⁷
⁄
₁₅
prefer regular beer, and
³⁰
⁄
₁₅₀
⫽
¹
⁄
₅
prefer dark beer. If the independence assump-
tion is valid, we argue that these fractions must be applicable to both male and female beer
drinkers. Thus, under the assumption of independence, we would expect the sample of
80 male beer drinkers to show that (
¹
⁄
₃
)80 ⫽ 26.67 prefer light beer, (
⁷
⁄
₁₅
)80 ⫽ 37.33 prefer
regular beer, and (
¹
⁄
₅
)80 ⫽ 16 prefer dark beer. Application of the same fractions to the
70 female beer drinkers provides the expected frequencies shown in Table 11.5.
Lete
ij
denotetheexpectedfrequency for thecontingencytablecategoryin row iandcol-
umn j. With this notation, let us reconsider the expected frequency calculation for males
(row i ⫽ 1) who prefer regular beer (column j ⫽ 2); that is, expected frequency e
12
. Follow-
ing the preceding argument for the computation of expected frequencies, we can show that
This expression can be written slightly differently as
Note that 80 in the expression is the total number of males (row 1 total), 70 is the total num-
ber of individuals preferring regular beer (column 2 total), and 150 is the total sample size.
Hence, we see that
e
12
⫽
(Row 1 Total)(Column 2 Total)
Sample Size
e
12
⫽ (
⁷
₁₅
)80 ⫽ (
⁷⁰
₁₅₀
)80 ⫽
(80)(70)
150
⫽ 37.33
e
12
⫽ (
⁷
₁₅
)80 ⫽ 37.33
Beer Preference
Light Regular Dark Total
Gender
Male 20 40 20 80
Female 30 30 10 70
Total 50 70 30 150
TABLE 11.4
SAMPLE RESULTS FOR BEER PREFERENCES OF MALE AND FEMALE
BEER DRINKERS (OBSERVED FREQUENCIES)
Beer Preference
Light Regular Dark Total
Gender
Male
26.67 37.33 16.00 80
Female 23.33 32.67 14.00 70
Total 50.00 70.00 30.00 150
TABLE 11.5
EXPECTED FREQUENCIES IF BEER PREFERENCE IS INDEPENDENT
OF THE GENDER OF THE BEER DRINKER
CH011.qxd 8/16/10 6:57 PM Page 464
Copyright 2010 Cengage Learning. All Rights Reserved. May not be copied, scanned, or duplicated, in whole or in part. Due to electronic rights, some third party content may be suppressed from the eBook and/or eChapter(s).
Editorial review has deemed that any suppressed content does not materially affect the overall learning experience. Cengage Learning reserves the right to remove additional content at any time if subsequent rights restrictions require it.