Anderson D.R., Sweeney D.J., Williams T.A. Essentials of Statistics for Business and Economics
Подождите немного. Документ загружается.


12.1 Simple Linear Regression Model 485
Managerial decisions often are based on the relationship between two or more variables.
For example, after considering the relationship between advertising expenditures and sales,
a marketing manager might attempt to predict sales for a given level of advertising expen-
ditures. In another case, a public utility might use the relationship between the daily high
temperature and the demand for electricity to predict electricity usage on the basis of next
month’s anticipated daily high temperatures. Sometimes a manager will rely on intuition to
judge how two variables are related. However, if data can be obtained, a statistical proce-
dure called regression analysis can be used to develop an equation showing how the vari-
ables are related.
In regression terminology, the variable being predicted is called the dependent vari-
able. The variable or variables being used to predict the value of the dependent variable are
called the independent variables. For example, in analyzing the effect of advertising ex-
penditures on sales, a marketing manager’s desire to predict sales would suggest making
sales the dependent variable. Advertising expenditure would be the independent variable
used to help predict sales. In statistical notation, y denotes the dependent variable and x
denotes the independent variable.
In this chapter we consider the simplest type of regression analysis involving one in-
dependent variable and one dependent variable in which the relationship between the vari-
ables is approximated by a straight line. It is called simple linear regression. Regression
analysis involving two or more independent variables is called multiple regression
analysis; multiple regression is covered in Chapter 13.
12.1 Simple Linear Regression Model
Armand’s Pizza Parlors is a chain of Italian-food restaurants located in a five-state area.
Armand’s most successful locations are near college campuses. The managers believe that
quarterly sales for these restaurants (denoted by y) are related positively to the size of the
student population (denoted by x); that is, restaurants near campuses with a large student
population tend to generate more sales than those located near campuses with a small stu-
dent population. Using regression analysis, we can develop an equation showing how the
dependent variable y is related to the independent variable x.
Regression Model and Regression Equation
In the Armand’s Pizza Parlors example, the population consists of all the Armand’s restau-
rants. For every restaurant in the population, there is a value of x (student population) and
a corresponding value of y (quarterly sales). The equation that describes how y is related to
x and an error term is called the regression model. The regression model used in simple
linear regression follows.
β
0
and β
1
are referred to as the parameters of the model, and (the Greek letter epsilon) is
a random variable referred to as the error term. The error term accounts for the variability
in y that cannot be explained by the linear relationship between x and y.
SIMPLE LINEAR REGRESSION MODEL
y 
0

1
x (12.1)
The statistical methods
used in studying the
relationship between two
variables were first
employed by Sir Francis
Galton (1822–1911).
Galton was interested in
studying the relationship
between a father’s height
and the son’s height.
Galton’s disciple, Karl
Pearson (1857–1936),
analyzed the relationship
between the father’s height
and the son’s height for
1078 pairs of subjects.
CH012.qxd 8/16/10 6:58 PM Page 485
Copyright 2010 Cengage Learning. All Rights Reserved. May not be copied, scanned, or duplicated, in whole or in part. Due to electronic rights, some third party content may be suppressed from the eBook and/or eChapter(s).
Editorial review has deemed that any suppressed content does not materially affect the overall learning experience. Cengage Learning reserves the right to remove additional content at any time if subsequent rights restrictions require it.
486 Chapter 12 Simple Linear Regression
SIMPLE LINEAR REGRESSION EQUATION
(12.2)E( y) β
0
β
1
x
The population of all Armand’s restaurants can also be viewed as a collection of sub-
populations, one
for each distinct value of x. For example, one subpopulation consists
of all Armand’s restaurants located near college campuses with 8000 students; another
subpopulation consists of all Armand’s restaurants located near college campuses with
9000 students; and so on. Each subpopulation has a corresponding distribution of y values.
Thus, a distribution of y values is associated with restaurants located near campuses with
8000 students; a distribution of y values is associated with restaurants located near cam-
puses with 9000 students; and so on. Each distribution of y values has its own mean or ex-
pected value. The equation that describes how the expected value of y, denoted E(y), is
related to x is called the regression equation. The regression equation for simple linear
regression follows.
The graph of the simple linear regression equation is a straight line; β
0
is the y-intercept of
the regression line, β
1
is the slope, and E(y) is the mean or expected value of y for a given
value of x.
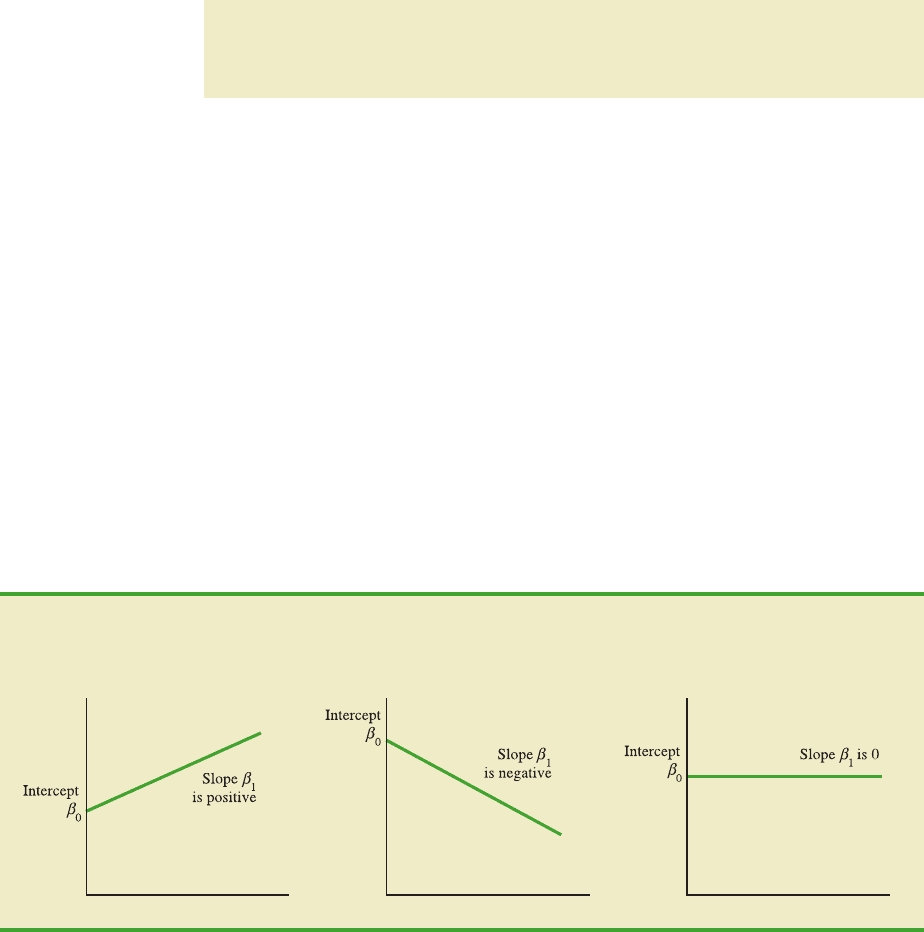
Examples of possible regression lines are shown in Figure 12.1. The regression line in
Panel Ashows that the mean value of y is related positively to x, with larger values of E(y)
associated with larger values of x. The regression line in Panel B shows the mean value of
y is related negatively to x, with smaller values of E(y) associated with larger values of x.
The regression line in Panel C shows the case in which the mean value of y is not related to
x; that is, the mean value of y is the same for every value of x.
Estimated Regression Equation
If the values of the population parameters β
0
and β
1
were known, we could use equation (12.2)
to compute the mean value of y for a given value of x. In practice, the parameter values are
not known and must be estimated using sample data. Sample statistics (denoted b
0
and b
1
)
are computed as estimates of the population parameters β
0
and β
1
. Substituting the values
of the sample statistics b
0
and b
1
for β
0
and β
1
in the regression equation, we obtain the
E(y) E(y) E(y)
xxx
Regression line
Panel A:
Positive Linear Relationship
Panel B:
Negative Linear Relationship
Panel C:
No Relationship
Regression line
Regression line
FIGURE 12.1 POSSIBLE REGRESSION LINES IN SIMPLE LINEAR REGRESSION
CH012.qxd 8/16/10 6:58 PM Page 486
Copyright 2010 Cengage Learning. All Rights Reserved. May not be copied, scanned, or duplicated, in whole or in part. Due to electronic rights, some third party content may be suppressed from the eBook and/or eChapter(s).
Editorial review has deemed that any suppressed content does not materially affect the overall learning experience. Cengage Learning reserves the right to remove additional content at any time if subsequent rights restrictions require it.
12.1 Simple Linear Regression Model 487
ESTIMATED SIMPLE LINEAR REGRESSION EQUATION
(12.3)y
ˆ
b
0
b
1
x
estimated regression equation. The estimated regression equation for simple linear regres-
sion follows.
The graph of the estimated simple linear regression equation is called the
estimated re-
gression line; b
0
is the y-intercept and b
1
is the slope. In the next section, we show how the
least squares method can be used to compute the values of b
0
and b
1
in the estimated re-
gression equation.
In general, is the point estimator of E(y), the mean value of y for a given value of x.
Thus, to estimate the mean or expected value of quarterly sales for all restaurants located
near campuses with 10,000 students, Armand’s would substitute the value of 10,000 for x
in equation (12.3). In some cases, however, Armand’s may be more interested in predicting
sales for one particular restaurant. For example, suppose Armand’s would like to predict
quarterly sales for the restaurant located near Talbot College, a school with 10,000 students.
As it turns out, the best predictor of y for a given value of x is also provided by . Thus, to
predict quarterly sales for the restaurant located near Talbot College, Armand’s would also
substitute the value of 10,000 for x in equation (12.3).
Because the value of provides both a point estimate of E(y) for a given value of x and
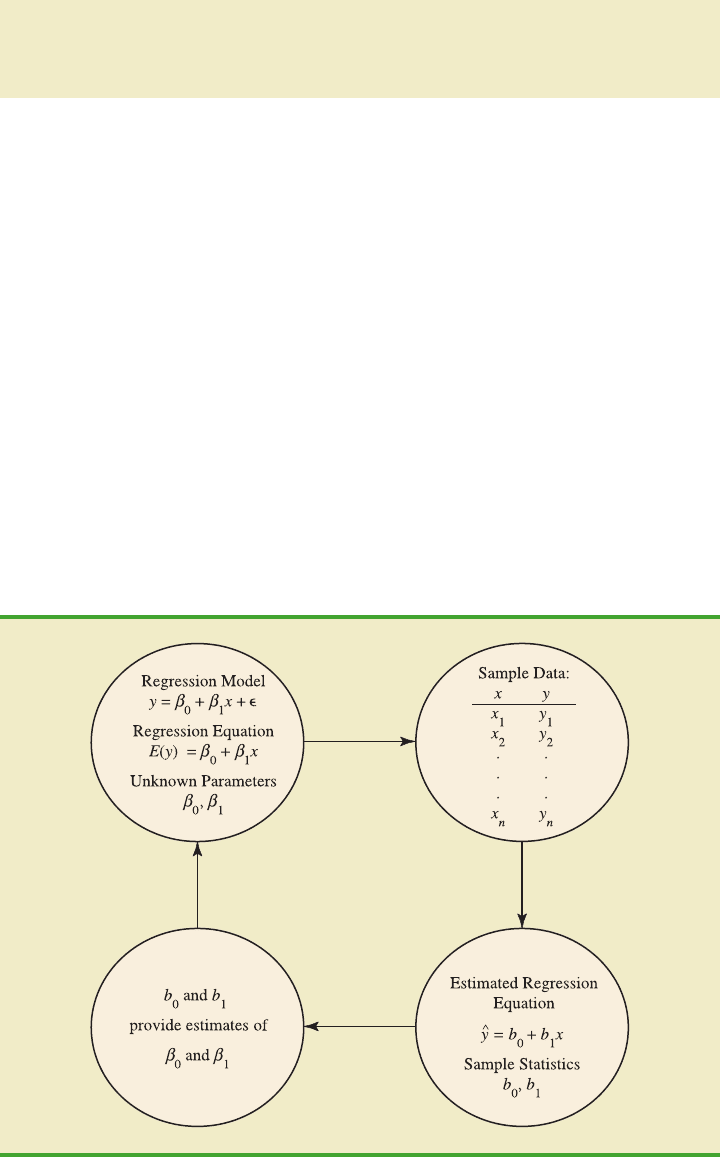
a prediction of the value of y for a given value of x, we will refer to simply as the esti-
mated value of y. Figure 12.2 provides a summary of the estimation process for simple lin-
ear regression.
y
ˆ
y
ˆ
y
ˆ
y
ˆ
FIGURE 12.2 THE ESTIMATION PROCESS IN SIMPLE LINEAR REGRESSION
The estimation of β
0
and β
1
is a statistical process much
like the estimation of μ
discussed in Chapter 7. β
0
and β
1
are the unknown
parameters of interest, and
b
0
and b
1
are the sample
statistics used to estimate
the parameters.
CH012.qxd 8/16/10 6:58 PM Page 487
Copyright 2010 Cengage Learning. All Rights Reserved. May not be copied, scanned, or duplicated, in whole or in part. Due to electronic rights, some third party content may be suppressed from the eBook and/or eChapter(s).
Editorial review has deemed that any suppressed content does not materially affect the overall learning experience. Cengage Learning reserves the right to remove additional content at any time if subsequent rights restrictions require it.
488 Chapter 12 Simple Linear Regression
NOTES AND COMMENTS
1. Regression analysis cannot be interpreted as a pro-
cedure for establishing a cause-and-effect relation-
ship between variables. It can only indicate how
or to what extent variables are associated with each
other. Any conclusions about cause and effect
must be based upon the judgment of those indi-
viduals most knowledgeable about the application.
2. The regression equation in simple linear regres-
sion is E(y) β
0
β
1
x. More advanced texts
in regression analysis often write the regression
equation as E(yⱍx) β
0
β
1
xto emphasize that
the regression equation provides the mean value
of y for a given value of x.
12.2 Least Squares Method
The least squares method is a procedure for using sample data to find the estimated re-
gression equation. To illustrate the least squares method, suppose data were collected from
a sample of 10 Armand’s Pizza Parlor restaurants located near college campuses. For the
ith observation or restaurant in the sample, x
i
is the size of the student population (in thou-
sands) and y
i
is the quarterly sales (in thousands of dollars). The values of x
i
and y
i
for the
10 restaurants in the sample are summarized in Table 12.1. We see that restaurant 1, with
x
1
2 and y
1
58, is near a campus with 2000 students and has quarterly sales of $58,000.
Restaurant 2, with x
2
6 and y
2
105, is near a campus with 6000 students and has quar-
terly sales of $105,000. The largest sales value is for restaurant 10, which is near a campus
with 26,000 students and has quarterly sales of $202,000.
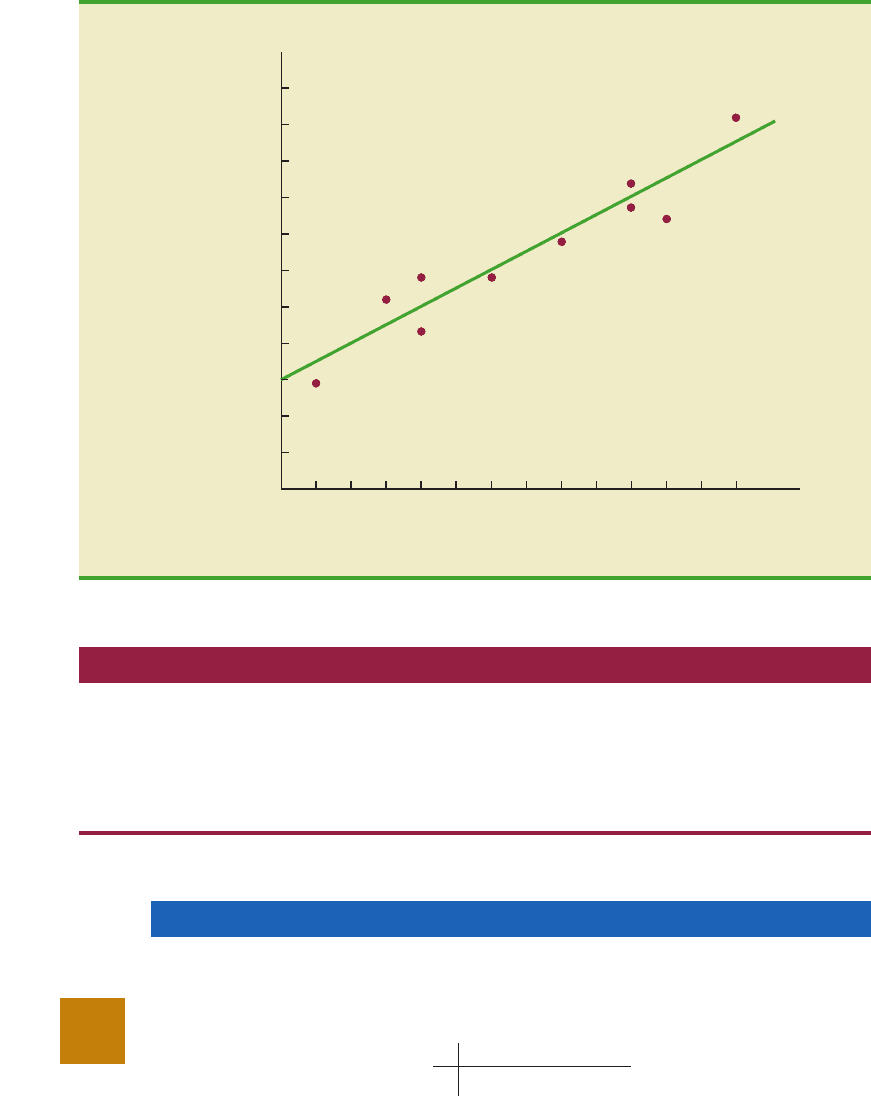
Figure 12.3 is a scatter diagram of the data in Table 12.1. Student population is shown
on the horizontal axis and quarterly sales is shown on the vertical axis. Scatter diagrams
for regression analysis are constructed with the independent variable x on the horizontal
axis and the dependent variable y on the vertical axis. The scatter diagram enables us to ob-
serve the data graphically and to draw preliminary conclusions about the possible relation-
ship between the variables.
What preliminary conclusions can be drawn from Figure 12.3? Quarterly sales appear
to be higher at campuses with larger student populations. In addition, for these data the re-
lationship between the size of the student population and quarterly sales appears to be ap-
proximated by a straight line; indeed, a positive linear relationship is indicated between x
In simple linear regression,
each observation consists
of two values: one for the
independent variable and
one for the dependent
variable.
Student Quarterly
Restaurant Population (1000s) Sales ($1000s)
ix
i
y
i
12 58
2 6 105
38 88
48118
512 117
6 16 137
7 20 157
8 20 169
9 22 149
10 26 202
TABLE 12.1
STUDENT POPULATION AND QUARTERLY SALES DATA
FOR 10 ARMAND’S PIZZA PARLORS
file
W
EB
Armand’s
CH012.qxd 8/16/10 6:58 PM Page 488
Copyright 2010 Cengage Learning. All Rights Reserved. May not be copied, scanned, or duplicated, in whole or in part. Due to electronic rights, some third party content may be suppressed from the eBook and/or eChapter(s).
Editorial review has deemed that any suppressed content does not materially affect the overall learning experience. Cengage Learning reserves the right to remove additional content at any time if subsequent rights restrictions require it.
12.2 Least Squares Method 489
20
40
60
80
100
120
140
160
180
200
220
Quarterly Sales ($1000s)
6024 1481012 2216 18 20 24 26
Student Population (1000s)
x
y
FIGURE 12.3 SCATTER DIAGRAM OF STUDENT POPULATION AND QUARTERLY
SALES FOR ARMAND’S PIZZA PARLORS
and y. We therefore choose the simple linear regression model to represent the relationship
between quarterly sales and student population. Given that choice, our next task is to use
the sample data in Table 12.1 to determine the values of b
0
and b
1
in the estimated simple
linear regression equation. For the ith restaurant, the estimated regression equation provides
(12.4)
where
With y
i
denoting the observed (actual) sales for restaurant i and in equation (12.4) repre-
senting the estimated value of sales for restaurant i, every restaurant in the sample will have
an observed value of sales y
i
and an estimated value of sales For the estimated regres-
sion line to provide a good fit to the data, we want the differences between the observed
sales values and the estimated sales values to be small.
The least squares method uses the sample data to provide the values of b
0
and b
1
that
minimize the sum of the squares of the deviations between the observed values of the de-
pendent variable y
i
and the estimated values of the dependent variable . The criterion for
the least squares method is given by expression (12.5).
y
ˆ
i
y
ˆ
i
.
y
ˆ
i
y
ˆ
i
b
0
b
1
x
i
estimated value of quarterly sales ($1000s) for the ith restaurant
the y intercept of the estimated regression line
the slope of the estimated regression line
size of the student population (1000s) for the ith restaurant
y
ˆ
i
b
0
b
1
x
i
-
CH012.qxd 8/16/10 6:58 PM Page 489
Copyright 2010 Cengage Learning. All Rights Reserved. May not be copied, scanned, or duplicated, in whole or in part. Due to electronic rights, some third party content may be suppressed from the eBook and/or eChapter(s).
Editorial review has deemed that any suppressed content does not materially affect the overall learning experience. Cengage Learning reserves the right to remove additional content at any time if subsequent rights restrictions require it.

490 Chapter 12 Simple Linear Regression
Differential calculus can be used to show (see Appendix 12.1) that the values of b
0
and b
1
that minimize expression (12.5) can be found by using equations (12.6) and (12.7).
1
An alternate formula for b
1
is
This form of equation (12.6) is often recommended when using a calculator to compute b
1
.
b
1
兺x
i
y
i
(兺x
i
兺y
i
)兾n
兺x
2
i
(兺x
i
)
2
兾n
Some of the calculations necessary to develop the least squares estimated regression
equation for Armand’s Pizza Parlors are shown in Table 12.2. With the sample of 10 restau-
rants, we have n 10 observations. Because equations (12.6) and (12.7) require and ,
we begin the calculations by computing and .
Using equations (12.6) and (12.7) and the information in Table 12.2, we can compute the
slope and intercept of the estimated regression equation for Armand’s Pizza Parlors. The
calculation of the slope (b
1
) proceeds as follows.
x¯
兺
x
i
n
140
10
14
y¯
兺
y
i
n
1300
10
130
y¯x¯
y¯x¯
LEAST SQUARES CRITERION
(12.5)
where
y
i
y
ˆ
i
observed value of the dependent variable for the ith observation
estimated value of the dependent variable for the ith observation
min 兺( y
i
y
ˆ
i
)
2
Carl Friedrich Gauss
(1777–1855) proposed the
least squares method.
SLOPE AND y-INTERCEPT FOR THE ESTIMATED REGRESSION EQUATION
1
(12.6)
(12.7)
where
x
i
y
i
x¯
y¯
n
value of the independent variable for the ith observation
value of the dependent variable for the ith observation
mean value for the independent variable
mean value for the dependent variable
total number of observations
b
0
y¯ b
1
x¯
b
1
兺
(x
i
x¯)( y
i
y¯)
兺
(x
i
x¯)
2
In computing b
1
with a
calculator, carry as many
significant digits as
possible in the intermediate
calculations. We
recommend carrying at
least four significant digits.
CH012.qxd 8/16/10 6:58 PM Page 490
Copyright 2010 Cengage Learning. All Rights Reserved. May not be copied, scanned, or duplicated, in whole or in part. Due to electronic rights, some third party content may be suppressed from the eBook and/or eChapter(s).
Editorial review has deemed that any suppressed content does not materially affect the overall learning experience. Cengage Learning reserves the right to remove additional content at any time if subsequent rights restrictions require it.
12.2 Least Squares Method 491
Restaurant ix
i
y
i
x
i
ⴚ y
i
ⴚ (x
i
ⴚ )(y
i
ⴚ )(x
i
ⴚ )
2
125812 72 864 144
2 6 105 8 25 200 64
38886 42 252 36
481186 12 72 36
5121172 13 26 4
6 16 137 2 7 14 4
7 20 157 6 27 162 36
8 20 169 6 39 234 36
9 22 149 8 19 152 64
10 26 202 12 72 864 144
Totals 140 1300 2840 568
兺x
i
兺y
i
兺(x
i
)(y
i
) 兺(x
i
)
2
x¯y¯x¯
x¯y¯x¯y¯x¯
TABLE 12.2 CALCULATIONS FOR THE LEAST SQUARES ESTIMATED REGRESSION
EQUATION FOR ARMAND’S PIZZA PARLORS
The calculation of the y-intercept (b
0
) follows.
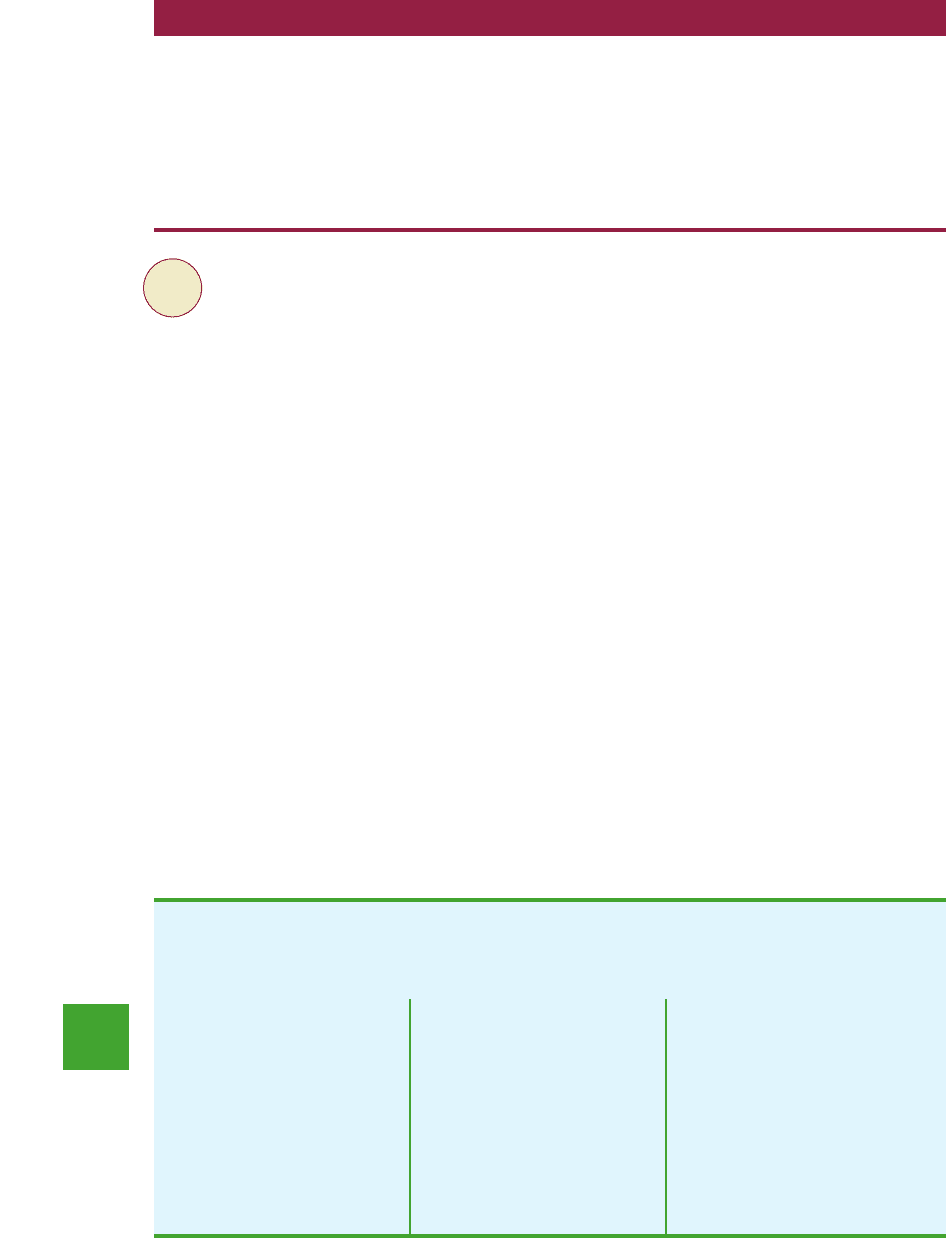
Thus, the estimated regression equation is
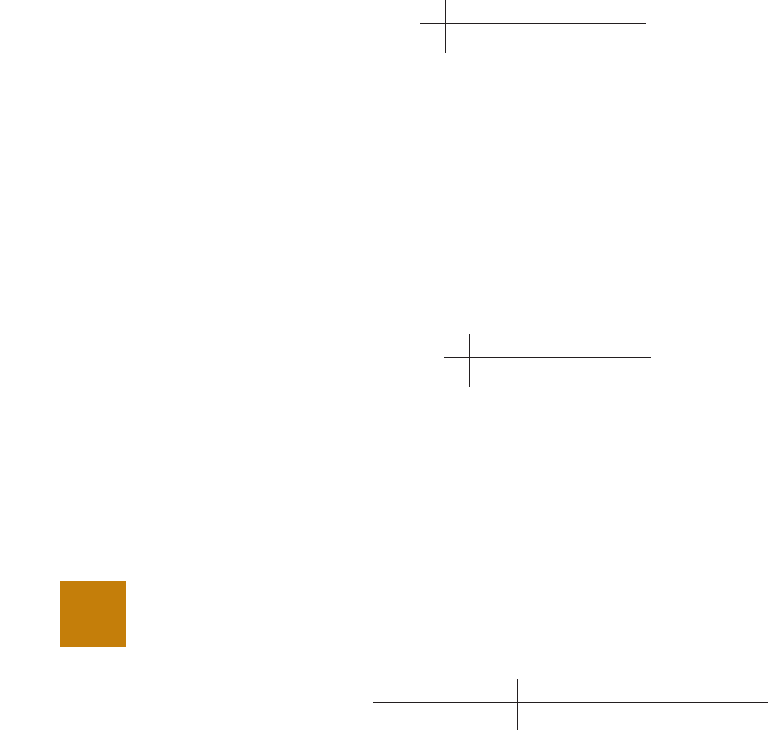
Figure 12.4 shows the graph of this equation on the scatter diagram.
The slope of the estimated regression equation (b
1
5) is positive, implying that as stu-
dent population increases, sales increase. In fact, we can conclude (based on sales measured
in $1000s and student population in 1000s) that an increase in the student population of
1000 is associated with an increase of $5000 in expected sales; that is, quarterly sales are
expected to increase by $5 per student.
If we believe the least squares estimated regression equation adequately describes the
relationship between xand y, it would seem reasonable to use the estimated regression equa-
tion to predict the value of y for a given value of x. For example, if we wanted to predict
quarterly sales for a restaurant to be located near a campus with 16,000 students, we would
compute
Hence, we would predict quarterly sales of $140,000 for this restaurant. In the following
sections we will discuss methods for assessing the appropriateness of using the estimated
regression equation for estimation and prediction.
y
ˆ
60 5(16) 140
y
ˆ
60 5x
b
0
y¯ b
1
x¯
130 5(14)
60
5
2840
568
b
1
兺(x
i
x¯)( y
i
y¯)
兺(x
i
x¯)
2
Using the estimated
regression equation to
make predictions outside
the range of the values of
the independent variable
should be done with
caution because outside
that range we cannot be
sure that the same
relationship is valid.
CH012.qxd 8/16/10 6:58 PM Page 491
Copyright 2010 Cengage Learning. All Rights Reserved. May not be copied, scanned, or duplicated, in whole or in part. Due to electronic rights, some third party content may be suppressed from the eBook and/or eChapter(s).
Editorial review has deemed that any suppressed content does not materially affect the overall learning experience. Cengage Learning reserves the right to remove additional content at any time if subsequent rights restrictions require it.
492 Chapter 12 Simple Linear Regression
20
40
60
80
100
120
140
160
180
200
220
Quarterly Sales ($1000s)
6024 1481012 2216 18 20 24 26
Student Population (1000s)
x
y
y = 60 + 5x
y-intercept
b
0
= 60
Slope b
1
= 5
^
FIGURE 12.4 GRAPH OF THE ESTIMATED REGRESSION EQUATION FOR ARMAND’S
PIZZA PARLORS: y
ˆ
60 5x
NOTES AND COMMENTS
The least squares method provides an estimated re-
gression equation that minimizes the sum of squared
deviations between the observed values of the de-
pendent variable y
i
and the estimated values of the
dependent variable This least squares criterion isy
ˆ
i
.
used to choose the equation that provides the best fit.
If some other criterion were used, such as minimiz-
ing the sum of the absolute deviations between y
i
and
a different equation would be obtained. In prac-
tice, the least squares method is the most widely used.
y
ˆ
i
,
Exercises
Methods
1. Given are five observations for two variables, x and y.
x
i
12345
y
i
3751114
a. Develop a scatter diagram for these data.
b. What does the scatter diagram developed in part (a) indicate about the relationship
between the two variables?
test
SELF
CH012.qxd 8/16/10 6:58 PM Page 492
Copyright 2010 Cengage Learning. All Rights Reserved. May not be copied, scanned, or duplicated, in whole or in part. Due to electronic rights, some third party content may be suppressed from the eBook and/or eChapter(s).
Editorial review has deemed that any suppressed content does not materially affect the overall learning experience. Cengage Learning reserves the right to remove additional content at any time if subsequent rights restrictions require it.
12.2 Least Squares Method 493
c. Try to approximate the relationship between x and y by drawing a straight line
through the data.
d. Develop the estimated regression equation by computing the values of b
0
and b
1
using
equations (12.6) and (12.7).
e. Use the estimated regression equation to predict the value of y when x 4.
2. Given are five observations for two variables, x and y.
x
i
3 12 6 20 14
y
i
55 40 55 10 15
a. Develop a scatter diagram for these data.
b. What does the scatter diagram developed in part (a) indicate about the relationship
between the two variables?
c. Try to approximate the relationship between x and y by drawing a straight line
through the data.
d. Develop the estimated regression equation by computing the values of b
0
and b
1
using
equations (12.6) and (12.7).
e. Use the estimated regression equation to predict the value of y when x 10.
3. Given are five observations collected in a regression study on two variables.
x
i
2691320
y
i
71892623
a. Develop a scatter diagram for these data.
b. Develop the estimated regression equation for these data.
c. Use the estimated regression equation to predict the value of y when x 6.
Applications
4. The following data give the percentage of women working in five companies in the retail
and trade industry. The percentage of management jobs held by women in each company
is also shown.
%Working 67 45 73 54 61
% Management 49 21 65 47 33
a. Develop a scatter diagram for these data with the percentage of women working in the
company as the independent variable.
b. What does the scatter diagram developed in part (a) indicate about the relationship be-
tween the two variables?
c. Try to approximate the relationship between the percentage of women working in the
company and the percentage of management jobs held by women in that company.
d. Develop the estimated regression equation by computing the values of b
0
and b
1
.
e. Predict the percentage of management jobs held by women in a company that has 60%
women employees.
5. Elliptical trainers are becoming one of the more popular exercise machines. Their smooth
and steady low-impact motion makes them a preferred choice for individuals with knee
and ankle problems. But selecting the right trainer can be a difficult process. Price and
quality are two important factors in any purchase decision. Are higher prices generally
test
SELF
CH012.qxd 8/16/10 6:58 PM Page 493
Copyright 2010 Cengage Learning. All Rights Reserved. May not be copied, scanned, or duplicated, in whole or in part. Due to electronic rights, some third party content may be suppressed from the eBook and/or eChapter(s).
Editorial review has deemed that any suppressed content does not materially affect the overall learning experience. Cengage Learning reserves the right to remove additional content at any time if subsequent rights restrictions require it.

494 Chapter 12 Simple Linear Regression
a. Develop a scatter diagram with price as the independent variable.
b. An exercise equipment store that sells primarily higher priced equipment has a sign
over the display area that says “Quality: You Get What You Pay For.” Based upon your
analysis of the data for ellipical trainers, do you think this sign fairly reflects the price-
quality relationship for elliptical trainers?
c. Use the least squares method to develop the estimated regression equation.
d. Use the estimated regression equation to predict the rating for an ellipitical trainer with
a price of $1500.
6. The cost of a previously owned car depends upon factors such as make and model, model
year, mileage, condition, and whether the car is purchased from a dealer or from a private
seller. To investigate the relationship between the car’s mileage and the sales price, data
were collected on the mileage and the sale price for 10 private sales of model year 2000
Honda Accords (PriceHub website, October 2008).
associated with higher quality elliptical trainers? Consumer Reports conducted extensive
tests to develop an overall rating based on ease of use, ergonomics, construction, and
exercise range. The following data show the price and rating for eight elliptical trainers
tested (Consumer Reports, February 2008).
a. Develop a scatter diagram with miles as the independent variable.
b. What does the scatter diagram developed in part (a) indicate about the relationship
between the two variables?
c. Use the least squares method to develop the estimated regression equation.
d. Provide an interpretation for the slope of the estimated regression equation.
e. Predict the sales price for a 2000 Honda Accord with 100,000 miles.
Miles Price
(1000s) ($1000s)
90 7.0
59 7.5
66 6.6
87 7.2
90 7.0
106 5.4
94 6.4
57 7.0
138 5.1
87 7.2
Brand and Model Price ($) Rating
Precor 5.31 3700 87
Keys Fitness CG2 2500 84
Octane Fitness Q37e 2800 82
LifeFitness X1 Basic 1900 74
NordicTrack AudioStrider 990 1000 73
Schwinn 430 800 69
Vision Fitness X6100 1700 68
ProForm XP 520 Razor 600 55
file
W
EB
Ellipticals
file
WEB
HondaAccord
CH012.qxd 8/16/10 6:58 PM Page 494
Copyright 2010 Cengage Learning. All Rights Reserved. May not be copied, scanned, or duplicated, in whole or in part. Due to electronic rights, some third party content may be suppressed from the eBook and/or eChapter(s).
Editorial review has deemed that any suppressed content does not materially affect the overall learning experience. Cengage Learning reserves the right to remove additional content at any time if subsequent rights restrictions require it.