Andrews Dawid G. An Introduction to Atmospheric Physics
Подождите немного. Документ загружается.


159 Stratospheric ozone
Note that the net effect of reactions (6.11a) and (6.11b) is to produce ozone from molecular
oxygen,
3O
2
→ 2O
3
,
whereas the net effect of reactions (6.11c) and (6.11d) is to destroy ozone in the reverse
manner,
2O
3
→ 3O
2
.
The methods introduced in Sections 6.2 and 6.4 may be applied to reactions (6.11) to
determine the equilibrium ozone distribution. On collecting the production and loss terms
for ozone, we get
∂[O
3
]
∂t
= k
2
[O][O
2
][M]−j
3
[O
3
]−k
3
[O][O
3
], (6.12a)
whereas for atomic oxygen we get
∂[O]
∂t
= 2j
2
[O
2
]+j
3
[O
3
]−k
2
[O][O
2
][M]−k
3
[O][O
3
]. (6.12b)
A similar equation can be written down for ∂[O
2
]/∂t, but it is simpler to note that, since
the total number of oxygen atoms is conserved by these reactions,
[O]+2[O
2
]+3[O
3
]=constant. (6.12c)
Note also that equations (6.12a) and (6.12b) can be added to give an equation for the r ate
of change of odd oxygen, O
x
:
∂[O
x
]
∂t
=
∂[O]
∂t
+
∂[O
3
]
∂t
= 2j
2
[O
2
]−2k
3
[O][O
3
]. (6.13)
In the steady state we set the time derivatives in equations (6.12a), (6.12b) and (6.13) to
zero. These equations are not independent, but from two of them, say (6.12a) and (6.13),
we can get
k
2
[O][O
2
][M]=j
3
[O
3
]+k
3
[O][O
3
], (6.14a)
j
2
[O
2
]=k
3
[O][O
3
]. (6.14b)
In the stratosphere it turns out that j
3
k
3
[O],soequation (6.14a) gives the equilibrium
ratio of the odd-oxygen species in terms of the rate coefficients j
3
and k
2
and the number
densities of O
2
and air (molecule M):
[O]
[O
3
]
=
j
3
k
2
[O
2
][M]
. ( 6.15)
This ratio is determined by the fast reactions (6.11b) and (6.11c); it is found to be very
small in the lower and middle stratosphere, so atomic oxygen is much less abundant than
is ozone there. (The opposite is true in the upper mesosphere.)

160 Stratospheric chemistry
Substitution of equation (6.15) into equation (6.14b) then gives the equilibrium number
density of ozone in terms of the number densities of molecular oxygen and air and the rate
coefficients:
[O
3
]=[O
2
]
j
2
k
2
[M]
j
3
k
3
1/2
. (6.16)
A calculation of the vertical profile of the equilibrium ozone number density predicted
by the Chapman theory can therefore be performed if the vertical profiles of the terms on
the right-hand side of equation (6.16) are known. It is, however, found that the Chapman
theory predicts an ozone maximum that is too large compared with observations (see
Problem 6.5). Deficiencies in the Chapman theory include the neglect of further ozone-
destroying reactions, particularly catalytic cycles, and the neglect of transport of ozone and
other chemicals by atmospheric motions. These are discussed in Sections 6.5.2 and 6.6,
respectively.
It is also important to consider the time scales on which equilibrium in the various
Chapman reactions is attained. The full details are quite complicated, but we note here
that, at 30 km altitude, in the mid-stratosphere, the time scale for equilibration of the odd
oxygen ratio (6.15) is a few minutes, whereas the time scale for destruction of odd oxygen
is several weeks. There is thus rapid adjustment between O and O
3
, but only very slow
changes in O + O
3
.
6.5.2 Catalytic cycles
As noted in the previous section, the Chapman theory predicts too much ozone in the lower
stratosphere. A major reason for this is that it neglects the effects of ozone-destroying
catalytic cycles. These are now considered briefly.
A common catalytic cycle involves the following pair of reactions:
X + O
3
→ XO + O
2
(k
4
), (6.17a)
XO + O → X + O
2
(k
5
). (6.17b)
The net effect of these two reactions is
O + O
3
→ 2O
2
, (6.18)
which destroys ozone just like the Chapman reaction (6.11d). The molecule X is a catalyst;
that is, it takes part in the reactions (6.17) but is not itself consumed. Instead it is ‘recycled’,
so a single X molecule can destroy many ozone molecules and even tiny amounts of the
catalyst may have important effects. Now it was noted in Section 6.5.1 that reaction (6.11d)
is slow; if, however, the net effect (6.18) of the catalytic cycle is faster, this will dominate
the destruction of ozone, and significantly lower the equilibrium amount (see Problem 6.6).
Examples of catalysts X that actually do this in the stratosphere are the hydroxyl radical
(OH), nitric oxide (NO) and chlorine (Cl).

161 The transport of chemicals
Inclusion of catalytic cycles brings theoretical calculations of the ozone distribution into
closer agreement with observations. However, the cycles interact with one another, so
their effects cannot be added linearly. Further complications include the facts that some of
the catalysts may become involved in additional ‘null cycles’, making them unavailable
to reactions (6.17). Moreover, some potential catalysts may be temporarily tied up in
unreactive ‘reservoir species’, such as dinitrogen pentoxide (N
2
O
5
), hydrochloric acid
(HCl) and chlorine nitrate (ClONO
2
). Comprehensive models of stratospheric chemistry
must take all of these effects into account and hence may include tens of reactants and
hundreds of reactions.
6.6 The transport of chemicals
It was noted above that a full theory of stratospheric ozone needs to take account of the
transport of chemicals by air motion; in particular, we must apply the equations governing
chemical reactions to moving parcels of air. An important concept here is the material, or
advective, derivative D/Dt, introduced in Section 4.2, which represents the rate of change
with time following a moving parcel.
Consider an air parcel of unit mass, including a chemical constituent A whose mass
mixing ratio is μ
A
. Then by definition of the mass mixing ratio (see Section 2.2), μ
A
is also
the mass of A in the parcel. If A is neither being produced nor being lost through chemical
reactions, the mass of A is constant following the parcel, so
D(μ
A
)
Dt
= 0. (6.19)
A chemical whose mixing ratio satisfies equation (6.19) is an example of a conservative
tracer.
2
It is straightforward to show that the mass mixing ratio of A is related to the number
density [A] by
ρμ
A
= m
A
[A], (6.20)
where ρ is the density of air, including the constituent A (see Section 2.2), and m
A
is the
molecular mass of A. Equation (6.19) can therefore be written
D
Dt
m
A
[A]
ρ
= 0
and so, since m
A
is constant,
1
ρ
D[A]
Dt
−
[A]
ρ
2
Dρ
Dt
= 0.
2
Other examples of conservative tracers are the potential temperature θ (when the diabatic heating Q = 0; see
Section 4.10) and the potential vorticity P (when both the diabatic heating and friction are zero; see Section 5.1).

162 Stratospheric chemistry
However, from the mass-continuity equation (4.8), Dρ/Dt =−ρ∇·u,whereu is the
fluid velocity. After some rearrangement and expansion of the material derivative D/Dt =
∂/∂t + u ·∇,weget
∂[A]
∂t
+ u ·∇[A]+[A]∇·u = 0,
or, collecting the terms in u,
∂[A]
∂t
+ ∇·
(
u[A]
)
= 0. (6.21)
This shows how the number density of a conservative tracer A changes in response to
compression or expansion of a parcel of air, as it is advected with the local velocity field u.
The analogy with the mass-continuity equation (4.3) should be noted; see Problem 6.8.
Now suppose that A is undergoing chemical reactions so that, in addition to this com-
pression or expansion effect, there is a contribution −R
A
to the rate of change of the number
density [A];cf.equation (6.6). Equation (6.21) must then be replaced by
∂[A]
∂t
+ ∇·
(
u[A]
)
=−R
A
. (6.22)
All time derivatives of number densities in Sections 6.2–6.5 must be replaced by expressions
analogous to that on the left-hand side of equation (6.22), when transport is to be taken into
account. The right-hand side of equation (6.22) is commonly split into ‘production’ and
‘loss’ terms in the form −R
A
= P
A
− L
A
.
It can be shown that, when chemical reactions are taking place, equation (6.19) for the
mixing ratio must be replaced by
D(μ
A
)
Dt
=−
m
A
R
A
ρ
. (6.23)
In this case A is called a non-conservative tracer.
By analogy with the chemical lifetimes defined in Section 6.2, we can also define a
dynamical lifetime
τ
dyn
=
[A]
|
∇·
(
u[A]
)
|
.
This may be difficult to estimate without quite detailed knowledge of the velocity field,
but, in general, if τ
dyn
is much longer than the chemical lifetime τ
A
, then changes in A will
be mainly chemical, whereas if τ
dyn
is much shorter than τ
A
then A will be essentially a
conservative tracer.
In principle, a full treatment of atmospheric chemistry should follow the motion of each
parcel of air and account for the changes of each chemical constituent within the parcel,
using equation (6.22) or equation (6.23). In practice this would be impossibly complicated,
even if the motion itself were known precisely. One feasible approach is to follow the
trajectories of a small but representative set of parcels and track the chemical changes for
each parcel as it moves through regions of differing composition and perhaps into and out
of sunlight. Such a trajectory calculation needs accurate knowledge of the wind fields and
163 The transport of chemicals
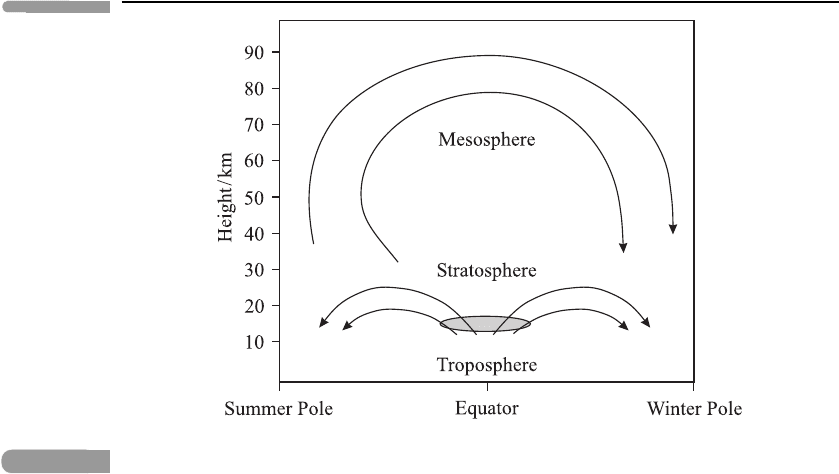
Fig. 6.4 A schematic plot of the Brewer–Dobson circulation (lower four arrows, in the stratosphere) and the
solstitial mesospheric circulation (upper two arrows). The shaded ellipse indicates the
approximate position of the 200 K isotherm near the equatorial tropopause, i.e. the ‘cold trap’
identified by Brewer (1949).
these must usually be found from models: observations on their own are seldom sufficient
for an accurate determination of winds over extensive regions.
Nevertheless, some patterns of transport are well established, at least in a qualitative
sense. The most important transport structure in the stratosphere is the Brewer–Dobson
circulation: this is a meridional circulation, i.e. a circulation in the north–south and vertical
directions. (The superimposed east–west motion is much more rapid, but is conceptually
less important for global transport of chemicals.) It involves upward motion of air parcels
from the troposphere into the stratosphere at low latitudes, poleward motion in the lower
stratosphere of each hemisphere and a gentle descent back into the troposphere in middle
and high latitudes; see Figure 6.4. The upward motion in low latitudes was inferred by
Brewer (1949) from the fact that the stratosphere is very dry: he reasoned that the inability
of moisture from the troposphere to get into the stratosphere must be due to the fact that
most of the air that moves from the troposphere into the stratosphere passes through a
very cold region (often called the ‘cold trap’ in this context) at the equatorial tropopause
(see Figure 1.5). Here it is ‘freeze-dried’, with water vapour forming ice particles that fall
out under gravity. The poleward motion in the lower stratosphere was inferred by Dobson
(1956) from observations of the ozone distribution: although ozone is mainly formed in the
equatorial stratosphere from reactions (6.11a) and (6.11b), significant number densities are
found at high latitudes, which must be due to transport from low latitudes. (Note that, if a
parcel retains its ozone mixing ratio as it descends – and is compressed – at high latitudes,
then the number density increases. This is also evident from equation (6.20), since the
parcel encounters increasing air density as it descends.) Although the general form of
the Brewer–Dobson circulation was originally obtained from the observed distributions of

164 Stratospheric chemistry
chemicals, elucidation and interpretation of its structure has required detailed theoretical
and numerical modelling studies.
Another large-scale circulation in the middle atmosphere occurs around the solstices, with
upward motion in the summer stratosphere and mesosphere, a summer-to-winter motion in
the mesosphere and a descent over the winter pole; see Figure 6.4 again. This circulation
also has important implications for the transport of chemicals. Both of these circulations
are essentially wave-driven: the Brewer–Dobson circulation by planetary waves and the
solstitial circulation mainly by gravity waves (see also Section 9.5.2).
6.7 The Antarctic ozone hole
A useful general measure of ozone in the atmosphere is the column ozone or total ozone,
defined in terms of the total number N
3
of molecules of ozone in a complete vertical column
of atmosphere of unit horizontal cross-section:
N
3
=
∞
0
[O
3
]dz.
A convenient measure of column ozone is the Dobson Unit (DU), defined as the height of
the column, in hundredths of a millimetre, if all the ozone molecules in it were brought to
a pressure of 1 atm and a temperature of 0
◦
C. Typical values of column ozone are about
300 DU, meaning that the height of the column, compressed in this way, would be only
about 3 mm. Most of the ozone molecules occur in the stratosphere.
As was mentioned in Section 1.4.4 and illustrated in Figure 1.10, the column ozone varies
from place to place over the globe and with time; we focus here on its behaviour in the
Antarctic. Measurements of the seasonal variation of column ozone amounts over Antarctica
have been made since 1956. In particular, members of the British Antarctic Survey have
made such measurements with a Dobson ozone spectrophotometer (see Section 7.3.1)at
Halley station (76
◦
S, 27
◦
W), except during the midwinter polar night, when the Sun
does not rise for almost 4 months. The typical annual variation in the Antarctic, prior to
the late 1970s, had a minimum of about 250–300 DU in spring and a maximum of about
400 DU in summer. However, in more recent years the picture has changed significantly:
monthly mean October amounts generally decreased throughout the 1980s and have fallen
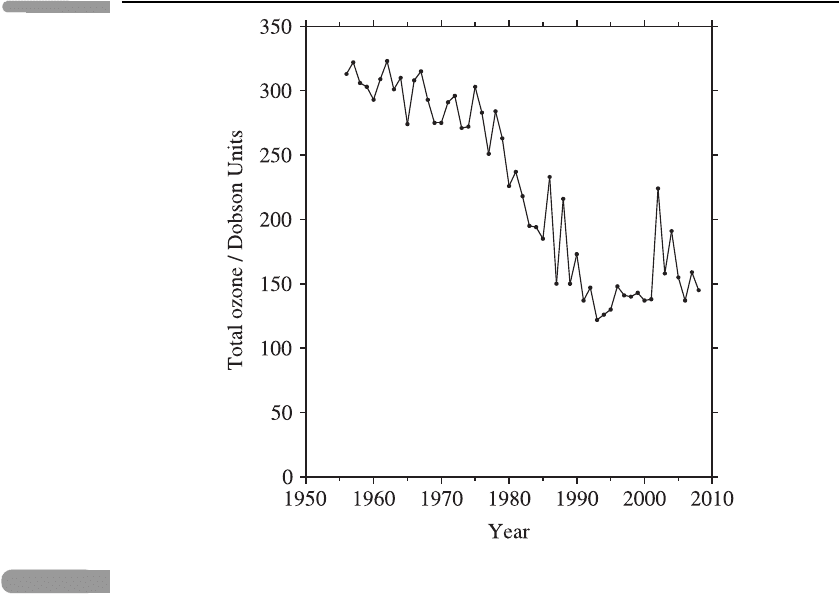
below 160 DU in each year between 1991 and 2008, except 2002 and 2004; see Figure 6.5.
These routine ground-based measurements were confirmed by satellite observations with
the Total Ozone Mapping Spectrometer (TOMS) and also by several special international
expeditions to the Antarctic, in which very detailed measurements of the spring ozone-
depletion phenomenon were made. These revealed a large-scale ‘ozone hole’, a region
whose horizontal size approaches that of the Antarctic continent, within which a massive
loss of ozone occurs over a period of about 6 weeks during the Southern Hemisphere’s
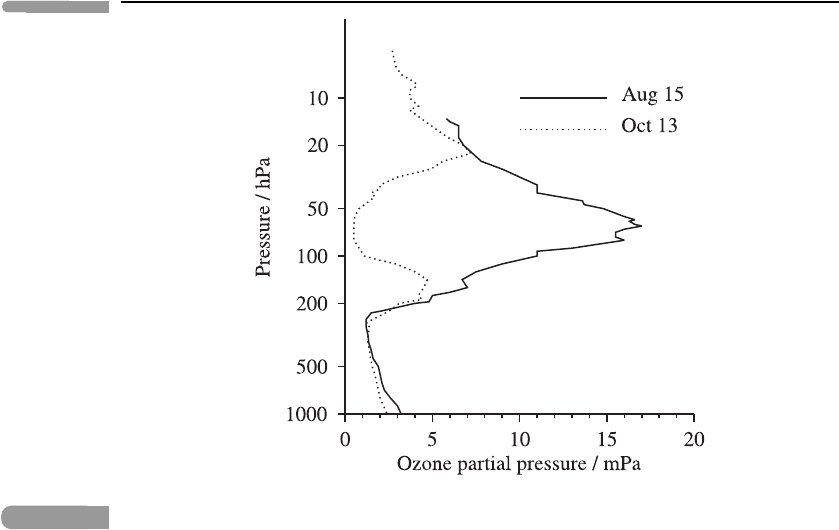
spring, between August and October. Observations of the vertical structure of the ozone
layer in the Antarctic show that, at many locations, nearly all the ozone may disappear at
this time between about 15 and 20 km altitude; see Figure 6.6. Later in the year, ozone
165 The Antarctic ozone hole
Fig. 6.5
Monthly mean values of column ozone in October at Halley station for 1957–2008. Drawn using
data provided by J. D. Shanklin, British Antarctic Survey.
returns to the Antarctic stratosphere, although the region of depleted ozone content may
drift away into lower latitudes before it is ‘filled in’.
After extensive study by many atmospheric chemists and physicists a broad understand-
ing of the Antarctic ozone hole has been attained: a qualitative description is as follows.
In the winter night the polar regions receive no solar radiation, but can readily emit infra-
red radiation to space. At the same time a strong circumpolar (eastward) vortex forms in
the Antarctic stratosphere; this is subject to very little disturbance by planetary waves
3
and so there is little wave-induced dynamical heat transport from lower latitudes into the
vortex. The vortex therefore becomes very cold and ‘polar stratospheric clouds’ (PSCs) –
thin clouds of ice or liquid water particles – can form in the Antarctic lower stratosphere.
Similarly, there is little latitudinal transport of chemicals into or out of the vortex, which
therefore acts rather like a ‘chemical containment vessel’. By contrast, the Arctic polar
winter vortex is usually more disturbed by planetary waves and has more heat transport
3
The Northern Hemisphere has two large continental land-masses at midlatitudes: during the winter the eastward
winds blowing over these continents give rise to stationary Rossby waves in the troposphere (see Section 5.5).
These in turn lead to stratospheric Rossby-wave-like disturbances that disrupt the northern winter stratospheric
vortex from time to time. The absence of large midlatitude continental land-masses in the Southern Hemisphere
means that such disruptions seldom occur there.
166 Stratospheric chemistry
Fig. 6.6
The partial pressure of ozone in the lower stratosphere over Halley station on 15 August (solid
line) and 13 October 1987 (dotted), showing the almost total loss of ozone between about 15 and
20 km altitude during this period. Adapted from Gardiner (1989).
from lower latitudes, so the cold winter conditions that allow PSCs to form are less common
in the Arctic stratosphere.
It turns out that purely gas-phase chemistry cannot account for the large ozone losses that
are found in the lower stratosphere during the Antarctic spring: ‘heterogeneous’ reactions,
on the surfaces of the PSC particles, are also necessary. (The vertical region of ozone
depletion shown in Figure 6.6 is located near a PSC.) The process is too complex to be
explained in detail here, but the main features are as follows.
• Catalytic cycles involving chlorine species, including the chlorine monoxide dimer
(ClO)
2
, and reactive bromine species (e.g. BrO), can effectively remove ozone at the
cold temperatures present in the lower Antarctic stratosphere during the spring. These
cycles are inhibited if ClO becomes trapped in the reservoir species chlorine nitrate
(ClONO
2
), as noted in Section 6.5.2. However, this effect is diminished in the presence
of PSCs, since nitric acid (HNO
3
) condenses on the surfaces of the PSC particles,
which in turn may sediment out under gravity, removing the NO
2
that is needed to form
ClONO
2
.
• Moreover, the reservoir species ClONO
2
and HCl (hydrochloric acid) can actually release
chlorine compounds (Cl
2
and HOCl) on the surface of the PSCs and these compounds
are readily photolysed when the Sun returns in early spring, providing a supply of Cl for
the catalytic cycles.
• A chlorine catalytic cycle of the form (6.17),whereX= Cl, is too slow in the lower
stratosphere to account for the observed depletion of ozone.
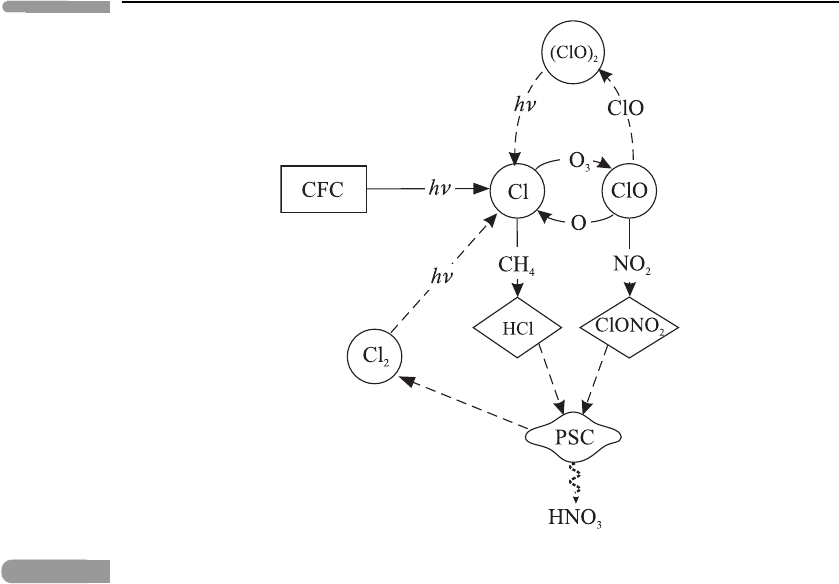
167 The Antarctic ozone hole
Fig. 6.7
A schematic diagram of some of the chemical processes involved in ozone depletion in the
Antarctic. The rectangle represents the source of chlorine, the circles represent reaction
intermediates and the diamonds represent reservoir species. The dashed lines represent reactions
that occur only in the presence of PSCs or at unusually low temperatures. Adapted from Wayne
(2000).
• Some of the stratospheric chlorine is derived from naturally occurring methyl chlo-
ride (CH
3
Cl), but most comes from photolysis in the stratosphere of the man-made
chlorofluorocarbons (CFCs); for example, the CFC CF
2
Cl
2
is photolysed by ultra-violet
radiation in the reaction
CF
2
Cl
2
+ hν → Cl + CF
2
Cl.
A schematic diagram of these processes is given in Figure 6.7.
The Antarctic ozone hole therefore arises from a blend of chemical, dynamical and
transport processes. Transport carries chlorine compounds from the industrial regions of
the Northern Hemisphere to the Antarctic. The absence of planetary waves makes the
Antarctic winter stratosphere an especially cold and isolated part of the atmosphere, where
PSCs can form. Finally, chemical reactions, including reactions on the PSC particles, lead
to rapid and massive local depletion of ozone in the Antarctic spring.
Ozone depletion is not confined to the Antarctic spring. World-wide data show that there
have been ozone losses at other latitudes since the 1970s: for example a 5% per decade
drop in column ozone has been observed between 40
◦
N and 60
◦
N in winter. Possible
causes of global-scale depletion include the ‘dilution’ of the rest of the atmosphere, due

168 Stratospheric chemistry
to dispersion of the Antarctic ozone hole when the vortex finally breaks down in spring;
similar but weaker ‘mini ozone holes’ in the Arctic, which have been observed in some
recent winters; and other types of heterogeneous chemistry, taking place on volcanic cloud
particles and involving further chemical species.
The decrease in amount of atmospheric ozone may also have climatic effects, in addition
to the direct biological effects mentioned in Section 1.4.4. Less ozone in the stratosphere
implies less absorption of solar and infra-red radiation there (see Section 3.5.3) but also
less infra-red emission: the net effect is found to give a cooler stratosphere. Moreover,
the decrease in amount of stratospheric ozone during recent decades is believed to have
led to cooling in the troposphere also, partly offsetting the enhancement of the greenhouse
warming there due to the increase in amounts of carbon dioxide and other greenhouse
gases: see Section 8.1.
Further reading
The book by Graedel and Crutzen (1995) provides a non-technical introduction to
atmospheric chemistry and its implications for climate. The basic physical chem-
istry mentioned in this chapter is treated in more detail by Atkins (2006)and
Hobbs (1995), for example, and the thermodynamic and kinetic-theory background
are covered, for example, by Blundell and Blundell (2009). Specialised texts on
atmospheric chemistry, covering most of the topics in this chapter, include those by
Wayne (2000)andBrasseur and Solomon (2005). Lary (1997) presents a review of ozone-
destroying catalytic cycles in the stratosphere. A detailed treatment of stratospheric transport
is given by Andrews et al. (1987). Dessler (2000) provides an introductory survey of the
chemistry and physics of stratospheric ozone while Solomon (1999) gives an authoritative
review of research into stratospheric ozone depletion.
Problems
Problem 6.1 Verify the result, mentioned in Section 6.1, that the photolytic reaction (6.4)
requires photons of wavelength less than about 240 nm, given that the molar enthalpy of
reaction is about +500 kJ mol
−1
.
Problem 6.2 Can the reaction
NO
3
+ H
2
O → HNO
3
+ OH
occur spontaneously at standard temperature and pressure? Use the following Gibbs free
energies of formation at STP (all in kJ mol
−1
): HNO
3
, –74.7; OH, 34.2; NO
3
, 115.8; and
H
2
O, –228.4.
Problem 6.3 Consider a bimolecular reaction in the form of equation (6.1). Show from
equation (6.7) that [B]−[B]
0
=[A]−[A]
0
, where the subscripts 0 indicate the values at