Barnes D.J., Chu D. Introduction to Modeling for Biosciences
Подождите немного. Документ загружается.


5.5 Maxima: Beyond Preliminaries 203
plots x
2
and x
3
with styles 3 and 4 respectively. When printing on screen, these
styles are different colors, but may be converted to dotted or dashed lines, and the
like, when saved to file (the line-style depends on the format in which it is saved).
Replacing the style option above by [style,[points,3,4]]would plot
points rather than connected curves (which is rather pointless in this case, but
could be useful sometimes). Finally, [style,[linespoints]]would plot
points connected by lines. This latter option accepts numbers to modify size,
style, and color of the points and the lines. When two curves are plotted into
the same figure, then each may have its own set of options. To plot the first
one using lines and the second one using points one needs to specify the op-
tion [style,[lines],[points]]. Many other combinations are possible,
of course.
Plotting to file There is a very simple way to save the plot to file. The option
[psfile,“myFirstplot.ps”] within a plot2d command will save the
plot in a file called myFirstPlot.ps in Postscript format. On Mac OSX this
file can be opened by double-clicking on the file. On other platforms this may be
more involved and require additional programs. Users who are not comfortable
handling Postscript files are advised to use the Gnuplot options below to save the
output of a plot in a different format.
Readers who have their own favorite plotting program may be interested in the
maxout.gnuplot_pipes file. Whenever Maxima produces a plot it writes the
sample dots that will be used to plot the figure into this temporary file; most likely
this is located in the home directory of the user (at least on Mac OSX and Linux
systems). The points in this file can be used directly to generate the plots using
third-party software.
Since Maxima uses Gnuplot as the plotter, it is also possible to harness some of
the power of Gnuplot directly from within Maxima to produce high quality, highly
customized plots. This is particularly useful when there is a need to export the plot in
file formats other than the standard provided by plot2d. To do this it is necessary
to pass options directly to Gnuplot. The simplest option is designed for output to
terminals
19
with no graphics capabilities, as follows
plot2d(x^2,[x,1,2],[gnuplot_term,dumb],
[gnuplot_out_file,“art.txt”])
This will plot a pseudo-graphic using keyboard characters into the file art.txt.
It can be viewed using a text editor. Besides terminal-type dumb, there are a number
of other Gnuplot terminals. These include JPEG, Postscript, PNG, PDF and many
others. However, not all are installed by default on every system, hence some of the
commands might not work. We give a few examples of options to illustrate the pos-
sibilities. To save space, we will henceforth not repeat the gnuplot_out_file
option, but this must always be supplied to specify the output file.
[gnuplot_term, “png size 123 123”]
19
In its widest sense, “terminal” is best thought of as Gnuplot-jargon for file format.
204 5 Mathematical Tools
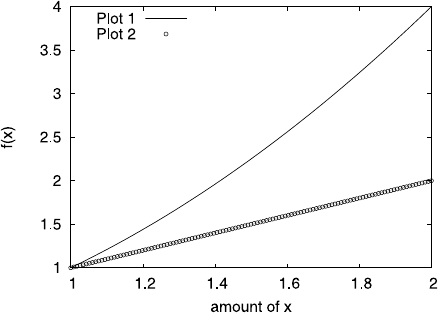
Fig. 5.1 This plot was produced using the following command: plot2d([yˆ2,y],
[y,1,2],[legend,"Plot 1","Plot 2"],[xlabel,"amount of x"],
[ylabel,"f(x)"],[style,[lines,2],[points,2]],[gnuplot_term,
"postscript enhanced monochrome"],[gnuplot_out_file,
"examplePlot.eps"],[gnuplot_preamble,"set key t l"])
Will plot the graph in PNG format and in color and uses the size 123×123 pixels.
[gnuplot_term,“postscript enhanced color”]
Plots in Postscript format, but generally produces very high quality results.
Changing the keyword color to monochrome produces very good black-and-
white graphs.
[gnuplot_term,pdf]
Produces output in PDF format but requires the relevant driver to be installed.
We have noted before that it might be necessary to adjust the position of the
legend in the plot. This can be done by providing options directly to Gnuplot, us-
ing the gnuplot_preamble option. So, for example, the legend can be set at
the bottom right corner by providing the option [gnuplot_preamble,“set
key bottom right”], where bottom right could be abbreviated to br;
top, right and center are available analogously. The legend can also be com-
pletely suppressed by [gnuplot_preamble,“set nokey”]. Finally, a last
useful option is title:
[gnuplot_preamble, “set title ’Display’”]
which causes Gnuplot to place “Display” at the top of the plot window.
Figure 5.1 shows an example using some of these options.
The command for 3-D plots in Maxima is plot3d. Its syntax is very similar to
plot2d, so much of the understanding we have gained so far will apply. A basic
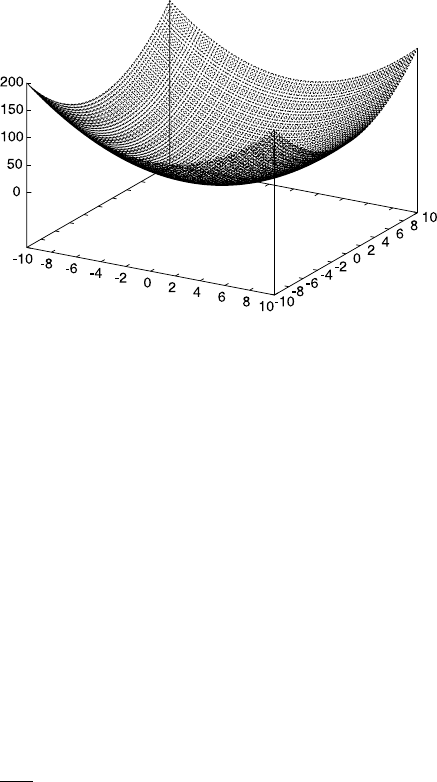
plot can be created using a command such as (Fig. 5.2)
plot3d(xˆ2 + yˆ2, [x,-10,10],[y,-10,10])
5.5 Maxima: Beyond Preliminaries 205
Fig. 5.2 This graph was
produced using the command:
plot3d (xˆ2 + yˆ2,
[x,-10,10],
[y,-10,10],
[legend,false],
[grid,100,100],
[gnuplot_term,
"postscript enhanced
monochrome"],
[gnuplot_out_file,
"3dexample.eps"])
On most computer systems this will bring up a separate Gnuplot window. Using
the mouse it is possible to interact with the 3d plot by turning it and exploring it from
different angles. A relevant option to control the size of the grid, that is the number
of output points, is [grid,100,299]. The larger the numbers, the denser the
grid. For very dense grids the Gnuplot interface might become sluggish, although
for plotting to file this should not be a problem.
Most of the 2d options, and certainly all of the Gnuplot options, can be used in
the case of plot3d. We leave it to the reader to explore this by herself.
5.5.4 Integrating and Differentiating
A priority for the biological modeler is to be able to differentiate and in-
tegrate expressions and functions. The principles are very simple. The com-
mand diff(eq1,x) returns the derivative of eq1 with respect to x. We can
extend this to diff(eq1,x,2) which returns the second derivative, while
diff(eq1,x,y) returns
∂
2
∂x∂y
eq1.
The syntax for integration is equally simple. The command integrate(eq1,
x) returns the non-specific integral, whereas, integrate(eq1,x,1,2) returns
2
1
eq1dx. The basics barely need any more introduction, as the reader will have ac-
quired some intuition about how to use Maxima commands. There are a few tricks,
however that can be quite useful in some contexts. In the following example we
differentiate and integrate an expression, then use the kill(all) command to
clear the memory of Maxima—this removes all the stored items—and, finally, we
demonstrate how we can use derivatives as unspecified expressions without eval-
uating them. This can be quite useful, for instance if the derivatives are very long
expressions. We have already encountered the keyword eval and numer to manip-
ulate what the ev command is doing. In the next example we introduce the keyword
diff that forces derivatives to be calculated explicitly.

206 5 Mathematical Tools
(%i1) eq1: x^a - sin(x)$
(%i2) integrate(eq1,x);
Is a +1 zero or nonzero? nonzero;
(%o2) cos(x) +
x
a+1
a+1
(%i3) diff(%,x);
(%o3) x
a
−sin(x)
(%i4) kill(all)$
(%i1) eq1;
(%o1) eq 1
(%i2) g(x):= diff(f(x),x)$
(%i3) eq1: f(x)/g(x);
(%o3)
f(x)
d
dx
f(x)
(%i4) ev(eq1,f(x)=x^2 -(x^2/(x^2 + K)),K=1);
(%o4)
x
2
−
x
2
x
2
+1
d
dx
(x
2
−
x
2
x
2
+1
)
(%i5) ev(eq1,f(x)=x^2 -(x^2/(x^2 + K)),K=1,diff);
(%o5)
x
2
−
x
2
x
2
+1
−
2x
x
2
+1
+
2x
3
(x
2
+1)
2
+2x
Note the difference between %o4 and %o5. Whereas in the latter the differential
is evaluated, in the former it is not. The difference is due to the inclusion of the
diff keyword.
Suppressing the evaluation of an expression is often desirable and is achieved
by preceding it with an inverted comma: ’. This can be useful in many contexts,
but is particularly necessary when formulating differential equations in Maxima.
The evaluation of a suppressed expression can be forced by preceding it with two
inverted commas.
The following example uses the command ode2 to solve the differential equa-
tion ˙x = a − bx. Using the inverted comma operator, this equation can be sim-
ply entered into Maxima like a normal algebraic equation. The ode2 command
takes three arguments, namely the equation itself (in this case eq1), the function
for which it should be solved (here x) and the variable with respect to which the
function is differentiated (here t). The system then returns the general solution that
contains an arbitrary integration constant (%c). A convenient feature of Maxima is
the command ic1 that allows specification of the initial conditions, and returns the
specific solution of the differential equation. In the example below, we choose an
initial condition corresponding to x(0) =10.
(%i1) eq1: ’diff(x,t) = a - b*x;
(%o1)
d
dt
x =a −bx
(%i2) sol: ode2(eq1,x,t);
(%o2)x=e
−bt
ae
bt
b
+%c
(%i3) eq1: ic1(sol,x=10,t=0);

5.5 Maxima: Beyond Preliminaries 207
(%o3)x=
e
−bt
(ae
bt
+10b−a)
b
(%i4) plot2d(rhs(ev(eq1,a=1,b=2)),
[t,0,6],[xlabel, "t"], [ylabel,"x(t)"],
[psfile,"ishq.eps"],
[gnuplot_preamble,"set nokey"])
Unfortunately, solving differential equations analytically is only of limited use.
Biological models are nearly always too complicated to be solved by Maxima. Nev-
ertheless, it is of course still good to know how to solve differential equations an-
alytically in Maxima, even if in most cases we will need to resort to solving our
system numerically.
The command rk can be invoked to solve ordinary differential equations using
the 4th order Runge-Kutta method. This method has its limitations and may not
always return stable results for some more difficult (stiff) systems. In these cases it
may be necessary to use more powerful tools such as XPPAUT. For the vast majority
of models, however, rk will be sufficient.
As a first example, let us solve again the differential equation ˙x = a − bx, this
time numerically. To obtain a solution, rk must be provided with (in this order)
the differential equation, the dependent variable, the initial value (e.g., x(0)) and
a specification of the independent variable and its range. An example of the latter
would be: [t,0,10,0.1]. The first entry specifies the independent variable; the
second and third are the interval over which the solution is found; the last entry
determines the number of points that are generated. The smaller this number, the
more will be generated. The output of rk is a list of points that can be plotted
using plot2d (and the discrete option) or exported and plotted with an external
program.
Concretely, to obtain a solution to our differential equation with a = b = 1, we
need to first load the dynamics package, by typing load(dynamics). This pack-
age should be pre-installed on most systems. The command rk always outputs all
solution points. It is therefore best to suppress output by ending a line with a dollar
sign and to assign the output to a variable, say sol.
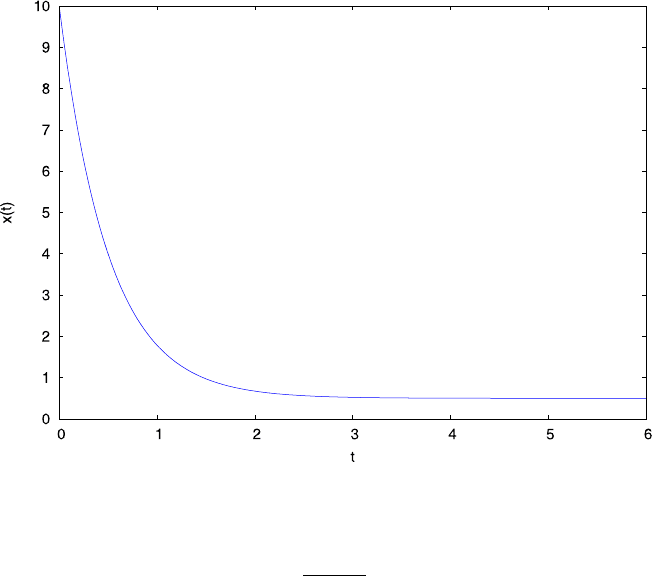
sol: rk(1-x,x,10,[t,0,6,0.1])$
The variable sol contains now a list of points corresponding to the so-
lution of the differential equation ˙x = 1 − x for t = 0 ...6 and for an ini-
tial value of x(0) = 10. A basic plot of the solution can be generated using
plot2d([discrete,sol]) (Fig. 5.3).
5.5 Solve ˙x =a −bx numerically and produce a few sample plots of the solution.
The command
rk can also be used to solve systems of differential equations. The
syntax generalizes straightforwardly to several equations, yet the options relating to
the variables and the initial conditions must be supplied within square brackets. As
an example, let us solve
˙x =xy−x (5.1)
208 5 Mathematical Tools
Fig. 5.3 The solution for ˙x =a −bx solved in Maxima. We used the parameters, a =b =1
˙y =y
x
2
x
2
+10
−y (5.2)
In Maxima this system can be numerically solved as follows:
(%i1) eq1: x*y - x$
(%i2) eq2: y*(x^2/(x^2 + 10)) - y$
(%i3) load(dynamics)$
(%i4) sol: rk([eq1,eq2],[x,y],[1,1],[t,0,10,0.1])$
(%i5) sol1:makelist([sol[i][1],sol[i][2]],
i,1,length(sol))$
Lines %i1 and %i2 define the right hand sides of the differential equations.
When using rk for systems of equations it is essential to provide the list of depen-
dent variables in the correct order. Since eq1 defines how x changes, x must be
supplied first in the list of variables. The same applies to the list of initial condi-
tions. The option for the independent variable t is the same as in the case of a single
differential equation.
In the case of two equations, the output of rk is a list, of which each entry
is itself a list of three points, corresponding to [t,x,y]. If there are more than
two equations to be solved then the output is expanded accordingly. A problematic
consequence of this is that plot2d cannot accept this format directly. It is therefore
necessary to extract a list of pairs from the list of triples. This is done in %i5 above.

5.6 Maxima: Case Studies 209
We will not describe the details of list manipulation in Maxima, but the command
makelist will be useful as it takes an expression and converts it into a list.
In our case, the expression is itself a list, namely the list corresponding to the
first and second entry of each list in the output of rk. This corresponds to the values
of t and x. The second entry in the command, i, names the index; the third selects
the first element; and the fourth selects the last index to be written. So altogether,
%i5 takes the first and second entry from each entry of the output list produced
by rk, and puts these into a new list. It does that for every entry in sol ranging
from the first to the last. To extract the solutions for y, instead, one can simply
replace sol[i][2] by sol[i][3]. Having extracted the sublists, the individual
solutions can again be plotted using plot2d.
5.6 Extract from sol a list where each entry is a list whose first entry is a solution
of x and the second entry is a solution of y.
5.6 Maxima: Case Studies
In the remainder of this chapter we will illustrate the usage of Maxima using exam-
ples developed earlier in the book. The biological meaning of these examples has
been discussed before, and we will not repeat this discussion. Our purpose here is
solely to illustrate how Maxima can be used to solve the technical side of the mod-
eling problem. This will be a welcome and useful addition to the listing mode that
has so far dominated this chapter.
5.6.1 Gene Expression
We start with the simple model of gene expression given by differential equa-
tion (4.19).
˙x =a −bx (4.19)
We have already used Maxima to solve a similar system using ode2 in the previ-
ous section. We will not repeat this. Instead, we will now try to reproduce this result
by “manually” generating a solution using the separation of variables technique.
To do this we will need to integrate each side of the equation:
dx
a −bx
=dt
This gives us an algebraic equation that we can solve for x.
(%i1) expr1: (a - b*x)^(-1);
(%o1)
1
a−bx
(%i2) leftS: integrate(expr1,x);

210 5 Mathematical Tools
(%o2) −
log(a−bx)
b
(%i3) eq1: leftS =C+t;
(%o3) −
log(a−bx)
b
=C +t
(%i4) solve(eq1,x);
(%o4)
x =
a−e
−bC−bt
b
(%i5) tmpv: rhs(%[1]);
(%o5)
a−e
−bC−bt
b
We have now generated the general solution. Comparing this solution with (4.20)
shows that the solutions are not the same. This is not a problem, however, as the
difference between the solutions is merely a result of the differing definitions of C
here and in (4.20). Once we have specified our initial conditions, the results should
be the same.
Let us now do exactly that. In Sect. 4.3.1 we chose as our initial condition x(0) =
0. We make the same choice here. To determine C we need to equate the general
solution (%o5) to zero, solve for C and re-insert the resulting expression into the
general solution. We continue our session.
(%i6) tmpC: solve(ev(tmpv,t=0),C);
(%o6)
C =−
log
(
a
)
b
(%i7) C: rhs(tmpC[1]);
(%o7) −
log(a)
b
(%i8) solution: ’’tmpv;
(%o8)
a−ae
−bt
b
This is precisely the same solution we obtained in Sect. 4.3.1.
5.6.2 Malaria
Let us now progress to a more challenging case study. In Sect. 4.4 we developed
a model for the spread of Malaria consisting of a system of coupled differential
equations (4.30).
˙s =a(1 −s)m −bs
˙m = c(1 −m)s −dm
(4.30)
We first solve the system of equations numerically using the parameter values from
Fig. 4.7, e.g., a =1, b =0.4, c =1, d =2. We will not actually reproduce the plot
here, but we will provide the commands necessary to bring up a basic plot during a
Maxima session.
(%i1) eq1: a*(1-s)*m - b*s$
(%i2) eq2: c*(1-m)*s - d*m$
(%i3) (a:1, b:0.4, c:1, d:2)$
(%i4) (en1: ’’eq1, en2: ’’eq2)$

5.6 Maxima: Case Studies 211
(%i5) sol: rk([en1,en2],[s,m],[0.1,0.1],[t,0,120,0.1])$
(%i6) length(sol);
(%o6) 1201
(%i7) sol[1201];
(%o7) [ 120.0, .1428549797077344, .06666568841299914 ]
(%i8) sol[1201][2];
(%o8) .1428549797077344
(%i9) res1: makelist([sol[i][1],sol[i][2]],
i,1,length(sol))$
(%i10) res2: makelist([sol[i][1],sol[i][3]],
i,1,length(sol))$
(%i11) res1[1201];
(%o11) [ 120.0, .1428549797077344 ]
(%i12) plot2d([[discrete,res1],[discrete,res2]],
[gnuplot_preamble,"set key b r"],
[gnuplot_term,"postscript monochrome"],
[gnuplot_out_file,"pyaar.eps"]);
Line %i5 performs the actual integration of the result. The input lines thereafter
only check the format of the output of the solver and process the results to get them
ready for plotting. The variables res1 and res2 are lists of lists. The first entry
of each is the time and the second entries are the values of s(t) (res1) and m(t)
(res2). A comparison of %o7 and %o11 will clarify the structure of the output
of rk. Finally, we plot the solution to a file called “pyaar.eps.”
We continue our session by checking the stability of the solution. To do this,
we first calculate the Jacobian; remember that this requires the additional package
linearalgebra. Then we calculate the steady state solutions of the system di-
rectly from the set of differential equations by setting the right hand sides to zero.
At this point, we would like to do this without specifying the values of the parame-
ters. We therefore need to make Maxima forget the values by issuing the command
kill(a,b,c,d). We then substitute the trivial solution into the Jacobian and cal-
culate the eigenvalues.
(%i13) with(linearalgebra)$
(%i4) J: jacobian([eq1,eq2],[s,m]);
(%o14)
00
00
(%i15) kill(a,b,c,d)$
(%i16) sol2: solve([eq1,eq2],[s,m]);
(%o16)
s =−
bd−ac
(b+a)c
, m =−
bd−ac
ad+ac
, [s =0, m =0]
(%i17) Jss: ev(J,s=0,m=0,simp);
(%o17)
−ba
c −d
(%i18) eigV: eigenvalues(Jss);
(%o18)
−
√
d
2
−2bd+4ac+b
2
+d+b
2
,
√
d
2
−2bd+4ac+b
2
−d−b
2
,
[
1, 1
]

212 5 Mathematical Tools
The first list gives the two eigenvalues of the system. This is the solution we
reported earlier in Sect. 4.4.1 on p. 163. The second list is the multiplicity of the
eigenvalues.
5.6.3 Cherry and Adler’s Bistable Switch
In Sect. 4.6 we considered the bistable switch (4.47). The system was given by a
pair of differential equations.
˙x =
K
h
K
h
+y
h
−bx
˙y =
K
h
K
h
+x
h
−by
(4.47)
In the next session example we wish to determine the steady states for various pa-
rameters, and determine their stability. To get there we first calculate the steady
state points of the system by setting the right hand sides to zero. We can solve this
system in several ways. One possibility is to use solve, which would return all
results. A better solution is to use realroots which will return only real solu-
tions (and we are only interested in those). The problem is that realroots can
only be applied to polynomials. So, we need to bring the equations into the form of
a polynomial. To get there, we define the function ssv (“steady state values”) that
first assigns numerical values to the equations eq1 and eq2. Secondly, it substitutes
eq2 into eq1 obtaining a new equation called ffgl. It then converts ffgl to a
canonical rational expression. Multiplying this by its denominator yields a polyno-
mial that can be solved using realroots. Finally, the last step of ssv is to return
the results in a convenient list structure.
(%i1) eq1: K^h/(K^h + y^h) - b*x$
(%i2) eq2: K^h/(K^h + x^h) - b*y$
(%i3) ssv(pK,ph,pb):=
block( fgl1: ev(eq1,K=pK,h=ph,b=pb),
fgl2: ev(eq2,K=pK,h=ph,b=pb),
fy: solve(fgl2,y),
ffgl: ev(fgl1,y=rhs(fy[1])),
ffgl2: rat(ffgl),
ffgl: ffgl2*denom(ffgl2),
fres: realroots(ffgl),
ffres:makelist(float(fres[i]),i,1,
length(fres)))$
(%i4) ssv(2,2,1/10)[1];
(%o4) x =.4174242913722992
So far we have only defined a function to calculate the steady states. Next we
want to define a new function that can generate a whole list of solutions for different