Bhushan B. Handbook of Micro/Nano Tribology, Second Edition
Подождите немного. Документ загружается.

© 1999 by CRC Press LLC
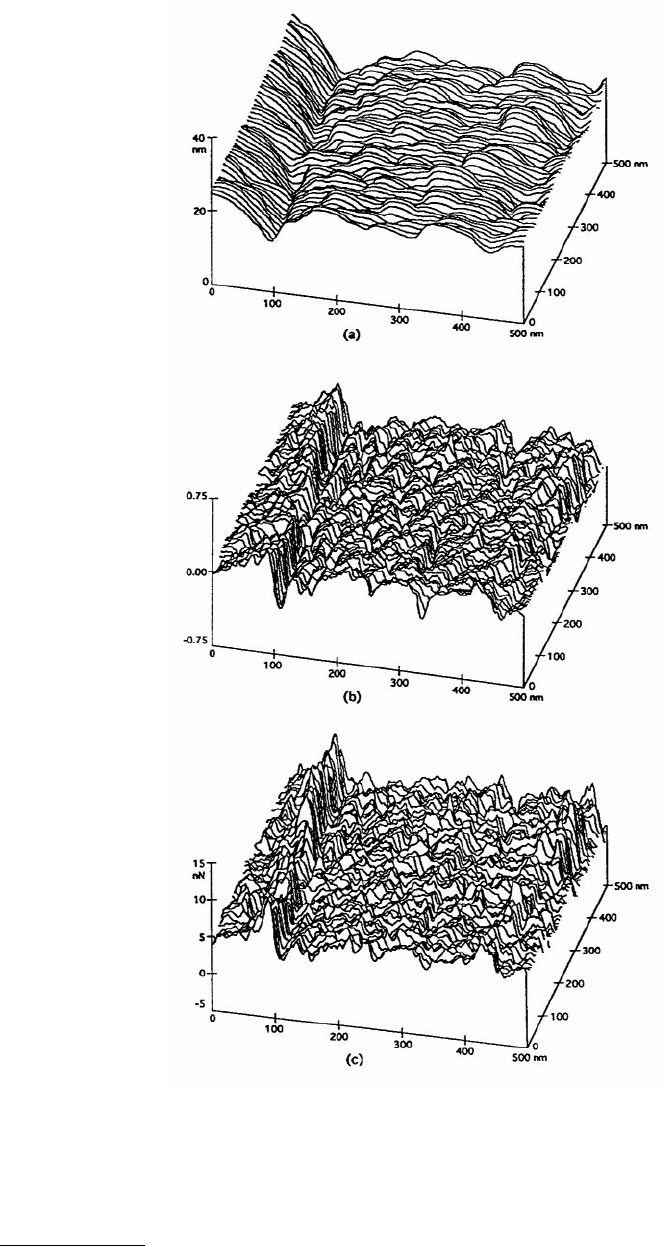
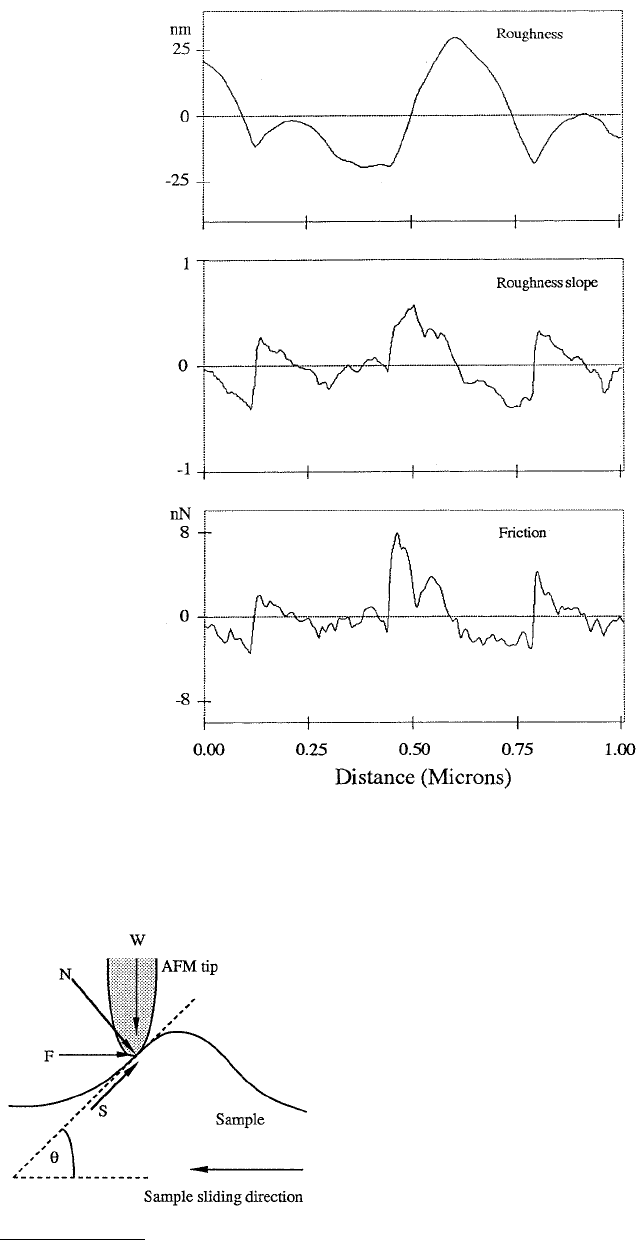
FIGURE 14.12 (a) Surface roughness map (σ = 4.4 nm), (b) slope of the roughness profiles taken in the sample
sliding direction (the horizontal axis) (mean = 0.023, σ = 0.197), and (c) friction force map (mean = 6.2 nN, σ =
2.1 nN) for a textured and lubricated thin-film rigid disk for a normal load of 160 nN. (From Bhushan, B. and Ruan,
J., 1994, ASME J. Tribol. 116, 389–396. With permission.)
© 1999 by CRC Press LLC
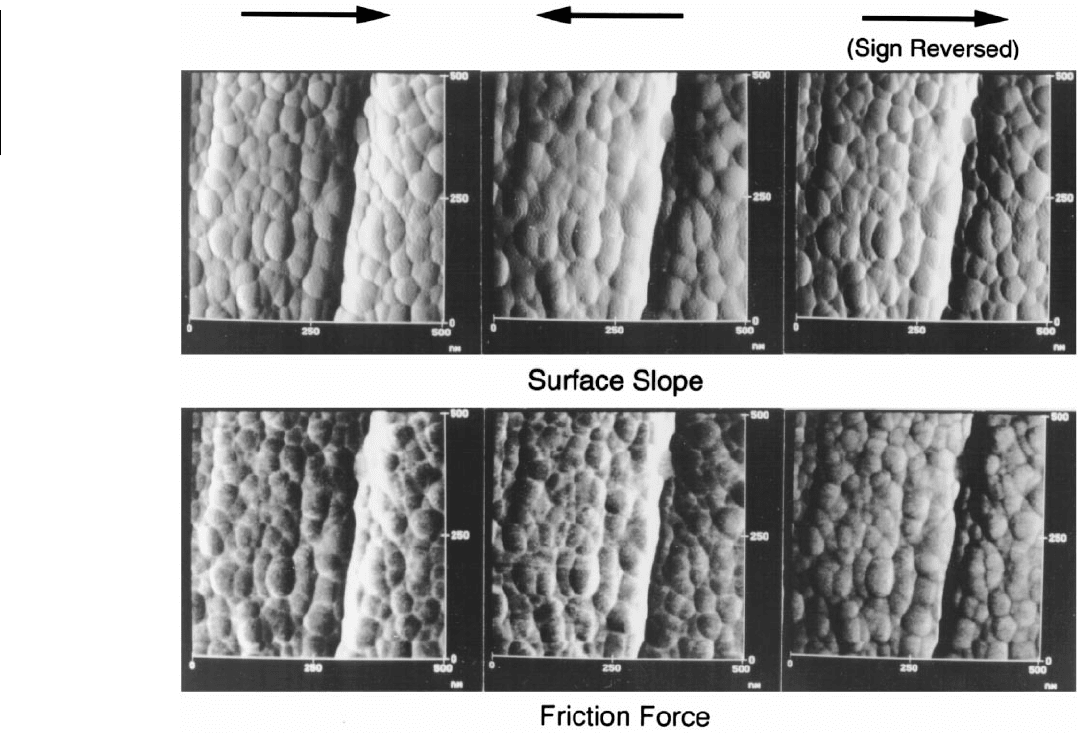
FIGURE 14.13 Gray-scale plots of the slope of the surface roughness and the friction force maps for a textured and lubricated thin-
film rigid disk. Arrows indicate the tip sliding direction. Higher points are shown by lighter color.
© 1999 by CRC Press LLC
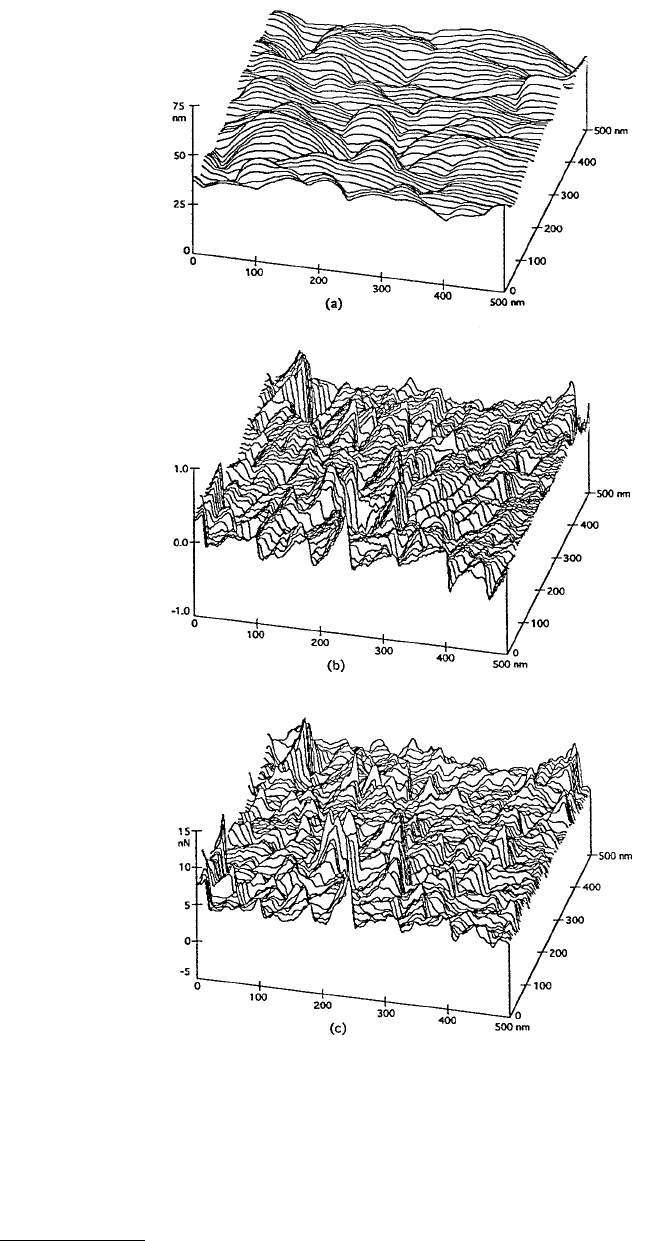
FIGURE 14.14 (a) Surface roughness map (σ = 7.9 nm), (b) slope of the roughness profiles taken along the sample
sliding direction (mean = –0.006, σ = 0.300), and friction force map (mean = 5.5 nN, σ = 2.2 nN) of an MP tape
at a normal load of 70 nN. (From Bhushan, B. and Ruan, J., 1994, ASME J. Tribol. 116, 389–396. With permission.)
© 1999 by CRC Press LLC
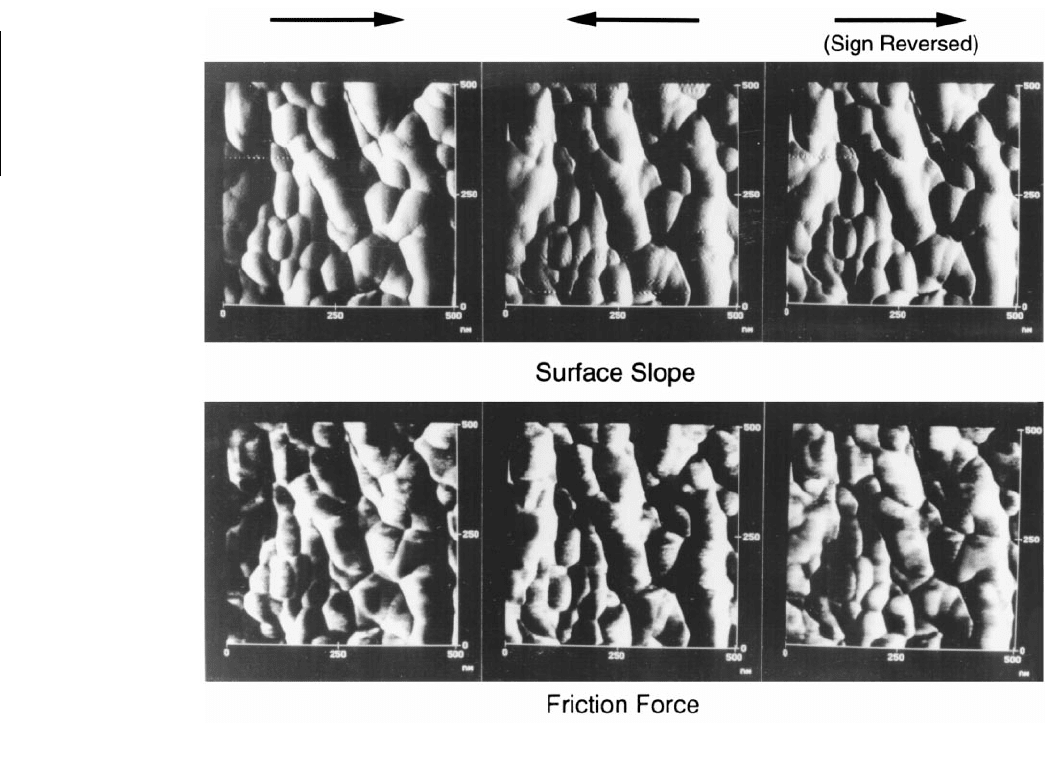
FIGURE 14.15 Gray-scale plots of the slope of the roughness and the friction force maps for an MP tape. Arrows indicate the tip sliding
direction. Higher points are shown by lighter color.
© 1999 by CRC Press LLC
FIGURE 14.16 Surface roughness map (σ = 15.4 nm), slope of the roughness map (mean = –0.052, σ = 0.224),
and the friction force map (σ = 2.1 nN) of a polished natural (IIa) diamond crystal. (From Bhushan, B. and Ruan,
J., 1994, ASME J. Tribol. 116, 389–396. With permission.)
FIGURE 14.17 Schematic illustration showing the effect of an
asperity (making an angle θ with the horizontal plane) on the
surface in contact with the tip on local friction in the presence of
“adhesive” friction mechanism. W and F are the normal and fric-
tion forces, respectively. S and N are the force components along
and perpendicular to the local surface of the sample at the contact
point, respectively.

© 1999 by CRC Press LLC
(14.5)
if µ
0
tan θ is small. For a symmetrical asperity, the average coefficient of friction experienced by the FFM
tip traveling across the whole asperity is
(14.6)
if µ
0
tan θ is small.
The plowing component of friction (Bowden and Tabor, 1950) with tip sliding in either direction is
(14.7)
Since in the FFM measurements, we notice little damage of the sample surface, the contribution by
plowing is expected to be small and the ratchet mechanism is believed to be the dominant mechanism
for the local variations in the friction force profile. With the tip sliding over the leading (ascending) edge
of an asperity, the slope is positive; it is negative during sliding over the trailing (descending) edge of the
asperity. Thus, friction is high at the leading edge of asperities and low at the trailing edge. The ratchet
mechanism thus explains the correlation between the slopes of the roughness profiles and friction profiles
observed in Figures 14.11 to 14.16. We note that in the ratchet mechanism, the FFM tip is assumed to
be small compared to the size of asperities. This is valid since the typical radius of curvature of the tips
is about 30 nm. The radius of curvature of the asperities of the samples measured here (the asperities
that produce most of the friction variation) is found to be typically about 100 to 200 nm, which is larger
than that of the FFM tip (Bhushan and Blackman, 1991).
We also note that the variation in attractive adhesive force (W
att
) with topography can also contribute
to observed variation in friction (Mate, 1993a,b). The total force in the normal direction is the intrinsic
force (W
att
) in addition to the applied normal load (W). Thus, friction force
where µ is the coefficient of friction. Based on Mate (1993a), major components of the attractive adhesive
force are the van der Waals force (between the tip and the summits and valleys of the mating sample
surface) and meniscus or capillary forces. Approximating the tip–sample surface geometry as a sphere
on a flat, the magnitude of the attractive van der Waals force can be expressed as (Derjaguin et al., 1987)
(14.8a)
and
(14.8b)
µ=µ−
()
+µ
()
µ−
20 0
0
1tan tan
~ tan ,
θθ
θ
µ=µ+µ
()
=µ +
()
−µ
()
µ+
()
ave 1 2
0
2
0
22
0
2
2
11
1
tan tan
~ tan ,
θθ
θ
µ
p
~ tan .θ
FWW=µ +
()
att
,
W
AR
D
vdW
=
6
2
AD
td
=π
()
24
0
2
12
γγ ,

© 1999 by CRC Press LLC
where A is the Hamaker constant, R is the tip radius, D is the separation distance by the surface roughness
of the means of the tip and the sample surfaces, γ
t
and γ
d
are the surface energies of the tip and sample
surfaces, and D
0
~ 0.2 nm (Israelachvili, 1992). As a consequence of the strong 1/D
2
dependence, the tip
should experience a much weaker van der Waals force on the top of a summit as compared with that of
a valley. Mate (1993a) reported that a separation change ∆D of 5 nm would give a variation in the van
der Waals force by a factor of 5 if the distance of closest approach, approximately the amount of roughness
separation between the two surfaces, is 4 nm. Another component of the attractive adhesive force in the
presence of liquid film is the meniscus force. The meniscus force for a sphere on a flat in the presence
of liquid is
(14.9)
where γ
l
is the surface tension of the liquid. Meniscus force is generally much stronger than the van der
Waals force. Thus, the contribution of adhesion mechanism to the friction force variation is relatively
small for samples used in this study. Furthermore, the correlation between the surface and friction force
profiles is poor; therefore, an adhesion mechanism cannot explain the topography effects. The ratchet
mechanism already quantitatively explains the variation of friction.
Since the local friction force is a function of the local slope of sample surface, the local friction force
should be different as the scanning direction of the sample is reversed. Figures 14.13 and 14.15 show the
gray-scale plots of slope of roughness profiles and friction force profiles for a lubricated textured disk
and an MP tape, respectively. The left side of the figures corresponds to the tip sliding from the left
toward the right (or the sample sliding from the right to the left). We again note a general correspondence
between the surface roughness slope and the friction profiles. The middle figures in Figures 14.13 and
14.15 correspond to the tip sliding from the right toward left. We note that generally the points that have
high friction force and high slope in the left-to-right scan have low friction and low slope as the sliding
direction is reversed (Meyer and Amer, 1990; Grafstrom et al., 1993; Overney and Meyer, 1993; Bhushan
and Ruan, 1994e; Ruan and Bhushan, 1994b). This results from the slope being of opposite sign as the
direction is reversed, which reverses the sign of friction force contribution by the ratchet mechanism.
This relationship is not true at all locations. The right-side figures in Figures 14.13 and 14.15 correspond
to the left-hand set with sign reversed. On the right, although the sign of friction force profile is the
reverse of the left-hand profile, some differences in the right two friction force profiles are observed
which may result from the asymmetrical asperities and/or asymmetrical transfer of wipe material during
manufacturing of the disk. This directionality in microscale friction force was first reported by Bhushan
et al. (1994a,c,e, 1995a–d, 1997a, 1998).
If asperities in a sample surface have a preferential orientation, this directionality effect will be man-
ifested in macroscopic friction data; that is, the coefficient of friction may be different in one sliding
direction from that in the other direction. Such a phenomenon has been observed in rubbing wool fiber
against horn. It was found that the coefficient of friction is greatest when the wool fiber is rubbed toward
its tip (Mercer, 1945; Lipson and Mercer, 1946; Thomson and Speakman, 1946). Makinson (1948)
explained the directionality in the friction by the “ratchet” effect. Here, the ratchet effect is the result of
large angle θ, where instead of true sliding, rupture or deformation of the fine scales of wool fibers occurs
in one sliding direction. We note that the frictional directionality can also exist in materials with particles
having a preferred orientation.
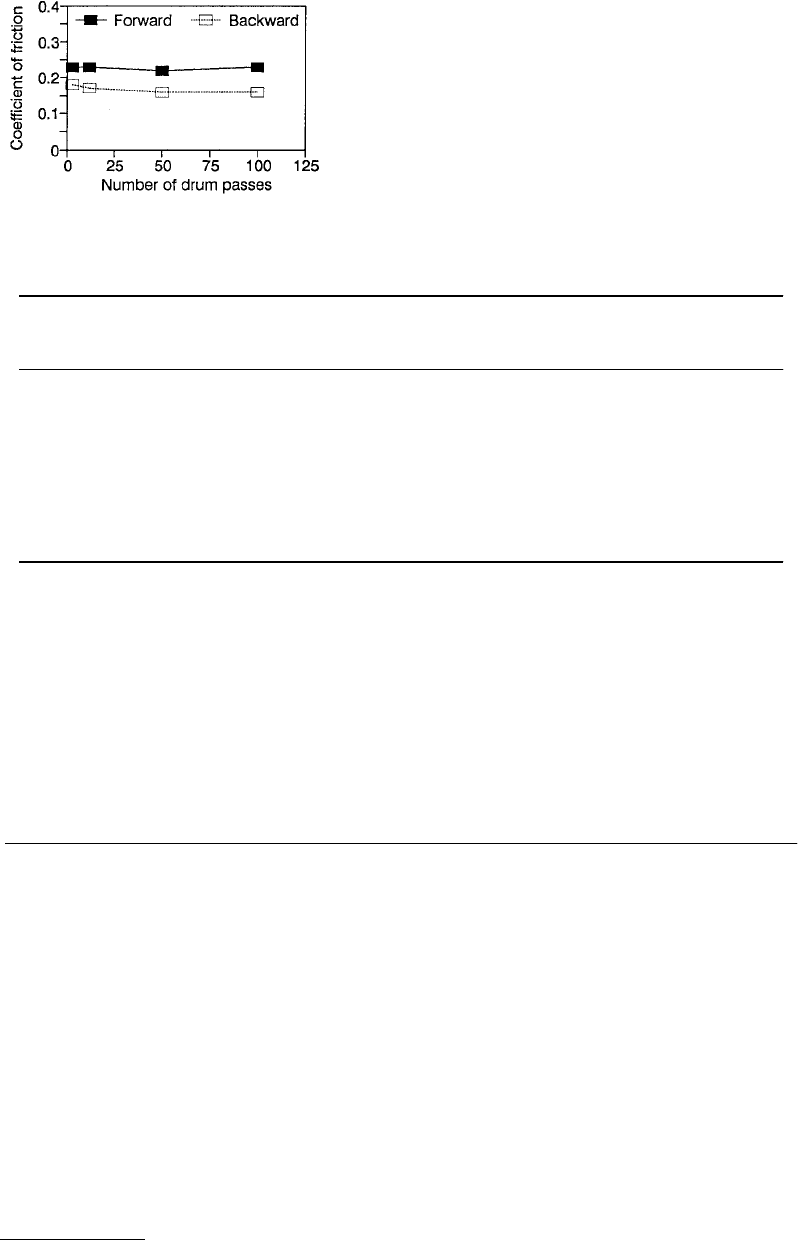
The directionality effect in friction on a macroscale is also observed in some magnetic tapes. In a
macroscale test, a 12.7-mm-wide MP tape was wrapped over an aluminum drum and slid in a recipro-
cating motion with a normal load of 0.5 N and a sliding speed of about 60 mm/s. The coefficient of
friction as a function of sliding distance in either direction is shown in Figure 14.18. We note that the
coefficient of friction on a macroscale for this tape is different in different directions.
WR
M
=π4 γ
l
,
© 1999 by CRC Press LLC
14.4.2.3 Silicon
Coefficient of microscale friction data for virgin, treated, and coated Si(111) samples are presented in
Table 14.5 (Bhushan et al., 1994a). (Also see Bhushan et al., 1993c, 1997a,b; Sundararajan and Bhushan,
1998.) We note that crystalline orientation of silicon has little effect on the coefficient of friction. PECVD
oxide-coated Si(111) exhibits a coefficient of friction value lower than that of any other silicon sample.
14.5 Scratching and Wear
14.5.1 Nanoscale Wear
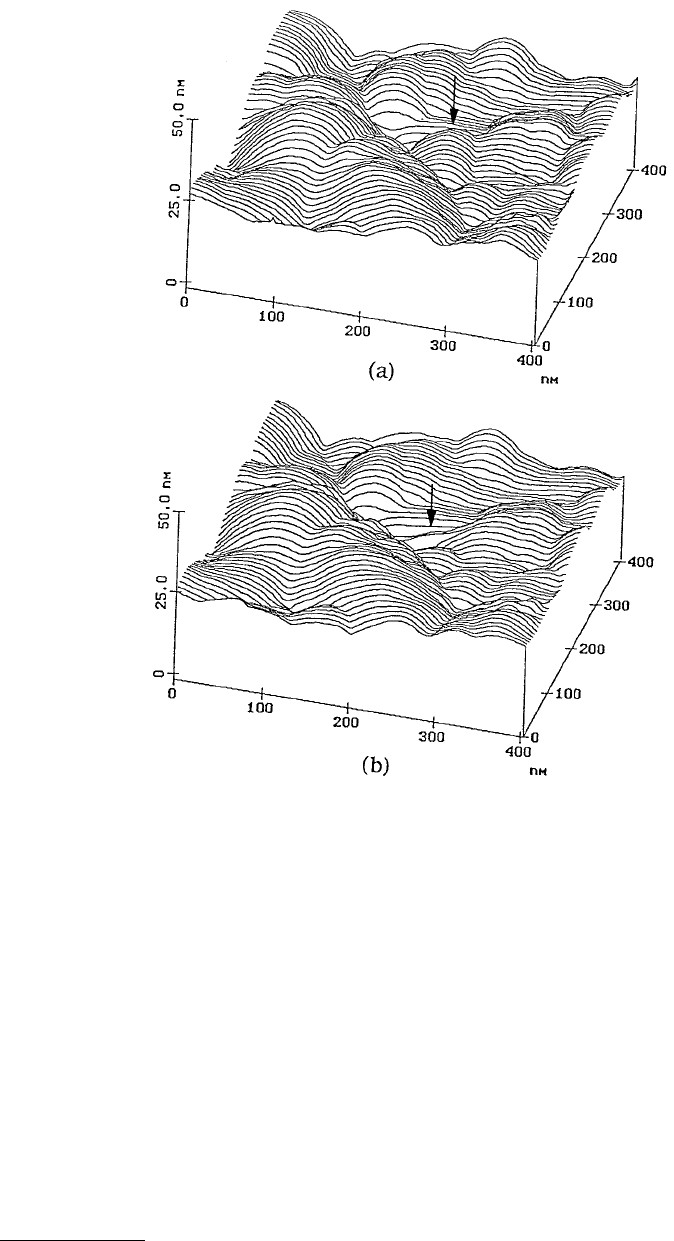
Bhushan and Ruan (1994e) conducted nanoscale wear tests on MP tapes at a normal load of 100 nN.
Figure 14.19 shows the topography of the MP tape obtained at two different loads. For a given normal
load, measurements were made twice. There was no discernible difference between consecutive measure-
ments for a given normal load. However, as the load increased from 10 to 100 nN, topographical changes
were observed; material (indicated by an arrow) was pushed toward the right side in the sliding direction
of the AFM tip relative to the sample. The material movement is believed to occur as a result of plastic
deformation of the tape surface. Similar behavior was observed on all tapes. Magnetic tape coating is
made of magnetic particles and polymeric binder. Any movement of the coating material can eventually
lead to loose debris. Debris formation is an undesirable situation as it may contaminate the head, which
may increase friction and/or wear between the head and tape, in addition to the deterioration of the tape
itself. With disks, they did not notice any deformation under a 100 nN normal load.
FIGURE 14.18 Coefficient of macroscale friction as a function
of sliding cycles for an MP tape sliding over an aluminum drum
in a reciprocating mode in both directions. Normal load = 0.5 N
over 12.7-mm-wide tape, sliding speed = 60 mm/s.
TABLE 14.5 Roughness (σ), Microfriction, Microscratching/Microwear, and Nanoindentation Hardness Data
for Various Virgin, Coated, and Treated Silicon Samples
Material
σ (nm)
500 × 500 nm
a
Coefficient
of Friction
Scratch Depth at
40 µN
(nm)
Wear Depth at
40 µN
(nm)
Hardness at
100 µN
(GPa)
Si(111) 0.11 0.03 20 27 11.7
Si(110) 0.09 0.04 20 — —
Si(100) 0.12 0.03 25 — —
Polysilicon 1.07 0.04 18 — —
Polysilicon (lapped) 0.16 0.05 18 25 12.5
PECVD oxide-coated Si(111) 1.50 0.01 8 5 18.0
Dry-oxidized Si(111) 0.11 0.04 16 14 17.0
Wet-oxidized Si(111) 0.25 0.04 17 18 14.4
C
+
-implanted Si(111) 0.33 0.02 20 23 18.6
a
Scan area.
From Bhushan, B. and Koinkar, V.N., 1994, J. Appl. Phys. 75, 5741–5746. With permission.
© 1999 by CRC Press LLC
14.5.2 Microscale Scratching
Microscratches have been made on various potential head slider materials (Al
2
O
3
, Al
2
O
3
–TiC, Mn–Zn
ferrite, and SiC), various magnetic media (unlubricated polished thin-film disk, MP, BaFe, ME tapes,
PET substrates) and virgin, treated, and coated Si(111) wafers at various loads (Miyamoto et al., 1991c,
1993; Bhushan et al., 1994a,c,d, 1995a–e, 1997a, 1998; Koinkar and Bhushan, 1996a, 1997b; Sundararajan
and Bhushan, 1998). As mentioned earlier, the scratches are made using a diamond tip.
14.5.2.1 Head Slider Materials
Scratch depths as a function of load and representative scratch profiles with corresponding two-dimen-
sional gray scale plots at various loads after a single pass (unidirectional scratching) for Al
2
O
3
, Al
2
O
3
–TiC,
polycrystalline and single-crystal Mn–Zn ferrite and SiC are shown in Figures 14.20 and 14.21, respec-
tively. Variation in the scratch depth along the scratch is about ±15%. The Al
2
O
3
surface could be scratched
FIGURE 14.19 Surface roughness maps of an MP tape at applied normal load of (a) 10 nN and (b) 100 nN. Location
of the change in surface topography as a result of nanowear is indicated by arrows. (From Bhushan, B. and Ruan,
J., 1994, ASME J. Tribol. 116, 389–396. With permission.)
© 1999 by CRC Press LLC
at a normal load of 40 µN. The surface topography of polycrystalline Al
2
O
3
shows the presence of porous
holes on the surface. The two-dimensional gray scale plot of the scratched Al
2
O
3
surface shows one porous
hole between scratches made at normal loads of 40 and 60 µN. Regions with defects or porous holes
present, exhibit lower scratch resistance (see region marked by the arrow on two-dimensional gray-scale
plot of Al
2
O
3
). The Al
2
O
3
–TiC surface could be scratched at a normal load of 20 µN. The scratch resistance
for TiC grains is higher than that of Al
2
O
3
grains. The scratches generated at normal loads of 80 and
100 µN show that the scratch depth of Al
2
O
3
grains is higher than that of TiC grains (see corresponding
gray-scale plot for Al
2
O
3
–TiC). Polycrystalline and single-crystal Mn–Zn ferrite could be scratched at a
normal load of 20 µN. The scratch width is much larger for the ferrite specimens as compared with other
specimens. For SiC there is no measurable scratch observed at a normal load of 20 µN. At higher normal
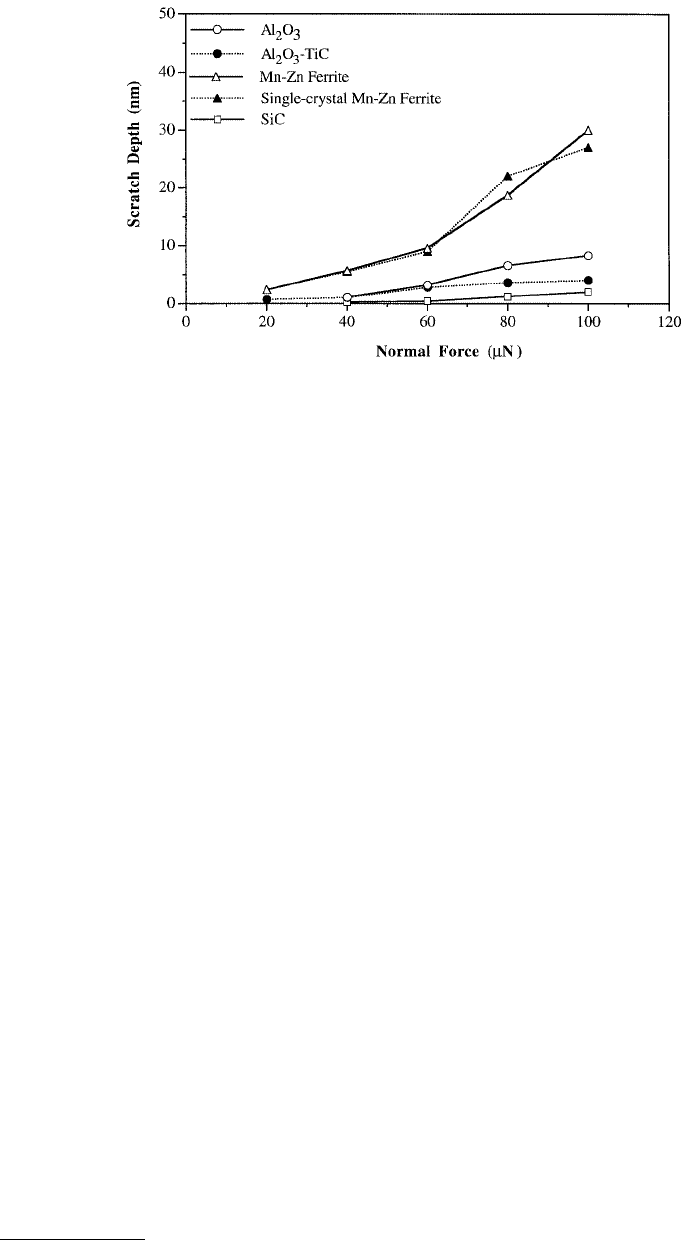
loads very shallow scratches are produced. Table 14.2 presents average scratch depth at 60 µN normal
load for all specimens. SiC has the highest scratch resistance followed by Al
2
O
3
–TiC, Al
2
O
3
, and poly-
crystalline and single-crystal Mn–Zn ferrite. Polycrystalline and single-crystal Mn–Zn ferrite specimens
exhibit comparable scratch resistance.
14.5.2.2 Magnetic Media
Scratch depths as a function of load and scratch profiles at various loads after ten scratch cycles for
unlubricated, polished disk, and MP tape are shown in Figures 14.22 and 14.23, respectively. We note
that scratch depth increases with an increase in the normal load. Tape could be scratched at about 100 nN.
With disk, gentle scratch marks under 10 µN load were barely visible. It is possible that material removal
did occur at lower load on an atomic scale which was not observable with a scan size of 5 µm square.
For disk, scratch depth at 40 µN is less than 10 nm deep. The scratch depth increased slightly at the load
of 50 µN. Once the load is increased in excess of 60 µN, the scratch depth increased rapidly. Bhushan
et al. (1994c) believed that the DLC coating cracked at about 60 µN. These data suggest that the carbon
coating on the disk surface is much harder to scratch than the underlying thin-film magnetic film. This
is expected since the carbon coating is harder than the magnetic material used in the construction of the
disks.
Since tapes scratch readily, for comparisons in scratch resistance of various tapes, Bhushan et al. (1995c)
made scratches on three tapes with one cycle. Figure 14.24 presents the scratch depths as a function of
normal load after one cycle for three tapes — MP, BaFe, and ME tapes. For the MP and BaFe particulate
tapes, Bhushan et al. (1995c) noted that the scratch depth along (parallel) and across (perpendicular)
FIGURE 14.20 Scratch depth as a function of normal load after one unidirectional cycle for Al
2
O
3
, Al
2
O
3
–TiC,
polycrystalline Mn–Zn ferrite, single-crystal Mn–Zn ferrite, and SiC. (From Koinkar, V.N. and Bhushan, B., 1996,
Wear 202, 110–122. With permission.)