Bhushan B. Handbook of Micro/Nano Tribology, Second Edition
Подождите немного. Документ загружается.

© 1999 by CRC Press LLC

© 1999 by CRC Press LLC
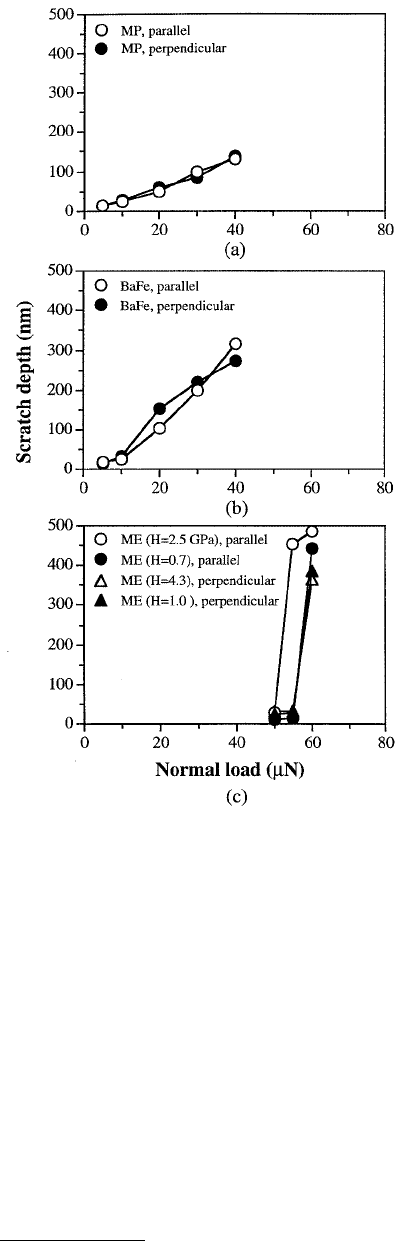
the longitudinal direction of the tapes is similar. Between the two tapes, MP tape appears to be more
scratch resistant than BaFe tape, which depends on the binder, pigment volume concentration (PVC),
and the head-cleaning agent (HCA) contents. ME tapes appear to be much more scratch resistant than
the particulate tapes. However, the ME tape breaks up catastrophically in a brittle mode at a normal load
higher than the 50 µN (Figure 14.25), as compared to particulate tapes in which the scratch rate is
constant. They reported that the hardness of ME tapes is higher than that of particulate tapes; however,
a significant difference in the nanoindentation hardness values of the ME film from region to region
(Table 14.4) was observed. They systematically measured scratch resistance in the high- and low-hardness
regions along and across the longitudinal directions. Along the parallel direction, load required to crack
the coating was lower (implying lower scratch resistance) for a harder region, than that for a softer region.
The scratch resistance of the high-hardness region along the parallel direction is slightly poorer than that
for along perpendicular direction. Scratch widths in both low- and high-hardness regions is about half
(~2 µm) than that in perpendicular direction (~1 µm). In the parallel direction, the material is removed
in the form of chips and lateral cracking also emanates from the wear zone. ME films have columnar
structure with the columns lined up with an oblique angle on the order of about 35° with respect to the
normal to the coating surface (Bhushan, 1992; Hibst, 1993). The column orientation may be responsible
for the directionality effect on the scratch resistance. Hibst (1993) have reported the directionality effect
in the ME tape–head wear studies. They have found that the wear rate is lower when the head moves in
the direction corresponding to the column orientation than in the opposite direction.
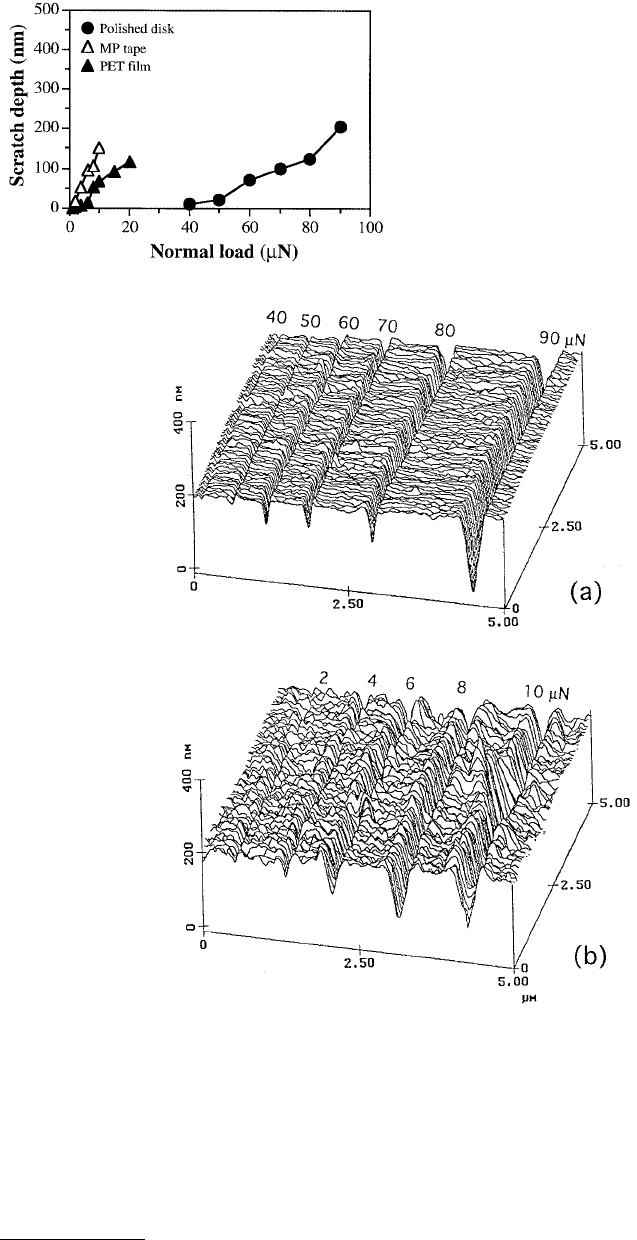
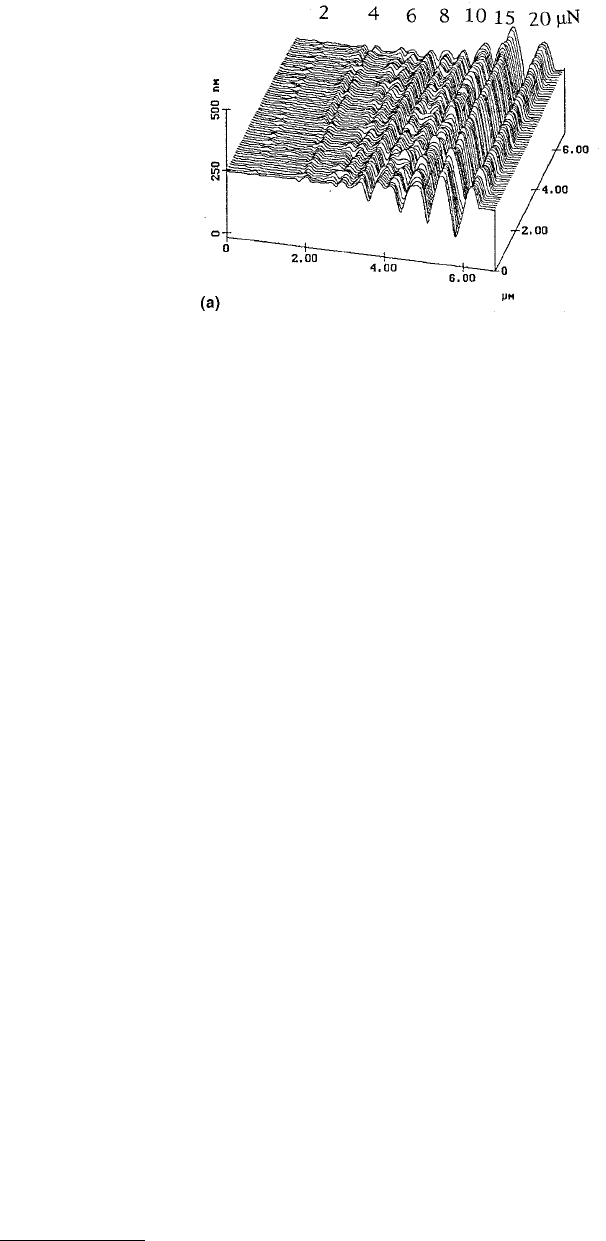
PET films could be scratched at loads of as low as about 2 µN, Figure 14.22. Figure 14.26a shows
scratch marks made at various loads. Scratch depth along the scratch does not appear to be uniform.
This may occur because of variations in the mechanical properties of the film. Bhushan et al. (1995a)
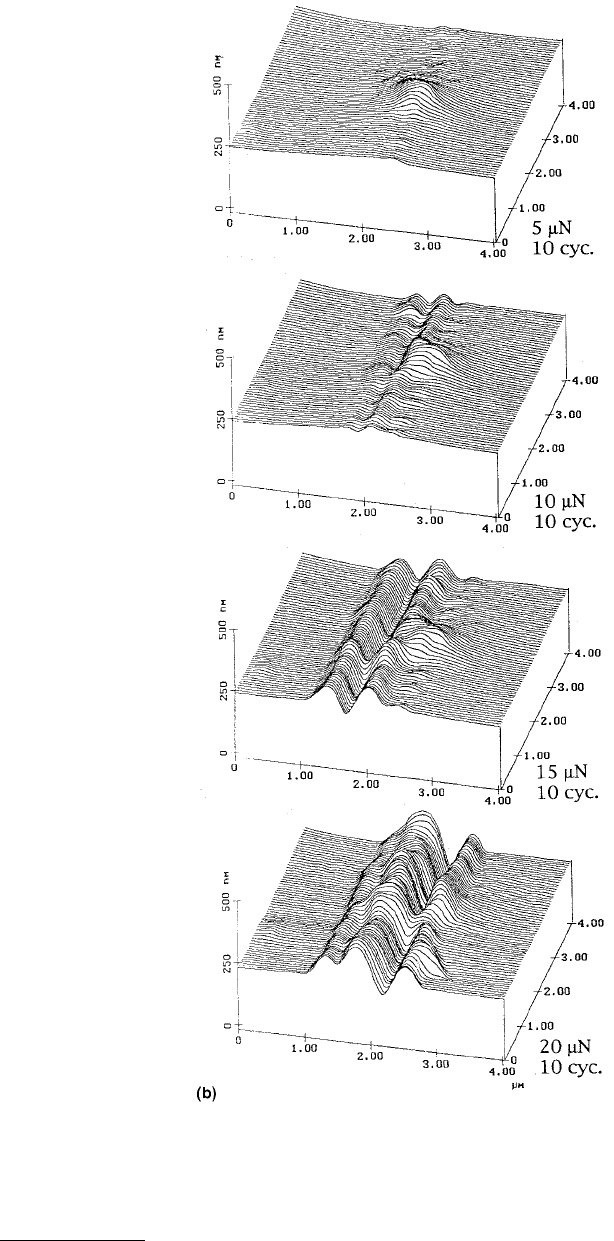
also conducted scratch studies in the selected particulate regions. Scratch profiles at increasing loads in
the particulate region are shown in Figure 14.26b. We note that the bump (particle) is barely scratched
at 5 µN, and it can be scratched readily at higher loads. At 20 µN, it essentially disappears.
14.5.2.3 Silicon
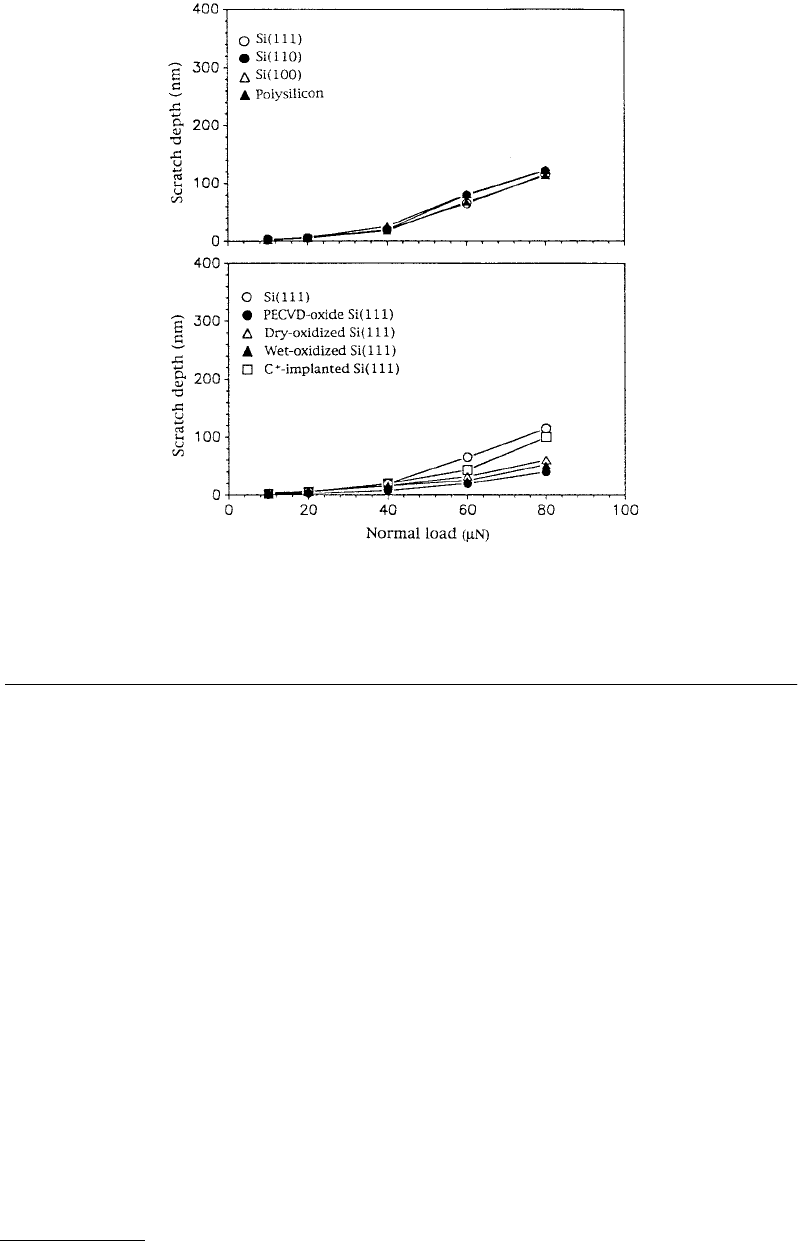
A summary of microscratching data for various silicon samples is presented in Table 14.5. Virgin and
modified silicon surfaces could be scratched at 10 µN load, see Figures 14.27 and 14.28 and Table 14.5
(Bhushan et al., 1994a). (Also see Bhushan et al., 1993c; 1997a–b; Sundararajan and Bhushan, 1998.)
Scratch depth increased with an increase in load. We note that crystalline orientation of silicon has little
influence on the scratch depth. Virgin silicon is poor in scratch resistance as compared with treated
samples; PECVD oxide samples had the largest scratch resistance followed by dry-oxidized, wet-oxidized,
and ion-implanted samples. Ion implantation showed no improvements on the scratch resistance.
14.5.3 Microscale Wear
By scanning the sample (in two dimensions) while scratching, wear scars are generated on the sample
surface (Bhushan et al., 1994a,c,d, 1995a–e, 1997a, 1998; Koinkar and Bhushan,1996a, 1997b; Sundarara-
jan and Bhushan, 1998). The major benefit of a single-cycle wear test over a scratch test is that scratch/wear
data can be obtained over a large area.
14.5.3.1 Head Slider Materials
Figure 14.29 shows the wear depth as a function of load for one cycle for different slider materials.
Variation in the wear depth in the wear mark is dependent upon the material. It is generally within ±5%.
The mean wear depth increases with the increase in normal load. The representative surface profiles
showing the wear marks (central 2 × 2 µm region) at a normal load of 60 µN for all specimens are shown
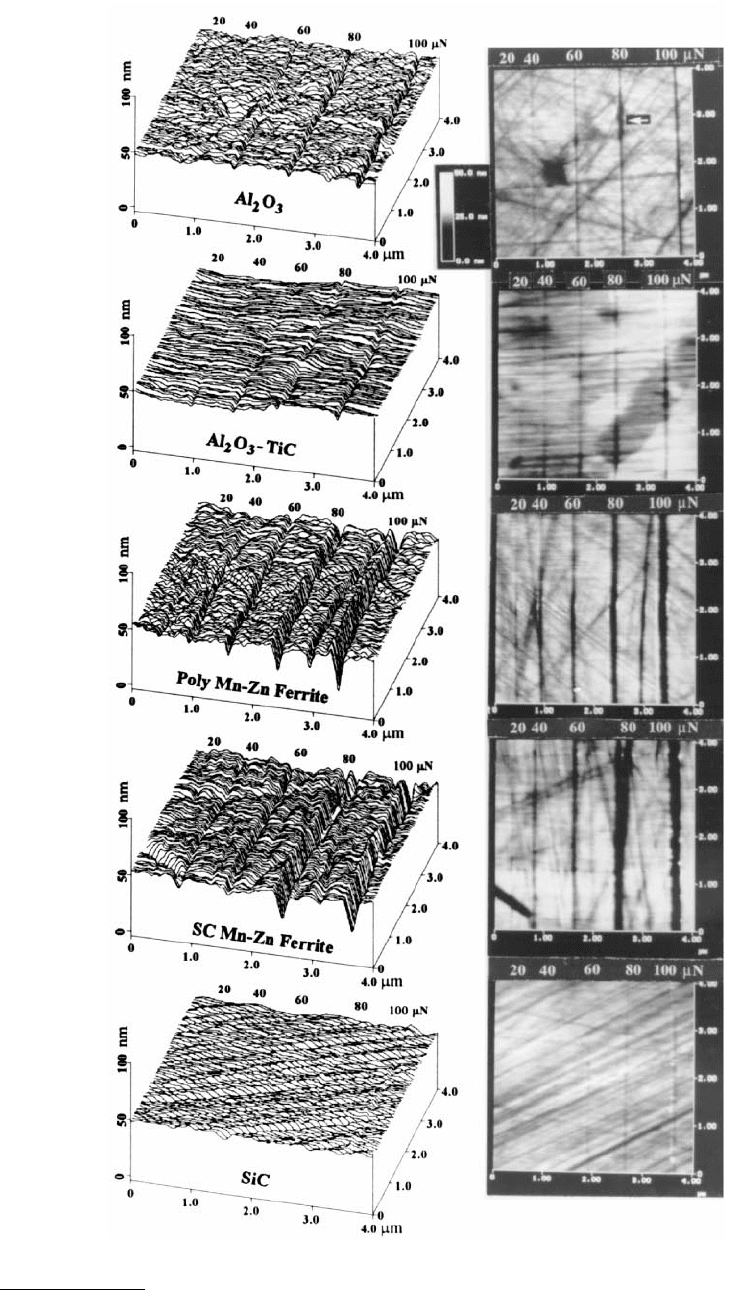
FIGURE 14.21 Surface profiles (left column) and two-dimensional gray-scale plots (right column) of scratched
Al
2
O
3
, Al
2
O
3
–TiC, polycrystalline Mn–Zn ferrite, single-crystal Mn–Zn ferrite, and SiC surfaces. Normal loads used
for scratching for one unidirectional cycle are listed in the figure. (From Koinkar, V.N. and Bhushan, B., 1996, Wear
202, 110–122. With permission.)
© 1999 by CRC Press LLC
in Figure 14.30. The material is removed uniformly in the wear region for all specimens. Table 14.2
presents average wear depth at 60 µN normal load for all specimens. Microwear resistance of SiC and
Al
2
O
3
is the highest followed by Al
2
O
3
–TiC, single-crystal, and polycrystalline Mn–Zn ferrite.
FIGURE 14.22 Scratch depth as a function of normal
load after ten scratch cycles for an unlubricated polished
thin-film rigid disk, MP tape, and PET film.
FIGURE 14.23 Surface profiles for scratched (a) unlubricated polished thin-film rigid disk and (b) MP tape. Normal
loads used for scratching for ten cycles are listed in the figure. (From Bhushan, B. et al., 1994, Proc. Inst. Mech. Eng.
Part J: J. Eng. Tribol. 208, 17–29. With permission.)
© 1999 by CRC Press LLC
Next, wear experiments were conducted for multiple cycles. Figure 14.31 shows the two-dimensional
gray-scale plots and corresponding section plot (on top of each gray-scale plot), taken at a location shown
by an arrow for Al
2
O
3
(left column) and Al
2
O
3
–TiC (right column) specimen obtained at a normal load
of 20 µN and at a different number of scan cycles. The central regions (2 × 2 µm) show the wear mark
generated after a different number of cycles. Note the difference in the vertical scale of the gray scale and
section plots. The Al
2
O
3
specimen shows that wear initiates at the porous holes or defects present on the
surface. Wear progresses at these locations as a function of number of cycles. In the porous hole free
region, microwear resistance is higher. In the case of the Al
2
O
3
–TiC specimen for about five scan cycles,
the microwear resistance is higher at the TiC grains and is lower at the Al
2
O
3
grains. The TiC grains are
removed from the wear mark after five scan cycles. This indicates that microwear resistance of multiphase
materials depends upon the individual grain properties. Evolution of wear is uniform within the wear
mark for ferrite specimens. Figure 14.32 shows a plot of wear depth as a function of number of cycles
at a normal load of 20 µN for all specimens. The Al
2
O
3
specimen then reveals highest microwear resistance
followed by SiC, Al
2
O
3
–TiC, polycrystalline and single crystal Mn–Zn ferrite. Wear resistance of Al
2
O
3
–TiC
is inferior to that of Al
2
O
3
. Chu et al. (1992) studied friction and wear behavior of the single-phase and
FIGURE 14.24 Scratch depth as a function of nor-
mal load after one scratch cycle for (a) MP, (b) BaFe,
and (c) ME tapes along parallel and perpendicular
directions with respect to the longitudinal axis of the
tape. (From Bhushan, B. and Koinkar, V.N., 1995,
Wear 180, 9–16. With permission.)
© 1999 by CRC Press LLC
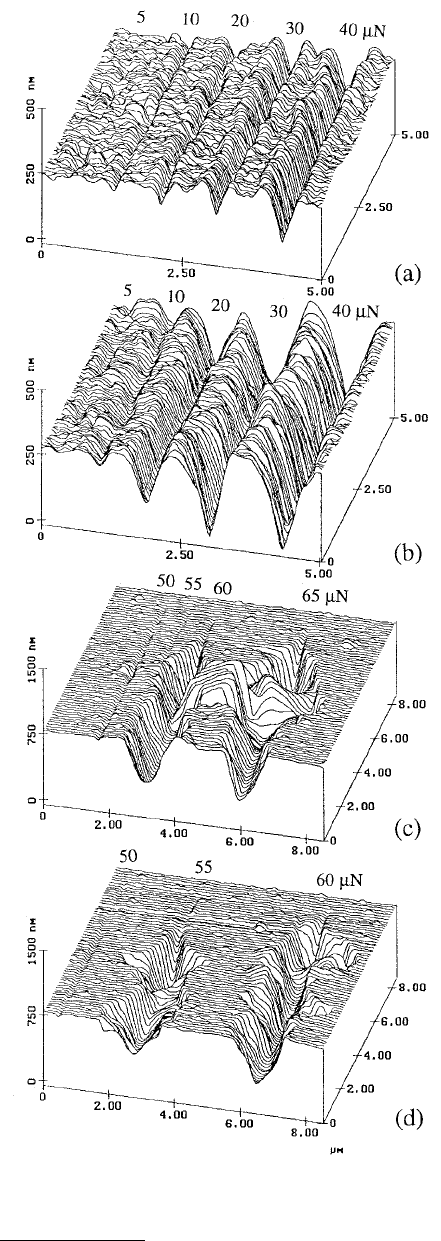
FIGURE 14.25 Surface maps for scratched
(a) MP, (b) BaFe, (c) ME (H = 0.7 GPa), and
(d) ME (H = 2.5 GPa) tapes along parallel
direction. Normal loads used for scratching for
one cycle are listed in the figure. (From Bhus-
han, B. and Koinkar, V.N., 1995, Wear 180,
9–16. With permission.)

© 1999 by CRC Press LLC
multiphase ceramic materials and found that wear resistance of multi-phase materials was poorer than
single-phase materials. Multiphase materials have more material flaws than the single-phase material.
The differences in thermal and mechanical properties between the two phases may lead to cracking during
processing, machining, or use.
14.5.3.2 Magnetic Media
Figure 14.33 shows the wear depth as a function of load for one cycle for the polished, unlubricated, and
lubricated disks (Bhushan et al., 1994c). Figure 14.34 shows profiles of the wear scars generated on
unlubricated disk. The normal force for the imaging was about 0.5 µN and the loads used for the wear
were 20, 50, 80, and 100 µN as indicated in the figure. We note that wear takes place relatively uniformly
across the disk surface and essentially independent of the lubrication for the disks studied. For both
lubricated and unlubricated disks, the wear depth increases slowly with load at low loads with almost
the same wear rate. As the load is increased to about 60 µN, wear increases rapidly with load. The wear
depth at 50 µN is about 14 nm, slightly less than the thickness of the carbon film. The rapid increase of
wear with load at loads larger than 60 µN is an indication of the breakdown of the carbon coating on
the disk surface.
Figure 14.35 shows the wear depth as a function of number of cycles for the polished disks (lubricated
and unlubricated). Again, for both unlubricated and lubricated disks, wear initially takes place slowly
with a sudden increase between 40 and 50 cycles at 10 µN. The sudden increase occurred after 10 cycles
at 20 µN. This rapid increase is associated with the breakdown of the carbon coating. The wear profiles
at various cycles are shown in Figure 14.36 for a polished, unlubricated disk at a normal load of 20 µN.
Wear is not uniform and the wear is largely initiated at the texture grooves present on the disk surface.
This indicates that surface defects strongly affect the wear rate.
Hard amorphous carbon coating controls the wear performance of magnetic disks. A thick coating is
desirable for long durability; however, to achieve ever-increasingly high recording densities, it is necessary
to use as thin a coating as possible. Bhushan and Koinkar (1995e) studied the effect of coating thickness
of sputtered carbon on the microwear performance. The critical number of cycles (wear life) above which
wear increases rapidly increases with an increase in the carbon film thickness, Figure 14.37. Film as thin
as 5 nm does provide some wear protection. As expected, a thicker film is superior in wear protection.
The concern with films of thicknesses 5 and 10 nm is whether these ultrathin films are continuous or
deposited as islands, which is undesirable from corrosion point of view. Based on surface mapping of
coatings using Auger electron spectroscopy, they concluded that even the thinnest 5-nm-thick film is
essentially continuous with 0.2 µm spatial resolution. Koinkar and Bhushan (1997b) compared the
microtribological properties of 20-nm-thick hard amorphous carbon coatings deposited by sputtering,
ion beam, and filtered cathodic arc processes. Wear depths as a function of number of cycles for various
coatings are plotted in Figure 14.38. The data for silicon are plotted for comparison. Cathodic arc coating
exhibits highest wear resistance followed by ion beam, sputtered, and silicon. Differences in kinetic energy
of deposition species in different deposition processes affect the coating hardness and adhesion between
coating and substrate, which in turn affect tribological and mechanical properties. Hardness data of
various coatings are presented in a later section.
Wear depths as a function of normal load for MP, BaFe, and ME tapes along the parallel direction are
plotted in Figure 14.39 (Bhushan et al., 1995d). For the ME tape, there is negligible wear until the normal
load of about 50 µN; above this load the magnetic coating fails rapidly. This observation is consistent
with the scratch data. Wear depths as a function of number of cycles for MP, BaFe, and ME tapes are
shown in Figure 14.40. For the MP and BaFe particulate tapes, wear rates appear to be independent of
the particulate density. Again, as observed in the scratch testing, wear rate of BaFe tapes is higher than
that for MP tapes. ME tapes are much more wear resistant than the particulate tapes. However, the failure
of ME tapes is catastrophic as observed in scratch testing. Wear studies were performed along and across
the longitudinal tape direction in high- and low-hardness regions. At the high-hardness regions of the
ME tapes, failure occurs at lower loads. A directionality effect, again, may arise from the columnar
structure of the ME films (Bhushan, 1992; Hibst, 1993). Wear profiles at various cycles at a normal load
© 1999 by CRC Press LLC
of 2 µN for MP and at 20 µN for ME tapes are shown in Figure 14.41. For the particulate tapes, we note
that polymer gets removed before the particulates do (Figure 14.41a). Based on the wear profiles of the
ME tape shown in Figure 14.41a, we note that most wear occurs between 50 to 60 cycles which shows
the catastrophic removal of the coating. It was also observed that wear debris generated during wear test
in all cases is loose and can easily be removed from the scan area at light loads (~0.3 µN).
The average wear depth as a function of load for a PET film is shown in Figure 14.42. Again, the wear
depth increases linearly with load. Figure 14.43 shows the average wear depth as a function of number
of cycles. The observed wear rate is approximately constant. PET tape substrate consists of particles
sticking out on its surface to facilitate winding. Figure 14.44 shows the wear profiles as a function of
number of cycles at 1 µN load on the PET film in the nonparticulate and particulate regions (Bhushan
et al., 1995a). We note that polymeric materials tear in microwear tests. The particles do not wear readily
at 1 µN. Polymer around the particles is removed but the particles remain intact. Wear in the particulate
region is much smaller than that in the polymer region. We will see later that nanohardness of the
particulate region is about 1.4 GPa compared with 0.3 GPa in the nonparticulate region (Table 14.4).
14.5.3.3 Silicon
Wear data on selected Si samples are presented in Table 14.5 and the wear profiles at 40 µN of load are
shown in Figure 14.45 (Bhushan et al., 1994c). (Also see Bhushan et al., 1993c, 1997a,b; Sundararajan
and Bhushan, 1998). Virgin silicon is poor in wear resistance. It clearly needs to be treated for wear
applications. PECVD oxide samples had the largest wear resistance followed by dry-oxidized, wet-oxidized
and ion-implanted samples. Bhushan et al. (1994c) observed wear debris in the wear zone just after the
wear test which could be easily removed by scanning the worn region. It suggests that wear debris is
loose. They further studied the wear resistance of ion-implanted samples, Figure 14.46. For tests con-
ducted at various loads on Si(111) and C
+
-implanted Si(111), they found that wear resistance of implanted
sample is slightly poorer than that of virgin Si up to about 80 µN. Above 80 µN, the wear resistance of
implanted Si improves. As they continued to run tests at 40 µN for a larger number of cycles, an implanted
sample exhibits higher wear resistance than an unimplanted sample. Miyamoto et al. (1993) have also
reported that damage from the implantation in the top layer results in poorer wear resistance; however,
an implanted zone at the subsurface is more wear resistant than the virgin Si.
FIGURE 14.26 Surface profiles for scratched PET film (a) polymer region, (b) ceramic particulate region. The loads
used for various scratches at ten cycles are indicated in the plots. (From Bhushan, B. and Koinkar, V.N., 1995, Tribol.
Trans. 38, 119–127. With permission.)
© 1999 by CRC Press LLC
FIGURE 14.26
© 1999 by CRC Press LLC
14.6 Indentation
14.6.1 Picoscale Indentation
Bhushan and Ruan (1994a) measured indentability of magnetic tapes at increasing loads on a picoscale,
Figure 14.47. In this figure, the vertical axis represents the cantilever tip deflection and the horizontal
axis represents the vertical position (Z) of the sample. The “extending” and “retracting” curves correspond
to the sample being moved toward or away from the cantilever tip, respectively. In this experiment, as
the sample surface approaches the AFM tip a fraction of a nm away from the sample (point A), the
cantilever bends toward the sample (part B) because of attractive forces between the tip and sample. As
we continue the forward position of the sample, it pushes the cantilever back through its original rest
position (point of zero applied load) entering the repulsive region (or loading portion) of the force curve.
As the sample is retracted, the cantilever deflection decreases. At point D in the retracting curve, the
sample is disengaged from the tip. Before the disengagement, the tip is pulled toward the sample after
the zero deflection point of the force curve (point C) because of attractive forces (van der Waals forces
and longer-range meniscus forces). A thin layer of liquid, such as liquid lubricant and condensations of
water vapor from ambient, will give rise to capillary forces that act to draw the tip toward the sample at
small separations. The horizontal shift between the loading and unloading curves results from the
hysteresis in the PZT tube.
The left portion of the curve shows the tip deflection as a function of the sample traveling distance
during sample–tip contact, which would be equal to each other for a rigid sample. However, if the tip
indents into the sample, the tip deflection would be less than the sample traveling distance, or, in other
words, the slope of the line would be less than 1. In Figure 14.47, we note that line in the left portion of
FIGURE 14.27 Scratch depth as a function of normal load after ten cycles for virgin, treated, and coated Si surfaces.
(From Bhushan, B. and Koinkar, V.N., 1994, J. Appl. Phys. 75, 5741–5746. With permission.)
© 1999 by CRC Press LLC
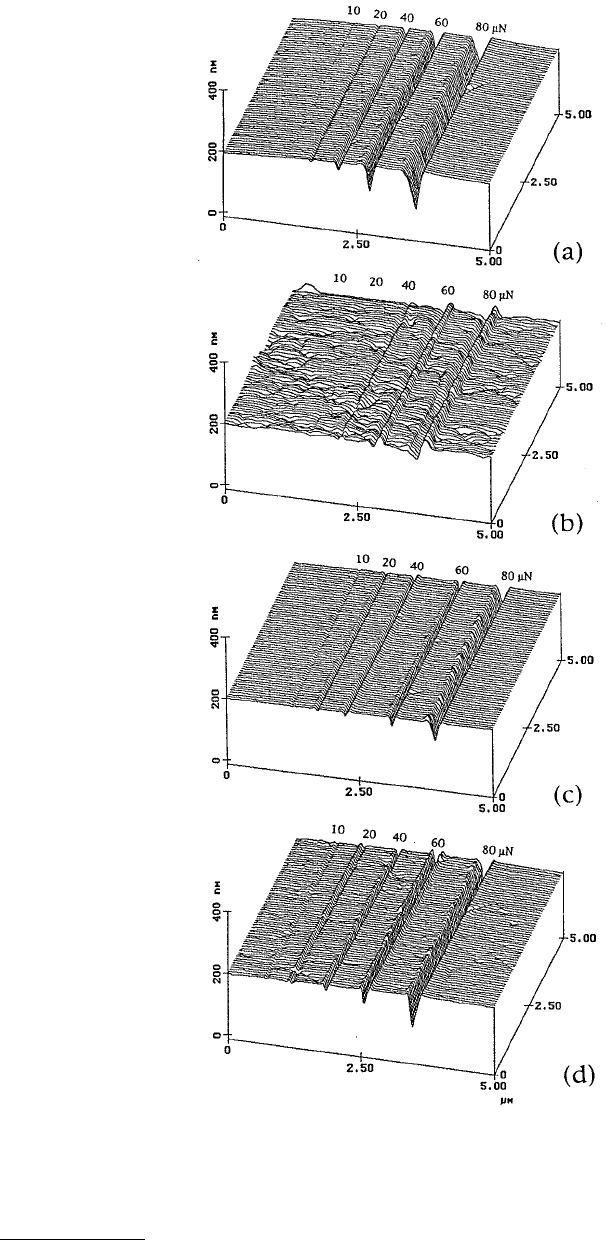
FIGURE 14.28 Surface profiles for scratched (a) Si(111), (b) PECVD oxide-coated Si(111), (c) dry-oxidized Si(111),
and (d) C
+
-implanted Si(111). Normal loads used for various scratches at ten cycles are indicated in the plot. (From
Bhushan, B. and Koinkar, V.N., 1994, J. Appl. Phys. 75, 5741–5746. With permission.)