Birge J.R., Louveaux F. Introduction to Stochastic Programming
Подождите немного. Документ загружается.

64 2 Uncertainty and Modeling Issues
production and distribution costs, the expected penalties for extra or insufficient de-
mands, and the expected revenue. This last term is constant because it is assumed
that all demands must be satisfied by either direct delivery or some other means
reflected in the penalty for unmet demand. The problem only makes sense if q
+
i
is
large enough, for example, larger than E
ξ
(v
j
+t
ij
) for all j , although weaker con-
ditions may sometimes suffice. Constraint (4.15) guarantees that distribution only
occurs from open plants, i.e., plants such that x
j
= 1 . The constant M represents
the maximum possible size of a plant.
Observethatherethevariables y
ij
are first-stage variables. Also observe that in
the second stage, the constraints (4.16), (4.17)haveaverysimpleform,as w
+
i
(
ω
)=
d
i
−
∑
n
j= 1
y
ij
if this quantity is non-negative and w
−
i
(
ω
)=
∑
n
j= 1
y
ij
−d
i
otherwise.
This is an example of a second stage with simple recourse.
Also note that in Cases a and b, the size or capacity of plant j is simply obtained
as the sum of the quantity transported from j , namely,
∑
m
i=1
d
i
y
ij
in Case a and
∑
m
i=1
y
ij
in Case b.
c. Uncertain demand, variable distribution pattern
We now consider the case where the distribution pattern can be adjusted to the real-
ization of the random event. This might be the case when uncertainty corresponds to
long-term scenarios, of which only one is realized. Then the distribution pattern can
be adapted to this particular realization. This also implies that the sizes of the plants
cannot be defined as the sum of the quantity distributed, because those quantities
depend on the random event. We thus define as before:
x
j
=
1ifplantj is open,
0otherwise.
We now let y
ij
depend on
ω
with y
ij
(
ω
)= fraction of demand d
i
(
ω
) served
from j and define new variables w
j
= size (capacity) of plant j , with unit invest-
ment cost g
j
.
The model now reads
max −
n
∑
j= 1
c
j
x
j
−
n
∑
j= 1
g
j
w
j
+ E
ξ
max
m
∑
i=1
n
∑
j= 1
q
ij
(
ω
)y
ij
(
ω
) (4.18)
s. t. x
j
∈{0,1} , w
j
≥ 0 , j = 1,...,n , (4.19)
n
∑
j= 1
y
ij
(
ω
) ≤ 1 , i = 1,...,m , (4.20)
m
∑
i=1
d
i
(
ω
)y
ij
(
ω
) ≤ w
j
, j = 1,...,n , (4.21)
2.4 Two-Stage Program with Fixed Recourse 65
0 ≤ y
ij
(
ω
) ≤ x
j
, i = 1,...,m , j = 1,...,n , (4.22)
where q
ij
(
ω
)=(r
i
−v
j
−t
ij
)d
i
(
ω
) now includes the demand d
i
(
ω
) .
Constraint (4.20) indicates that no more than 100% of i ’s demand can be served,
but that the possibility exists that not all demand is served. Constraint (4.21) imposes
that the quantity distributed from plant j does not exceed the capacity w
j
decided
in the first stage. For the sake of clarity, one could impose a constraint w
j
≤ Mx
j
,
but this is implied by (4.21)and(4.22). For a discussion of algorithmic solutions of
this problem, see Louveaux and Peeters [1992].
d. Stages versus periods; Two-stage versus multistage
In this section, we highlight again the difference in a stochastic program between
stages and periods of times. Consider the case of a distribution firm that makes
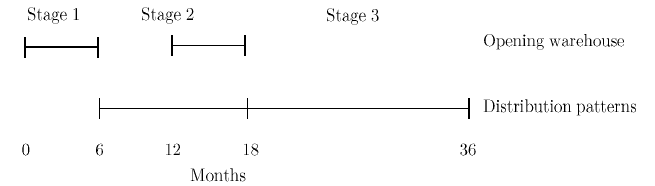
its plans for the next 36 months. It may formulate a model such as (4.18)–(4.22).
The location of warehouses would be first-stage decisions, while the distribution
problem would be second-stage decisions. The duration of the first stage would
be something like six months (depending on the type of warehouse) and the second
stage would run over the 30 remaining months. Although we may think of a problem
over 36 periods, a two-stage model is totally relevant. In this case, the only moment
where the number of periods is important is when the precise values of the objective
coefficients are computed.
In this example, a multistage model becomes necessary if the distribution firm
foresees additional periods where it is ready to change the location of the ware-
houses. In this example, suppose the firm decides that the opening of new ware-
houses can be decided after one year. A three-stage model can be constructed. The
first stage would consist of decisions on warehouses to be built now. The second
stage would consist of the distribution patterns between months 7 and 18 as well
and new openings decided in month 12 . The third stage would consist of distribu-
tion patterns between months 19 and 36 .
Fig. 2 Three-stage model decisions and times.
66 2 Uncertainty and Modeling Issues
Let x
1
and x
2
(
ω
2
) be the binary vectors representing opening warehouses in
stages 1 and 2, respectively. Let y
2
(
ω
2
) and y
3
(
ω
3
) be the vectors representing
the distribution decisions in stages 2 and 3, respectively, where
ω
2
and
ω
3
are the
states of the world in stages 2 and 3. Assuming each warehouse can only have a
fixed size M , the following model can be built:
max −
n
∑
j= 1
c
j
x
1
j
+ E
ξ
2
max{
m
∑
i=1
n
∑
j= 1
q
2
ij
(
ω
2
)y
2
ij
(
ω
2
) −
n
∑
j= 1
c
2
j
(
ω
2
)x
2
j
(
ω
2
)
+ E
ξ
3
|ξ
2
max[
m
∑
i=1
n
∑
j= 1
q
3
ij
(
ω
3
)y
3
ij
(
ω
3
)]}
s. t.
n
∑
j= 1
y
2
ij
(
ω
2
) ≤1 , i = 1,...,m ,
m
∑
i=1
d
i
(
ω
2
)y
2
ij
(
ω
2
) ≤Mx
1
j
, j = 1,...,n ,
n
∑
j= 1
y
3
ij
(
ω
3
) ≤1 , i = 1,...,m ,
m
∑
i=1
d
i
(
ω
3
)y
3
ij
(
ω
3
) ≤M(x
1
j
+ x
2
j
(
ω
2
)) , j = 1,...,n ,
x
1
j
+ x
2
j
(
ω
2
) ≤ 1 , j = 1,...,n ,
x
1
j
,x
2
j
(
ω
2
) ∈{0,1} , j = 1,...,n ,
y
2
ij
(
ω
2
),y
3
ij
(
ω
3
) ≥ 0 , i = 1,...,m , j = 1,...,n .
Multistage programs will be further studied in Section 3.4.
2.5 Random Variables and Risk Aversion
In our view, one can often classify random events and random variables in two major
categories. In the first category, we would place uncertainties that recur frequently
on a short-term basis. As an example, uncertainty may correspond to daily or weekly
demands. This normally leads to a model similar to the one in Section 2.4,Caseb
(4.b), where allocation cannot be adjusted every time period. It follows that the
expectation in the second stage somehow represents a mean over possible values of
the random variables, of which many will occur. Thus, the expectation takes into
account realizations that might not occur and many realizations that will occur. To
fix ideas here, if in Model 4.b the units in the objective function are in a yearly
basis and the randomness involves daily or weekly demands, one may expect that
the value of the objective of stochastic model will closely match the realized total
yearly revenue.
2.5 Random Variables and Risk Aversion 67
As one interesting example of a real-world application of a location model of
this first category, we may recommend the paper by Psaraftis, Tharakan, and Ceder
[1986]. It deals with the optimal location and size of equipment to fight oil spills.
Occurrence and sizes of spills are random. The sizes of the spills are represented
by a discrete random variable taking three possible values, corresponding to small,
medium, or large spills. Sadly enough, spills are sufficiently frequent that the expec-
tation may be considered close enough to the mean cost, as just described. Occur-
rence of spills at a given site is also random. It is described by a Poisson process. By
making the assumption of non-concomitant occurrence of spills, all equipment is
made available for each spill, which simplifies the second-stage descriptions com-
pared to (4.14)–(4.17).
As a common example, consider revenue management decisions such as those
considered in Problem 1.1 for an airline that must determine reservation controls
for hundreds of daily flights. This area has become one of the most widespread
applications of analytical methods to determining optimal choices under uncertain
conditions (see Talluri and van Ryzin [2005]). Airlines routinely solve thousands of
these stochastic programs each month and can reasonably expect to receive close
to the expected revenue from their decisions each month (if not each day). Risk
aversion has little affect in that case.
In the second category, we would place uncertainties that can be represented as
scenarios, of which basically only one or a small number are realized. An example in
a similar situation to the airline might be the problem of the organizers of the World
Cup championship soccer game, which only occurs once every four years, to choose
prices and seat allocations to maximize revenues but also to protect against possible
losses. This consideration would also be the case in long-term models where sce-
narios represent the general trend or path of the variables. As already indicated, this
is the spirit in which Model 4.c is built. In the second stage, among all scenarios
over which expectation is taken, only one is realized. The objective function with
only expected values may then be considered a poor representation of risk aversion,
which is typically assumed in decision making (if we exclude gambling).
Starting from the von Neumann and Morgenstern [1944] theory of utility, this
field of modeling preferences has been developed by economics. Models such as the
mean-variance approach of Markowitz [1959] have been widely used. Other meth-
ods have been proposed based on mixes of mean-variance and other approaches
(see, e.g, Ben-Tal and Teboulle [1986]). From a theoretical point of view, consid-
ering a nonlinear utility function transforms the problems into stochastic nonlinear
programs, which can require more computational effort than linear versions. In prac-
tice, risk aversion is often captured with a piecewise-linear representation, as in the
financial planning example in Section 1.2, to maintain a linear problem structure.
One interesting alternative to nonlinear utility models is to include risk aversion
in a linear utility model under the form of a linear constraint, called downside risk
(Eppen, Martin, and Schrage [1989]). The problem there is to determine the type
and level of production capacity at each of several locations. Plants produce various
types of cars and may be open, closed, or retooled. The demand for each type of car
68 2 Uncertainty and Modeling Issues
in the medium term is random. The decisions about the locations and configurations
of plants have to be made before the actual demands are known.
Scenarios are based on pessimistic, neutral, or optimistic realizations of demands.
A scenario consists of a sequence of realizations for the next five years. The stochas-
tic model maximizes the present value of expected discounted cash flows. The linear
constraint on risk is as follows: the downside risk of a given scenario is the amount
by which profit falls below some given target value. It is thus zero for larger profits.
The expected downside risk is simply the expectation of the downside risk over all
scenarios. The constraint is thus that the expected downside risk must fall below
some level.
To give an idea of how this works, consider a two-stage model similar to (4.1)–
(4.4) but in terms of profit maximization, by
maxz = c
T
x + E
ξ
[maxq
T
(
ω
)y(
ω
)]
s.t. (4.2)–(4.4).
Then define the target level g on profit. The downside risk u(
ξ
) is thus defined by
two constraints:
u(
ξ
(
ω
)) ≥ g −q
T
(
ω
)y(
ω
) (5.1)
u(
ξ
(
ω
)) ≥ 0 . (5.2)
The constraint on expected downside risk is
E
ξ
u(ξ) ≤ l , (5.3)
where l is some given level. For a problem with a discrete random vector ξ , con-
straint (5.3) is linear. Observe that (5.3) is in fact a first-stage constraint as it runs
over all scenarios. It can be used directly in the extensive form. It can also be used
indirectly in a sequential manner, by imposing such a constraint only when needed.
This can be done in a way similar to the induced constraints for feasibility that we
will study in Chapter 5.
2.6 Implicit Representation of the Second Stage
This book is mainly concerned with stochastic programs of the form (4.1)–(4.4),
assuming that an adequate and computationally tractable representation of the re-
course problem exists. This is not always the case. Two possibilities then exist that
still permit some treatment of the problem:
• A closed form expression is available for the expected value function Q(x) .
• For a given first-stage decision x , the expected value function Q(x) is com-
putable.

2.6 Implicit Representation of the Second Stage 69
These possibilities are described in the following sections.
a. A closed form expression is available for Q(x)
We may illustrate this case by the stochastic queue median model (SQM) first pro-
posed by Berman, Larson, and Chiu [1985] from which we take the following in
a simplified form. The problem consists of locating an emergency unit (such as an
ambulance). When a call arrives, there is a certain probability that the ambulance
is already busy handling an earlier demand for ambulance service. In that event,
the new service demand is either referred to a backup ambulance service or entered
into a queue of other waiting “customers.” Here, the first-stage decision consists of
finding a location for the ambulance. The second stage consists of the day-to-day
response of the system to the random demands. Assuming a first-in, first-out deci-
sion rule, decisions in the second stage are somehow automatic. On the other hand,
the quality of response, measured, e.g., by the expected service time, depends on the
first-stage decision. Indeed, when responding to a call, an ambulance typically goes
to the scene and returns to the home location before responding to the next call.
The time when it is unavailable for another call is clearly a function of the home
location.
Let
λ
be the total demand rate,
λ
≥0.Let p
i
be the probability that a demand
originates from demand region i , with
∑
m
i=1
p
i
= 1. Let also t(i,x) denote the
travel time between location x and call i . On-scene service time is omitted for
simplicity. Given facility location x , the expected response time is the sum of the
mean-in-queue delay w(x) and the expected travel time
¯
t(x) ,
Q(x)=w(x)+
¯
t(x) , (6.1)
where
w(x)=
λ
¯
t
(2)
(x)
2(1−
λ
¯
t(x))
if
λ
¯
t(x) < 1 ,
0otherwise,
(6.2)
¯
t(x)=
m
∑
i=1
p
i
t(i,x) , (6.3)
and
¯
t
(2)
(x)=
m
∑
i=1
p
i
t
2
(i,x) . (6.4)
The global problem is then of the form:
min
x∈X
Q(x) , (6.5)
70 2 Uncertainty and Modeling Issues
where the first-stage objective function is usually taken equal to zero and X repre-
sents the set of possible locations, which typically consists of a
network.
It should be clear that no possibility exists to adequately describe the exact se-
quence of decisions and events in the so-called second stage and that the expected
recourse Q(x) represents the result of a computation assuming the system is in
steady state.
b. For a given x , Q(x) is computable
The deterministic traveling salesperson problem (TSP) consists of finding a Hamil-
tonian tour of least cost or distance. Following a Hamiltonian tour means that
the traveling salesperson starts from her home location, visits all customers, (say
i = 1,...,m ) exactly, and returns to the home location.
Now, assume each customer has a probability p
i
of being present. A full opti-
mization that would allow the salesperson to decide the next customer to visit at each
step would be a difficult multistage stochastic program. A simpler two-stage model,
known as a priori optimization is as follows: in the first-stage, an a priori Hamilto-
nian tour is designed. In the second stage, the a priori tour is followed by skipping
the absent customers. The problem is to find the tour with minimal expected cost
(Jaillet [1988]).
The exact representation of such a second-stage recourse problem as a mathemat-
ical program with binary decision variables might be possible in theory but would
be so cumbersome that it would be of no practical value. On the other hand, the
expected length of the tour (and thus Q(x) ) is easily computed when the tour (x)
is given.
Let c
ij
be the distance between i and j . Assume for simplicity of notation that
the given tour is {0,1, 2,...,n,0} where 0 is the depot.
Define t(k) as the expected length from k till the depot if k is present. Thus
we search for Q(x)=t(0) .
Start with t(n+ 1)=0andt(n)=c
n0
.Let p
0
= 1andc
in+1
= c
i0
.Then
t(k)=
n−k
∑
r=0
r
∏
j= 1
(1 − p
k+ j
) p
k+r+1
(c
kk+r+1
+ t(k + r + 1)) for k = n −1,...,0,
where the condensed product is equal to 1 if r = 0.
This calculation is a backward recursion: assuming k is present, it considers the
next present customer to be k +r + 1 (and thus k +1tok + r being absent) for all
possible successors ( k + 1ton + 1:= 0).
2.7 Probabilistic Programming 71
2.7 Probabilistic Programming
In probabilistic programming, some of the constraints or the objective are expressed
in terms of probabilistic statements about first-stage decisions. The description of
second-stage or recourse actions is thus avoided. This is particularly useful when
the cost and benefits of second-stage decisions are difficult to assess.
For some probabilistic constraints, it is possible to derive a deterministic linear
equivalent. A first example was given in Section 1.3. We now detail two other ex-
amples where a deterministic linear equivalent is obtained and one where it is not.
a. Deterministic linear equivalent: a direct case
Consider Exercise 1.6.1. An airline wishes to partition a plane of 200 seats into
three categories: first, business, economy. Now, assume the airline wishes a special
guarantee for its clients enrolled in its loyalty program. In particular, it wants 98%
probability to cover the demand of first-class seats and 95% probability to cover the
demand of business class seats (by clients of the loyalty program). First-class pas-
sengers are covered if they get a first-class seat. Business class passengers are cov-
ered if they get either a business or a first-class seat (upgrade). Assume weekday de-
mands of loyalty-program passengers are normally distributed, say ξ
F
∼ N(16,16)
and ξ
B
∼ N(30,48) for first-class and business, respectively. Also assume that the
demands for first-class and business class seats are independent.
Let x
1
be the number of first-class seats and x
2
the number of business seats.
The probabilistic constraints are simply
P(x
1
≥ ξ
F
) ≥ 0.98, (7.1)
P(x
1
+ x
2
≥ ξ
F
+ ξ
B
) ≥ 0.95 . (7.2)
Given the assumptions on the random variables, these probabilistic constraints can
be transformed into a deterministic linear equivalent.
Constraint (7.1) can be written as F
F
(x
1
) ≥ 0.98 , where F
F
(·) denotes the cu-
mulative distribution of ξ
F
. Now, the 0.98 quantile of the normal distribution is
2.054 . As ξ
F
∼ N(16,16) , F
F
(x
1
) ≥ 0.98 is the same as (x
1
−16)/4 ≥ 2.054 or
x
1
≥24.216 . Thus, the probabilistic constraint (7.1) is equivalent to a simple bound.
Similarly, constraint (7.2) can be written as F
FB
(x
1
+ x
2
) ≥ 0.95 , where F
FB
(·)
denotes the cumulative distribution of ξ
F
+ ξ
B
. By the independence assumption
and the properties of the normal distribution, ξ
F
+ ξ
B
∼ N(46,64) . The 0.95 quan-
tile of the standard normal distribution is 1.645 . Thus, F
FB
(x
1
+ x
2
) ≥ 0.95 is the
same as (x
1
+ x
2
−46)/8 ≥ 1.645 or x
1
+ x
2
≥ 59.16 .
Thus, the probabilistic constraint (7.2) is equivalent to a linear constraint. We
say that (7.2) has a linear deterministic equivalent. This is the desired situation with
probabilistic constraints.

72 2 Uncertainty and Modeling Issues
b. Deterministic linear equivalent: an indirect case
We now provide an example where finding the deterministic equivalent requires
some transformation.
Consider the following covering location problem. Let j = 1,...,n be the po-
tential locations with, as usual, x
j
= 1 if site j is open and 0 otherwise, and c
j
the investment cost. Let i = 1,...,m be the clients. Client i is served if there ex-
ists an open site within distance t
i
. The distance between i and j is t
ij
.Define
N
i
= {j |t
ij
< t
i
} as the set of eligible sites for client i . The deterministic covering
problem is
min
n
∑
j= 1
c
j
x
j
(7.3)
s. t.
∑
j∈N
i
x
j
≥ 1 , i = 1,...,m , (7.4)
x
j
∈{0,1} , j = 1,...,n . (7.5)
Taking again the case of an ambulance service, one site may cover more than one
region or demand area. When a call is placed, the emergency units may be busy
serving another call. Let q be the probability that no emergency unit is available at
site j . For simplicity, assume this probability is the same for every site (see Toregas
et al. [1971]). Then, the deterministic covering constraint (7.4) may be replaced by
the requirement that P (at least one emergency unit from an open eligible site is
available) ≥
α
where
α
is some confidence level, typically 90 or 95%. Here, the
probability that none of the eligible sites has an available emergency unit is q to the
power
∑
j∈N
i
x
j
, so that the probabilistic constraint is
1 −q
∑
j∈N
i
x
j
≥
α
, i = 1,...,m (7.6)
or
q
∑
j∈N
i
x
j
≤ 1 −
α
.
Taking the logarithm on both sides, one obtains
∑
j∈N
i
x
j
≥ b (7.7)
with
b =
ln(1 −
α
)
lnq
, (7.8)
where a denotes the smallest integer greater than or equal to a . Thus, the prob-
abilistic constraint (7.6) has a linear deterministic equivalent (7.7).
2.7 Probabilistic Programming 73
c. Deterministic nonlinear equivalent: the case of random
constraint coefficients
The diet problem is a classical example of linear programming (discussed in Dantzig
[1963] for the case in Stigler [1945]) . It consists of selecting a number of foods in
order to get the cheapest menus that meet the daily requirements in the main nutri-
ents (energy, protein, vitamins,...). Consider the data in the introductory example
of Chv´atal (1980). Polly wants to choose among six foods (oatmeal, chicken, eggs,
whole milk, cherry pie and pork with beans). Each food has a given serving size;
for instance, a serving of eggs is two large eggs and a serving of pork with beans
is 260 grams. Each food has therefore a known content of nutrients. If we take the
case of protein, the content is 4 , 32 , 13 , 8 , 4 and 14 grams (grams) of proteins,
respectively, for the given serving sizes.
Let x
1
,...,x
6
represent the number of servings of each product per day. As Polly
is a girl of 18 years of age, she needs 55 grams of protein per day. The protein
constraint reads as follows:
4x
1
+ 32x
2
+ 13x
3
+ 8x
4
+ 4x
5
+ 14x
6
≥ 55 .
(We omit here the other constraints and the objective function, which are very im-
portant to Polly but not central to our discussion.)
The same book later on contains an interesting discussion on the difficulty to get
precise reliable RDA (recommended daily allowances) as well as precise nutrient
contents per serving (Chv´atal [Chapter 11, pp. 182–187]). Let us concentrate on this
second aspect. It is indeed very unlikely that every large egg has exactly 6.5 grams
of protein, or every serving of 260 grams of pork with beans has exactly 14 grams
of protein. This implies that the nutrient content of each serving is in fact a random
variable. Let a
1
,...,a
6
be the random content in proteins for the six products. The
probabilistic constraint reads as follows:
P(a
1
x
1
+ a
2
x
2
+ a
3
x
3
+ a
4
x
4
+ a
5
x
5
+ a
6
x
6
≥ 55) ≥
α
. (7.9)
Let us now assume the contents of the products are normally distributed, say
a
i
∼ N(
μ
i
,
σ
2
i
) , i = 1,...,6 . We can clearly assume independence between the
six products. Then a
1
x
1
+ a
2
x
2
+ a
3
x
3
+ a
4
x
4
+ a
5
x
5
+ a
6
x
6
∼ N(
μ
,
σ
2
) with
μ
=
μ
1
x
1
+
μ
2
x
2
+
μ
3
x
3
+
μ
4
x
4
+
μ
5
x
5
+
μ
6
x
6
and
σ
2
=
σ
2
1
x
2
1
+
σ
2
2
x
2
2
+
σ
2
3
x
2
3
+
σ
2
4
x
2
4
+
σ
2
5
x
5
+
σ
2
6
x
6
.
Classical probabilistic analysis of the normal distribution implies that (7.9)is
equivalent to
(55 −
μ
)/
σ
≤ z
1−
α
with z
1−
α
the (1 −
α
) -quantile of the normal distribution. Taking
α
= 0.98 , the
constraint reads (55 −
μ
)/
σ
≤−2.054 or
μ
≥ 55 + 2.054 ·
σ
.As
σ
2
=
σ
2
1
x
2
1
+
σ
2
2
x
2
2
+
σ
2
3
x
2
3
+
σ
2
4
x
2
4
+
σ
2
5
x
2
5
+
σ
2
6
x
2
6
, this constraint is non-linear and convex.