Blank L., Tarquin A. Engineering Economy (McGraw-Hill Series in Industrial Engineering and Management)
Подождите немного. Документ загружается.

SECTION 5.8 Present Worth
of
Bonds
the United States, Treasury securities are considered a very safe bond purchase
because they are backed with the
"full faith and credit
of
the U.S. government."
The safe investment rate indicated in Figure 1-6 as the lowest level for estab-
lishing a MARR
is
the coupon rate on a U.S. Treasury security. As another illus-
tration, debenture bonds are issued by corporations in order to raise capital, but
they are not backed
by
any particular form
of
collateral. The corporation's repu-
tation attracts bond purchasers, and the corporation may make the bond interest
rate 'float' to further attract buyers.
Often debenture bonds are convertible to
common stock
of
the corporation at a fixed rate prior to their maturity date.
Procter and Gamble Inc. has issued $5,000,000 worth
of
$5000 ten-year debenture
bonds. Each bond pays interest quarterly at 6%.
(a) Determine the amount a purchaser
will receive each 3 months and after
10 years. (b) Suppose a bond is purchased at a time
when it is discounted
by
2% to $4900. What are the quarterly interest amounts and the
final
payment amount at the maturity date?
Solution
(a) Use Equation [5.8] for the quarterly interest amount.
f = (5000)(0.06) = $75
4
The face value
of
$5000 is repaid
after]
0 years.
(b)
Purchasing the bond at a discount from face value does not change the interest or
final
repayment amounts. Therefore, $75 per quarter and $5000 after
lO
years
remain the amounts.
Finding the PW value
of
a bond is another extension
of
present worth analy-
sis. When a corporation or government agency offers bonds, potential purchasers
can determine how much they should be willing to pay in
PW
terms for a bond
of
a stated denomination. The amount paid at purchase time establishes the rate
of
return for the remainder
of
the bond life. The steps to calculate the
PW
of
a
bond are as follows:
l.
Determine
1,
the interest per payment period, using Equation
[5
.8
].
2.
Construct the cash flow diagram
of
interest payments and face value repay-
ment.
3. Establish the required
MARR
or rate
of
return.
4. Calculate the
PW
value
of
the bond interest payments and the face value at
i = MARR. (If the bond interest payment period is not equal to the MARR
compounding period, that is,
PP
'*
CP,
first use Equation [4.8] to determine
the effective rate per payment period.
Use this rate and the logic
of
Sec-
tion 4.6 for
PP
2:
CP to complete the
PW
calculations.)
195
Effecti ve
irate
196
CHAPTER 5 Present Worth Analysis
Use the fo
ll
ow
in
g logic:
PW
2:
bond purchase price;
MARR
is met
or
exceeded, buy
th
e bond.
PW < bond purchase price; MARR is not met, do not buy the bond.
Determine the purchase price you should be willing to pay now for a 4.5% $5000
10-year bo
nd
with interest paid semiannuall
y.
Assume your
MARR
is 8% per year,
compounded quarterly.
Solution
First, determine the semiannual interest.
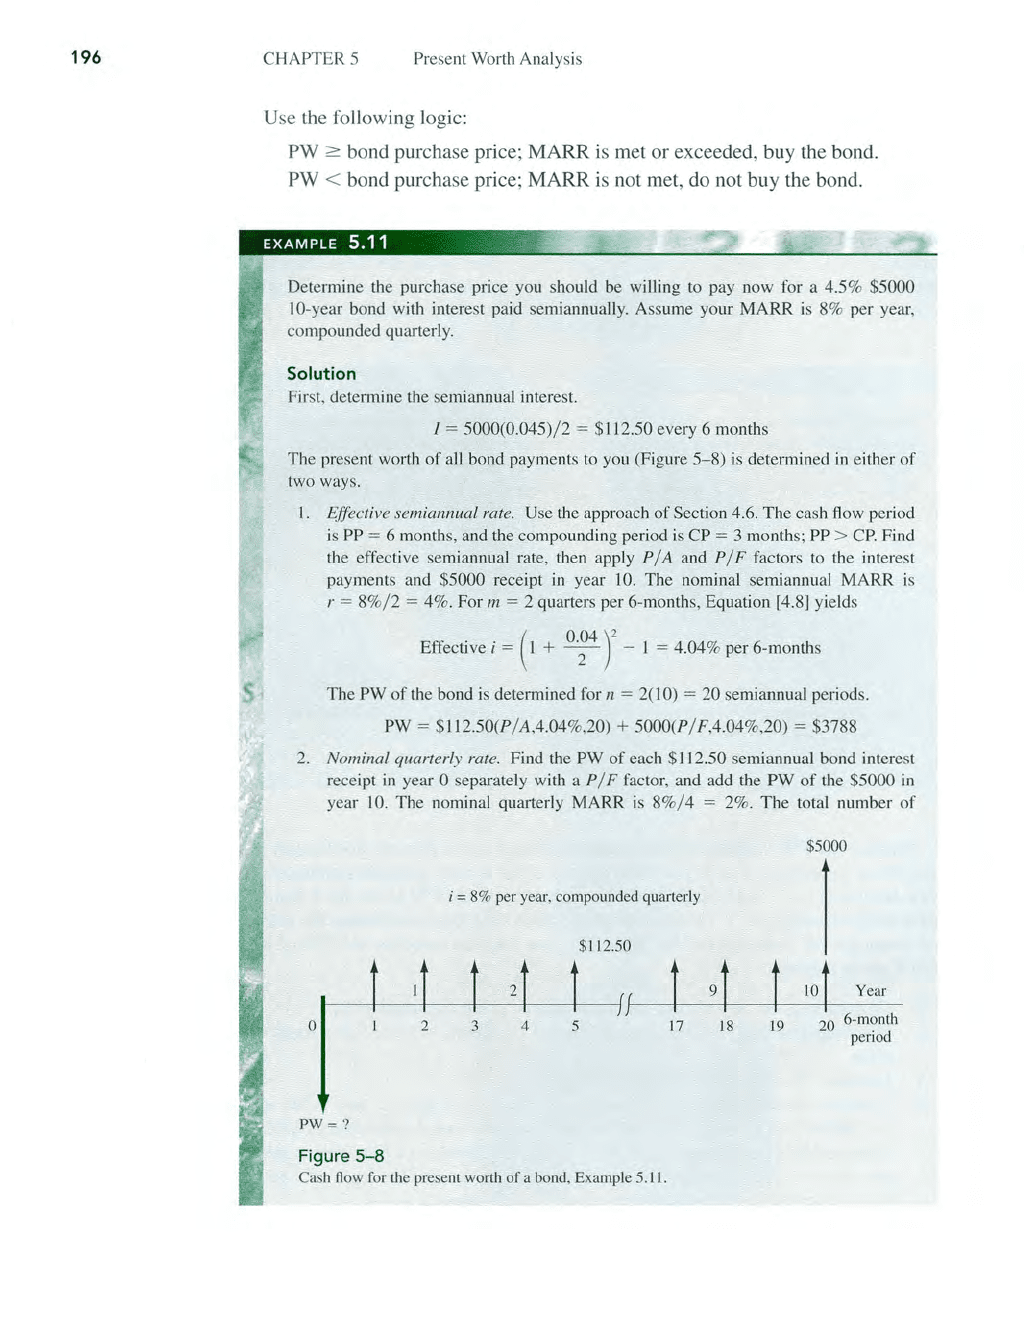
I = 5000(0.045)/ 2 = $ 112.50 every 6 months
The present worth
of
all bond payments to you (Figure 5- 8) is determined
in
either
of
two ways.
I.
Effective semiannual rate. Use the approach
of
Section 4.6.
The
cash flow period
is
PP = 6 months, and the compounding period
is
CP
= 3 months; PP >
CPo
Find
the effective semjannual rate, then apply
P
IA
and P
/F
factors to the interest
payments and
$5000 receipt
in
year 10. The nominal semiannual MARR
is
r = 8
%/
2 = 4%. For m = 2
qu
arters per 6-months, Equation
[4.
8] yie
ld
s
Effective
i = (I +
0.~4
r -I = 4.04% per 6-months
The
PW
of
th
e bond
is
determined for n = 2(
10
) =
20
semiannual periods.
PW
= $
112
.50(P/A,4.04
%,
20) + 5000(P/ F,4.04%,20) = $3788
2. Nominal quarterly rate. Find the PW
of
each $
11
2.50 semiannnal bond interest
receipt
in
yea
r 0 separately with a P/ F
fa
ctor, and add the PW
of
th
e $5000
in
year 10. The nominal qualterly
MARRis
8
%/
4 = 2%. The total number
of
$5000
1
i = 8% per year, compounded quarterly
$J
l2.50
J-----+--t----+----t--+-----J
Jf------+!
1
--f-9
1
--+-1
~LO
t
_Year
20
6-month
period
o
2 3
18
19
4
5
17
pw=
?
Figure
5-8
Cash flow for the present worth
of
a bond, Example
5.l1.
SECTION 5.9 Spreadsheet
Applications-PW
Analysis and Payback Period
periods is n = 4(10) = 40 quarters, double those shown
in
Figure
5-8,
since the
payments are made semiannually while the MARR
is
compounded quarterly.
PW = 112.50(P/F,2%,2) +
1l2.50(P/F,2%,4)
+
...
+ 112.50(P/F,2%,40)
+ 5000(P / F,2%,40)
= $3788
If
the asking price is more than $3788 for the bond, which is a discount of more than
24%, you will not make the MARR.
The spreadsheet function
PV(4.04%,20,112.50,5000) displays the
PW
value of$3788.
5.9 SPREADSHEET
APPLICATIONS-PW
ANALYSIS
AND
PAYBACK PERIOD
Example 5.
12
illustrates how
to
set up a spreadsheet for PW analysis for different-
life alternatives and for a specified study period. Example 5.13 demonstrates the
technique and shortcomings
of
payback period analysis for i > 0%. Both hand
and computer solutions are presented for this second example.
Some general guidelines help organize spreadsheets for any
PW
analysis. The
LCM
of
the alternatives dictates the number
of
row entries for initial investment
and salvage/market values, based on the repurchase assumption that
PW analy-
sis requires. Some alternatives will be service-based (cost cash flows only);
others are revenue-based (cost and income cash flows).
Place the annual cash
flows
in
separate columns from the investment and salvage amounts. This re-
duces the amount
of
number processing you have
to
do before entering a cash
flow value. Determine the
PW values for all columns pertinent
to
an alternative,
and add them to obtain the final
PW value.
Spreadsheets can become crowded very rapidly. However, placing the
NPV
functions at the head
of
each cash flow column and inserting a separate summary
table make the component and total
PW values stand out. Finally, place the
MARR value in a separate cell, so sensitivity analysis on the required return can
be easily accomplished. Example 5.12 illustrates these guidelines.
EXAMPLE
5.12
',,:';
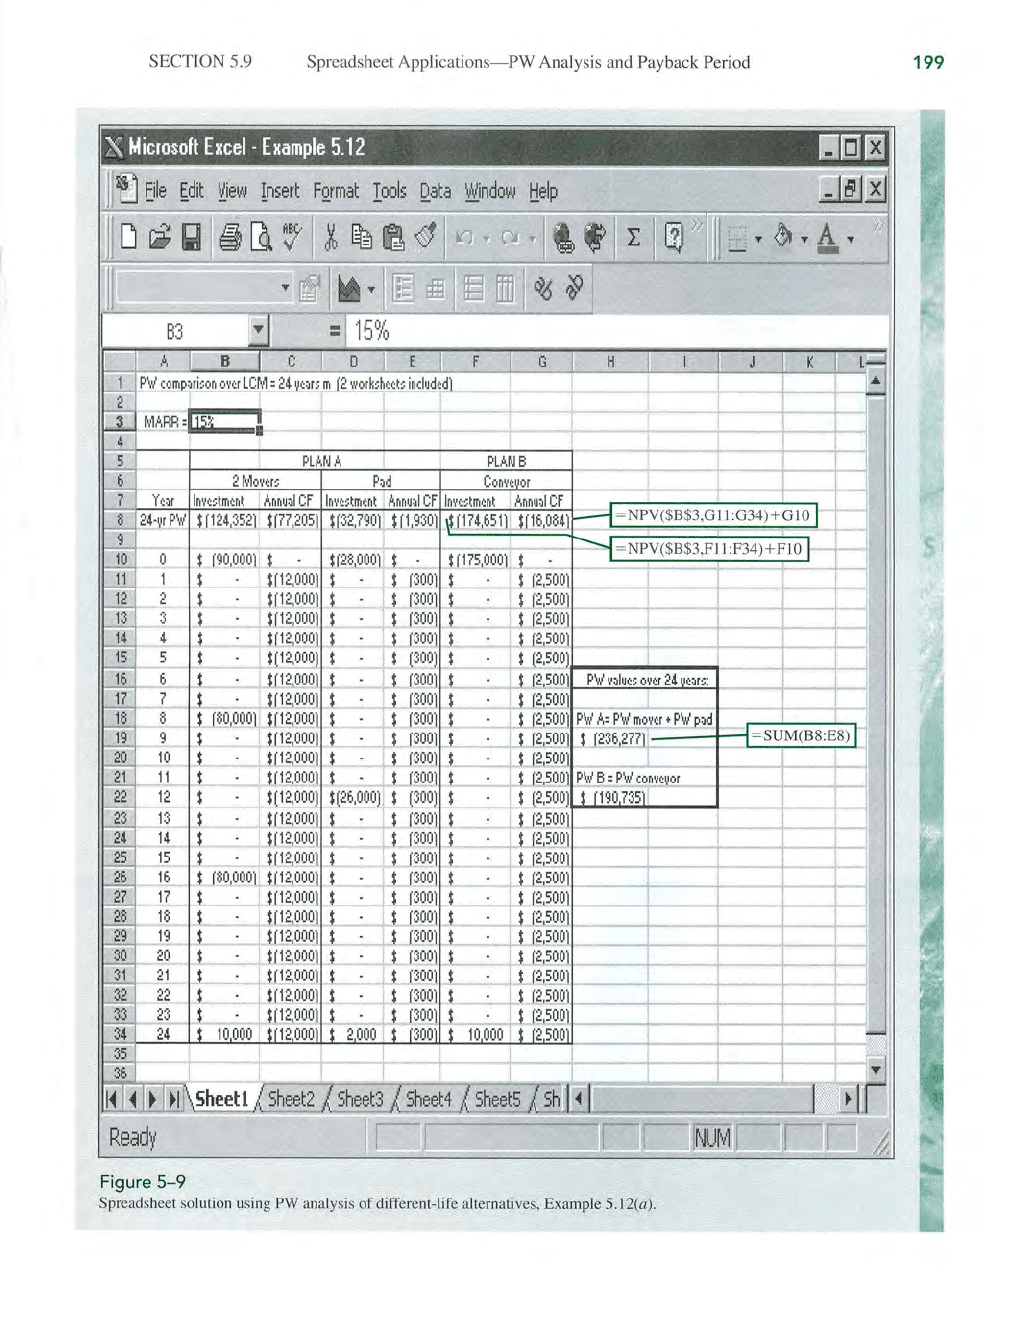
Southeastern Cement plans to open a new rock pit. Two plans have been devised for move-
ment
of
raw material from the quarry to the plant. Plan A requires the purchase
of
two
earthmovers and construction
of
an
unloading pad at the plant. Plan B calls for construc-
tion
of
a conveyor system from the quarry to the plant. The costs for each plan are detailed
in Table 5- 2.
(a) Using spreadsheet-based PW analysis, determine which plan should be
selected if money is worth 15% per year.
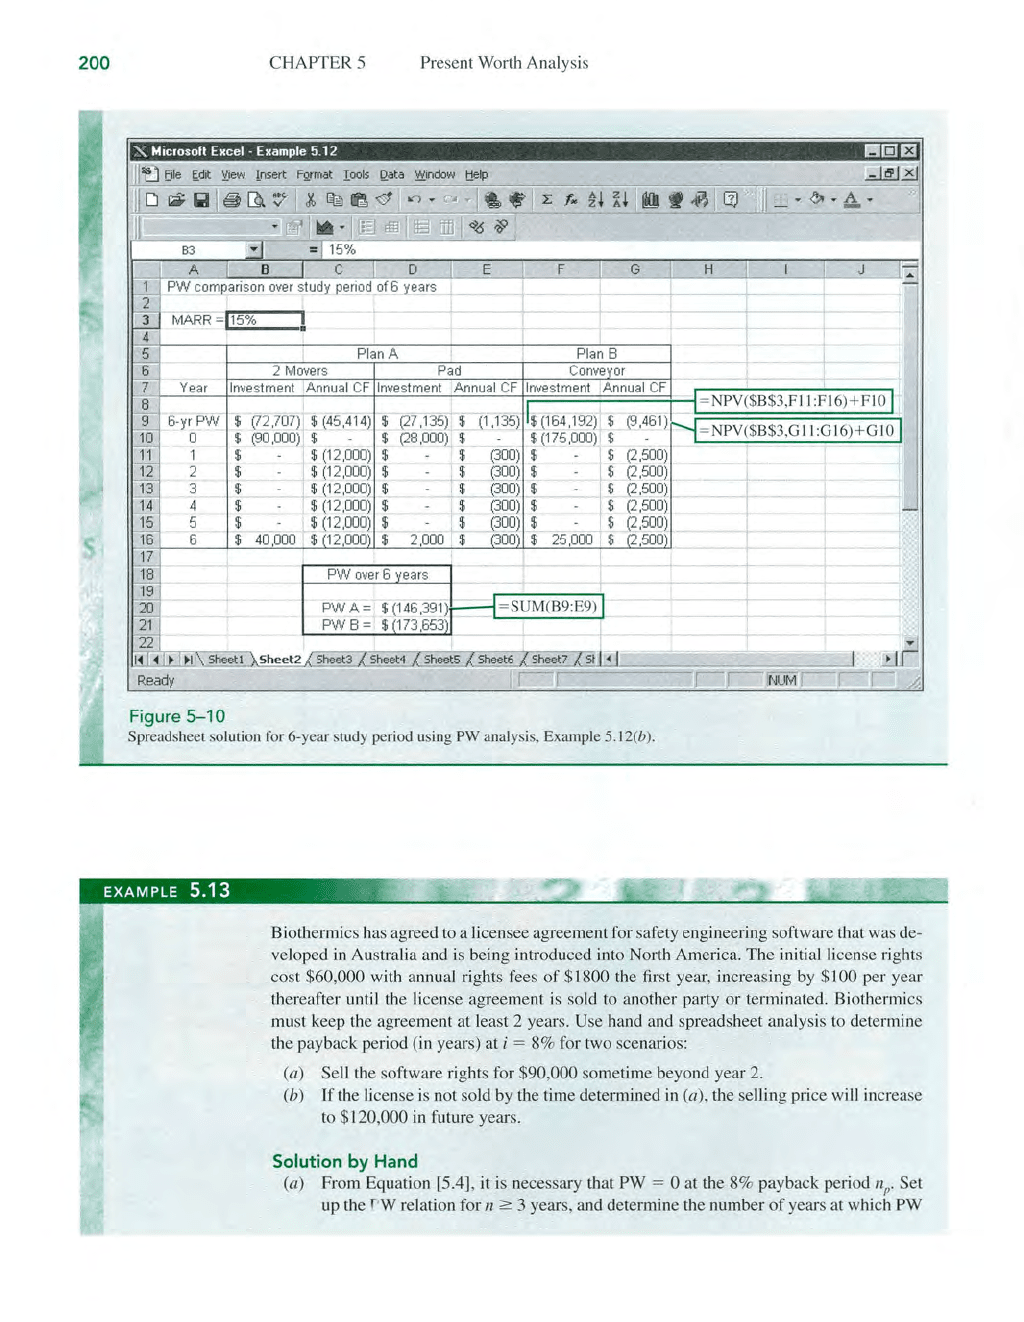
(b) After only 6 years
of
operation a major envi-
ronmental problem made Southeastern stop all operations at the rock pit. Use a 6-year
study period
to
determine
if
plan A or B was economically better. The market value
of
each
mover after 6 years is
$20,000, and the trade-in value
of
the conveyor after 6 years is only
$25,000. The pad can be salvaged for $2000.
197
Q-Solv
198
CHAPTER 5 Present Worth Analysis
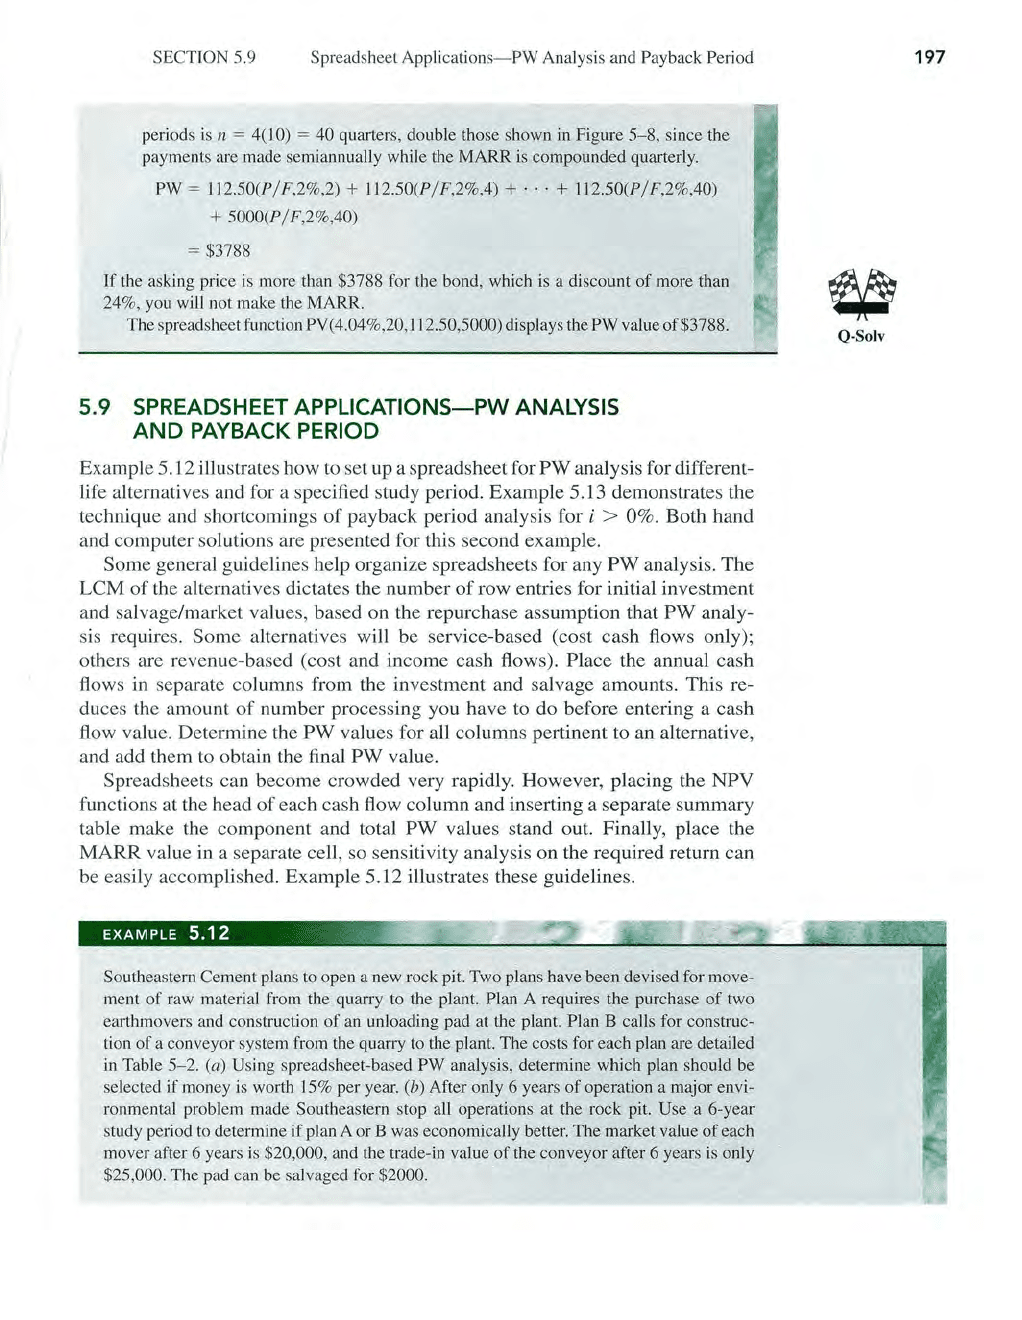
TABLE
5-2
Estimates for Plans to Move Rock from Quarry to Cement Plant
Plan A Plan B
Mover
Pad Conveyor
lni tial cost, $ - 45,000
-28,000
-175,
000
Annual operating cost, $
-6,
000
-300
-2,5
00
Salvage
value, $
5,000 2,000 10,000
Life, years
8
12
24
Solution
(a) Evaluation must take place over the LCM
of
24 years. Reinvestment
in
the two
movers will occur in years 8 and 16, and the unloading pad must be rebuilt
in
year 12.
No reinvestment is necessary for plan
B. First, construct the cash
flow
diagrams for
plans A and B over 24 years to better understand the spreadsheet analysis
in
Fig-
ure
5-9.
Columns B,
D,
and F include all investments, reinvestments, and salvage
values.
(Remember
to
enter ze
ros
in all cells with no cashflows, or the NPViunction
will give an incorrect
PW
value.) These are service-based alternatives,
so
columns
C,
E, and G display the AOC estimates, labeled "Annual CF". NPV functions provide
the
PW amounts in row 8 cells. These are added by alternative in cells H19 and H22.
Conclusion: Select plan B because the
PW
of costs
is
smaller.
(b) Both alternatives are abruptly terminated after 6 years, and current market or trade-
in
values are estimated.
To
perform the
PW
analysis for a severely truncated study
period, Figure
5-10
uses the same format as that for the 24-year analysis, except for
two major alteratio
ns.
Cells in row 16 now include the market and trade-in amounts,
and all rows after
16
are deleted. See the cell tags
in
row 9 for the new NPV func-
tions for the 6 years
of
cash flows. Cells D20 and
D2l
are the PW values found
by
Slimming the appropriate PW values
in
row
9.
Conclusion: Plan A should have been selected, had the termination after 6 years
been known at the design stage
of
the rock pit.
Comment
The spreadsheet solution for part (b) was developed by initially copying the entire work-
sheet in part
(a) to sheet 2
of
the Excel workbook. Then the changes outlined above
were made
to
the copy. Another method uses the same worksheet to build the new NPV
fu
nctions
as
shown
in
Figure
5-10
cell tags,
but
on the Figure
5-9
worksheet after insert-
ing a new row
16
for year 6 cash flows. This approach is faster and less formal than the
method demonstrated here. There
is
one real danger
in
using the one-worksheet approach
to solving this (or any sensitivity analysis) problem. The altered worksheet now solves a
different problem,
so
the functions display new answers. For example, when the cash flows
are truncated to a 6-year study period, the old
NPV functions in row 8 must be changed, or
the new
NPV functions must be added in row
9.
But now the NPV functions
of
the old
24-year
PW analysis display incorrect answers, or possibly
an
Excel error message. This
introduces error possibilities into the decision making. For accurate, correct results, take
the time to copy the first sheet
to
a new worksheet and make the changes on the copy. Store
both
so
lutions after documenting what each sheet
is
designed to analyze. This provides a
historical record of what was altered during the sensitivity analysis.
SECTION 5.9
Spreadsheet
Applications-PW
Analysis and Payback Period
199
Figure
5-9
Spreadsheet solution u
si
ng
PW analysis
of
different-life alternatives, Example S
.1
2(a).
200
CHAPTER 5
Present Worth Analysis
X M,elosoll EHeel - Example 5.12 I!lIiII3
j
'tJ
Ble
!;:dit
'l.iew
Insert Fgrmat Iools
~ata
'Il:indow
tlelp
1
2
3
MARR
-11.:,1;;;.5
0
;.:;Yo
__
!
4
5
Plan A Plan B
2
Move
rs
Pad
Conveyor
6
7
8
9
10
11
12
Yea
r
6-yrPW
o
I
nves
tm
en
t Annual CF
Inve
stment Annual CF
Inve
stment Annual CF I
$
(72,707)
$
(45,414)
$
(27
,1
35)
$ (1
,135)
1$
(164,192)
$
(9,461)
-
1"3
14
15
16
17
18
19
20
21
22
1
2
3
4
5
6
$
(90,000)
$ $
(28,000)
$ - - $
(175
,
000)
$
$ 1$
(1
2
,000
) $ $
(300)
$ - 1$
$ $
(12,000)
$ 1$
(39
0
),
$ - $
$ $
(1
2,000)
$ J
~
9_
00
2 $ -
...
$
$ $ (1
2,
000
) $ t $
(30Q)
$ - $
$ $
(12,000)
$ , $
(300)
$ I $
$
40
~0
0
0
$
12,000
$
2,0
00
$ ·
00
f
25,000
$
PW
o
ver
6 years
PWA=
$
(146
,
39
1)
~
=SUM(B9:E9)
I
PW
B = $
(173,653
__
I~
~ ~
~I
Sh
ee
t!
Sheet
2
Sheet3,
Ready
SheetS Sheet6 Sheet?
SI.
Figure
5-10
(2
,
50
0)
(2
,
500)
(2
,500)
(2,50
0)
(2
,
500)
,
500
Spreadsheet solution for 6-year study period
ll
s
in
g PW analysis, Example
5.
l2(b).
=NPV($B$3,GII:GI6
)+G
IO
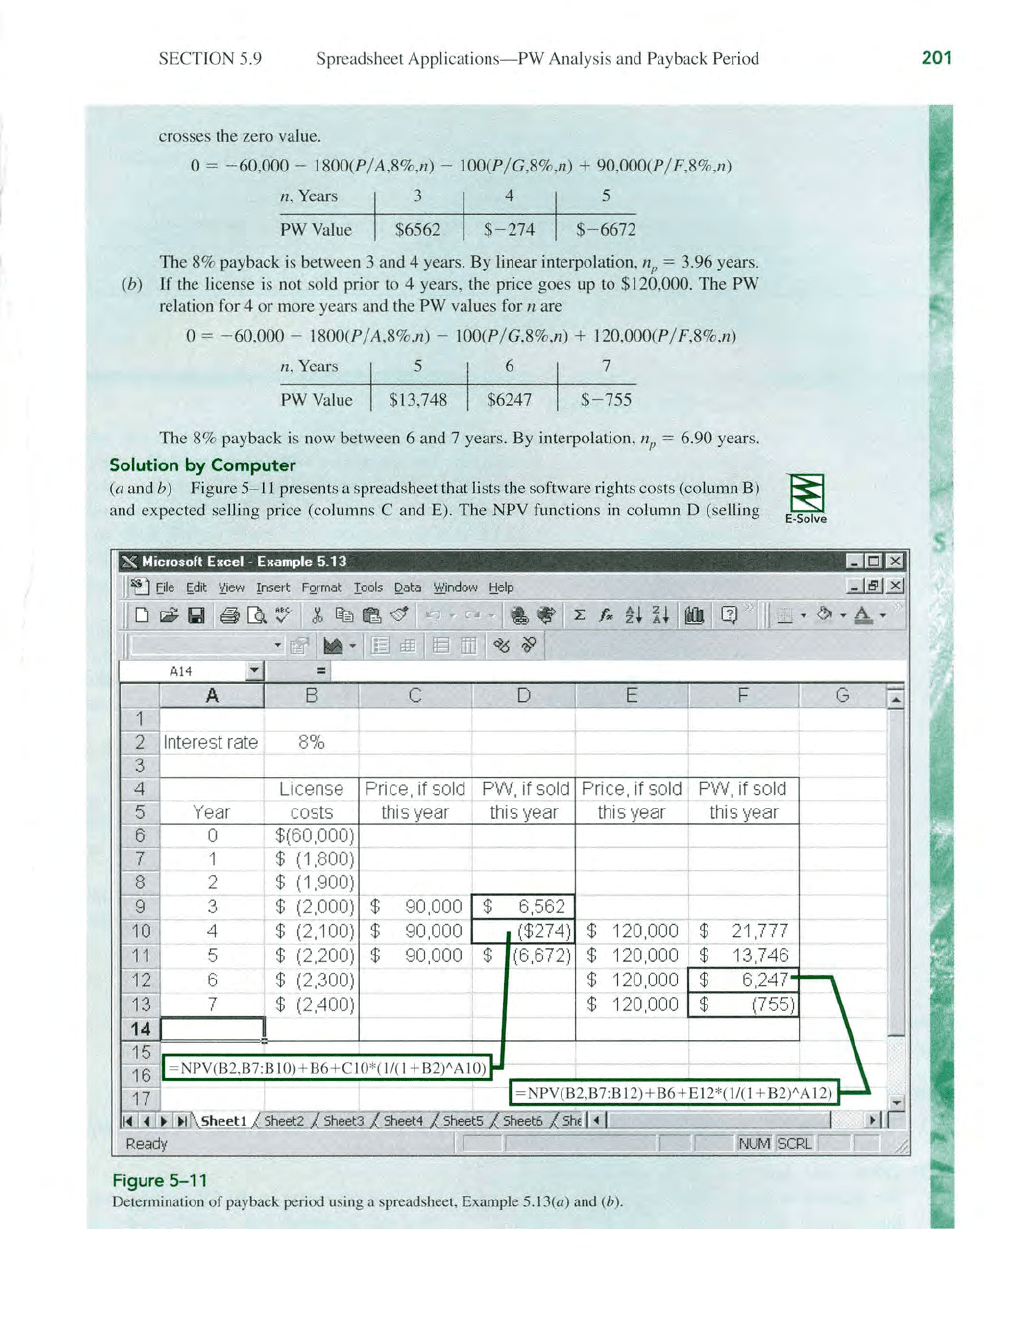
EXAMPLE
5.13
t
Biothermjcs has agreed to a licensee agreement for safety engineering software
th
at was de-
veloped
in
Au
stralia and
is
being introduced into North America. The initial license
ri
ghts
cost
$60,000 with annual rights fees
of
$1800 the first year, increasing
by
$100 per year
thereafter until the license agreement is sold to another party
or
terminated. Biothermics
must keep
th
e agreement at least 2 years, Use hand and spreadsheet analysis to determine
the payback period (
in
years) at i = 8% for two scenarios:
(a) Sell the software
li
ghts for $90,000 sometime beyond year
2.
(b)
If
th
e license
is
not sold by the time determined in (a), the selling price will
in
crease
to
$120,000
in
future years.
Solution
by
Hand
(a) From Equation [5.4], it is necessary
th
at PW = 0 at the 8% payback period n
p-
Set
up the
PW relation for n ~ 3 years, and determine
th
e number
of
years at which
PW
SECT
ION
5.9 Spreadsheet Applications-
PW
Anal
ys
is and Payback Period
crosses
th
e zero va
lu
e.
0 = - 60,000 - 1800(P/A,8%,n) -
100
(P/ G,8%,n) + 90,000(P/ F,8%,n)
;:::~ue
I
$6~62
I
$-:74
I
$-:672
The 8% payback is between 3 and 4 years. By linear interpolation, n" = 3.96 years.
(b)
If
the license is not so
ld
prior to 4 years, the price goes
up
to $
120
,000. The PW
relation for 4 or more years and the
PW
values for n are
0 = - 60,000 - 1800(P/A,8%,n) - 100(P/ G,8
%,
n) + l20,000(P/ F,8%,n)
n, Y
ea
rs 5 6 7
PWValue
$-7
55
The 8% payback is now between 6 and 7 years. By interpolation,
n
)l
= 6.90 years.
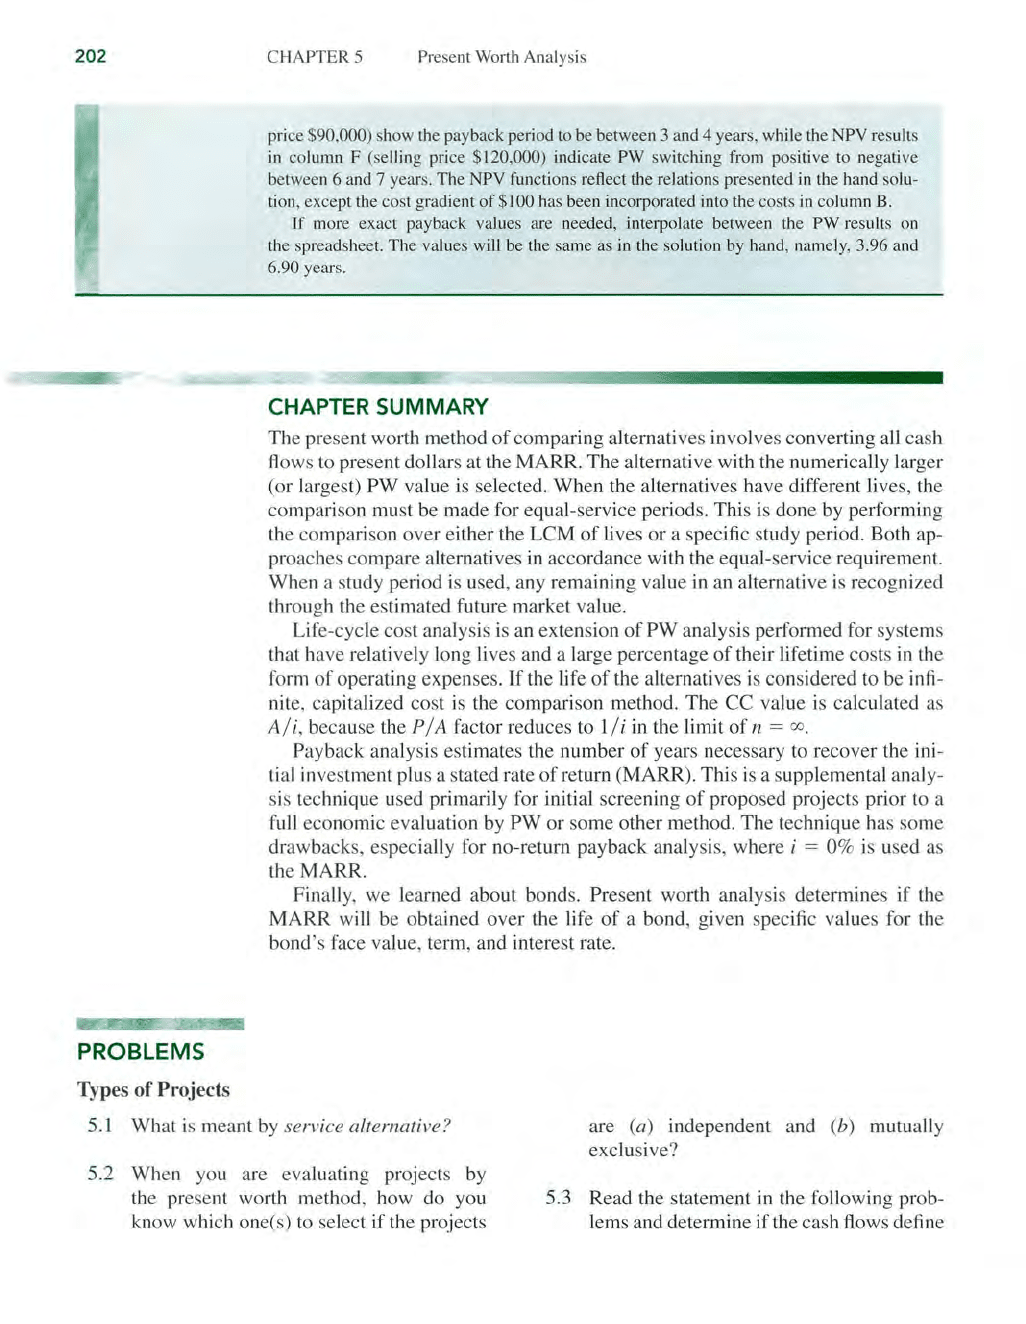
Solution
by
Computer
(a
and b) Figure 5- \ 1 prese
nt
s a spreadsheet that lists the software rights costs (column B)
and expected selling price (columns C and E). The
NPV functi.ons
in
column D (selling
~
E·Solve
"X
Microsoft Excel - Example 5.13 I!lIiII3
A14
A E
Interest rate
Li
cense Price, if so
ld
PW, if sold Price, if sold PW, if sold
Year costs
tllis year this year this year this year
0
$(60,000)
7 1
$
(1,
800)
2
$
(1
,900)
L
3
$
(2,000)
$
90,000
$
6
,5
62
4 $
(2,100)
$
90,000
($274) $
120,000
$
5
I $ (2,200) $
90,000
$
(6
,672)
$
120,000 : $
6 $
(2,300)
$
120,000
$
7
$
(2.400)
$
120,000
$
5heetl
~
~
;E:
h
=
ee
=
t6
~
€
5h
=U
=
.
;'.::
1
====;:::::::::;;:==::::-;.:
~::;;:;;:;;::;:
Ready I
r=-
L
Figure 5-11
Determination
of
payback period
lIsi
ng a spreadsheet, Example 5.
13
(a) a
nd
(b).
201
202
PROBLEMS
Types of Projects
CHAPTER 5 Present Worth Analysis
price
$90,000) show the payback period
to
be between 3 and 4 years, while the NPY results
in
column F (selling price $120,000) indicate PW switching from positive to negative
between 6 and 7 years. The NPY functions reflect the relations presented
in
the hand solu-
tion, except the cost gradient
of
$100 has been incorporated into the costs
in
column B.
If
more exact payback values are needed, interpolate between the
PW
results on
th
e spreadsheet. The values will be the same as in the solution by hand, namely, 3.96 and
6.90 years.
CHAPTER SUMMARY
The present worth method
of
comparing alternatives involves converting a
ll
cash
flows to present dollars at the MARR. The alternative with the numerically larger
(or largest)
PW
value is selected. When the alternatives have different lives, the
comparison must be made for equal-service periods. This
is
done
by
performing
the comparison over either
th
e
LCM
of
lives or a specific study period. Both ap-
proaches compare alterna
ti
ves in accordance with the equal-service requirement.
When a study period
is
used, any remaining value in an alternative is recognized
through the estimated future market value.
Life-cycle cost analysis is an extension
of
PW
analysis performed for systems
that have relatively long lives and a large percentage
of
their lifetime costs
in
the
form
of
operating expenses.
If
the life
of
the alternatives
is
considered to be infi-
nite, capitalized cost
is
the comparison method. The
CC
value
is
calculated as
Ali
, because the
PIA
factor reduces to
Iii
in the limit
of
n =
00
.
Payback analysis estimates the number
of
years necessary to recover the ini-
tial investment plus a stated rate
of
return (MARR). This is a supplemental analy-
sis technique used primarily for initial screening
of
proposed projects prior to a
full economic evaluation by
PW
or some other method.
The
technique has some
drawbacks, especially for no-return payback analysis, where
i = 0% is used as
the MARR.
Finally, we learned about bonds.
Present worth analysis determines if the
MARR
will be obtained over the life
of
a bond, given specific values for the
bond's face value, term, and interest rate.
5.1 What is meant by
service alternative? are (a) independent and (b) mutually
exclusive?
5.2 When you are evaluating projects by
the present worth method, how do you
know which one(s) to select if the projects
5.3 Read the statement in the following prob-
lems and determine if the cash flows define
a revenue
or
a
se
rvice proj
ec
t:
(a)
Problem
2.
12
, (b) Problem 2.31, (c) Problem 2.51,
(d) Problem 3.6,
(e)
Problem 3.10, and
(f)
Pr
o
bl
em 3.14.
5.4 A rapidly growing city is d
ed
icated to
neighborhood integrity. H
oweve
r, increas-
in
g traffic and speed on a through street
are
of
concern to res
id
ent
s.
The
city man-
ager
ha
s proposed five independent op-
tions to slow traffic:
L Stop sign at corner
A.
2. Stop sign at corner B.
3.
Low-profile speed
bump
at point C.
4. Low-profile speed
bump
at
point
D.
5. Speed dip at point
E.
There
cannot be any
of
th
e following com-
binations
in
the final alternatives:
No
combination
of
dip and
one
or
two
bumps
Not two
bump
s
Not
two stop signs
Use
the five independent options and the
restrictions to determine (a) the total num-
b
er
of
mutuall y exclusi ve a
lt
ernati ves pos-
sible a
nd
(b) the acceptable mutually
exclus
iv
e alternatives.
5.5
What
is m
ea
nt by the term equal service?
5.6
What
two approaches can be used to sat-
isfy
th
e equal service requirement?
5.7 Define the term capitalized cost and give a
real-world example
of
something that
might be analyzed using that technique.
Alternative
Comparison-Equal
Lives
5.8 Lennon H
ea
rth Products
manuf
actures
glass-door fireplace scr
ee
ns that have two
types
of
mounting brackets for the frame.
An
L-
shaped bracket is used for relatively
sma
ll
fireplace openings, and
aU-shaped
bracket is used for a
ll
others.
The
com-
pany includes both types
of
brackets in the
PROBLEMS 203
box with the
product
, and the purchaser
discards the
one
not
needed.
The
cost
of
these two
br
ackets with screws and other
parts is $3.50.
If
the frame
of
the fireplace
screen is redesigned, a single universal
bracket can
be
used that will
cost
$ 1.20 to
make. However, retooling wi
ll
cost
$6000.
In addition, inventory
wr
ite-downs will
amount
to another $8000.
If
the
compa
ny
se
ll
s 1
20
0 fireplace units
per
year
, should
th
e
co
mpany keep the old brackets
or
go
with the n
ew
ones, assuming the
company
uses an interest rate
of
15
% per year and it
wants to r
ecover
its investment
in
5 years?
Use
the present worth method.
5.9 Two methods can be used for producing
expansion anchors.
Method
A costs
$80,000 initially and will have a $15,000
sa
lv
age value
af
ter 3 years.
The
operating
cost with this
method
wi
ll
be $30,000 per
year.
Method
B will have a
fir
st cost
of
$120,000, an operating cost
of
$8000 per
year, and a $40,000 salvage va
lu
e after its
3-year life.
At
an
int
erest rate
of
12% per
year, w
hi
ch method
sho
uld be used on the
basis
of
a present worth analysis?
5.10 Sales
of
bottled water in the United States
totaled 16.3 gallons
per
person
in
2004.
Evian Natural Spring Water costs 40¢ per
bottle. A municipal water utility provides
tap water for $2.10 p
er
1000 ga
ll
ons.
If
the
average person drinks 2 bottles
of
water
per day
or
uses 5 gallons per day
in
getting
that amount
of
water
from the tap, what
are the present worth va
lu
es
of
drinking
bottled water
or
tap water p
er
person for
1 year?
Use
an interest rate
of
6%
per year,
compounded monthly, and
30
days per
month.
5.11 A software package created by Navarro
&
Associates can be used for analyzing and
designing three-sided guyed towers
and three- and four-sided self-supporting
towers. A
si
ngle-u
ser
li
cense
will cost
204 CHAPTER 5 Present Worth Analysis
$4000
per year. A site
li
cense
has a one-
time
cost
of
$
15
,000. A structural engi-
neering consulting
company
is
trying to
decide between two alternatives: first, to
buy
one
si
ngle-user license
now
and
one
each year for the next 4 years (which will
provide 5 years
of
service);
or
second, to
buy a site license now. Determine which
strategy shou
ld
be adopted at an interest
rate
of
12% per
year
for a 5-year planning
period, u
si
ng the present worth method
of
eva
lu
ation.
5.
12 A
company
that manufactures amplified
pressure transducers
is
trying to decide be-
tween the machines shown below. Com-
pare them on the basis
of
their present
worth values, using an interest rate
of
15
%
per year.
First cost, $
Annual operating cos
t,
$/year
Overhaul
in
year 3, $
Overhau
lin
year 4, $
Salvage value, $
Life, years
Variable
Speed
- 250,000
-
23
1,000
-
140
,000
50,000
6
Dual
Speed
- 224,000
- 235,000
- 26,000
10,000
6
Alternative Comparison over Different
Time Periods
5. 13
NASA
is considering two materials for
use
in
a space vehicle.
The
costs are
shown below. Which should be selected
on the basis
of
a present worth comparison
at an interest rate
of
10
% per year?
First cost, $
Maintenance cost, $/year
Salvage value, $
Life, years
Material JX Material
KZ
- 205,000
- 29,000
2,000
2
- 235,000
- 27,000
20,000
4
5.14 Two processes can be used for producing a
polymer that reduces friction loss
in
en-
gines. Process K will have a first
cost
of
$160,000, an operating cost
of
$7000 per
quarter, and a salvage value
of
$40,000
after its 2-year life. Process L will have a
first cost
of
$210,000, an operating cost
of
$5000
per quarter, and a
$26,000
salvage
value after its 4-y
ear
life. Which process
should be selected on the basis
of
a present
worth analysis at an interest rate
of
8% per
year,
compounded
quarterly?
5.15 Two methods are under consideration for
producing the case for a portable haz-
ardous material photoionization monitor.
A plastic
case
will require an initial invest-
ment
of
$75,000 and will have an annual
operating cost
of
$27 ,
000
with no salvage
after 2 years. An aluminum case will re-
quire an investment
of
$125,0
00
and will
have annual costs
of
$1 2,000.
Some
of
th
e
equipment
can be sold for $30,000 after
it
s
3-year
life. At an interest rate
of
10% per
year, which case should be used on the
basis
of
a present worth analysis?
5.16
Three
different plans were presented to
the
GAO
by a high-technology facilities
manager for operating a small weapons
production facility. Plan A would involve
renewable I-year contracts with payments
of
$1
million at the beginning
of
each year.
Plan B would be a 2-year contract, and it
would require four payments
of
$600,000
each, with the first
one
to be made now
and the other three at 6-month intervals.
Plan C would be a 3-year contract, and it
would entail a payment
of
$1.5 million
now and another payment
of
$0.5 million
2 years from now. Assuming that the
GAO
could renew any
of
the plans under the
same conditions
if
it wants to do so, which
plan is better on the basis
of
a present
worth analysis at an interest rate
of
6% per
year,
compounded
semiannually?