Buede D.M. The Engineering Design of Systems Models and Methods
Подождите немного. Документ загружается.

causes state transitions both in depth (all sublevels) and in breadth (all
subsystems).
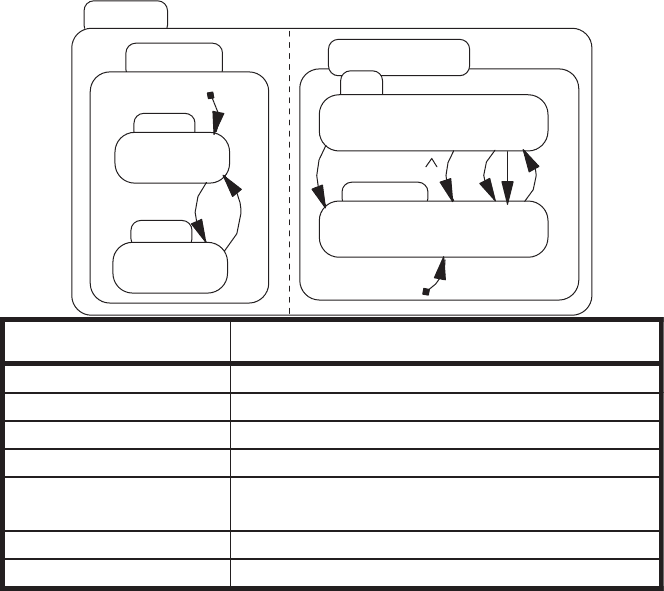
Figure 12.19 depicts the decomposition of ON in Figure 12.17. The circled
‘‘H’’ is the only new concept introduced in this diagram. When the ON state is
entered from the STANDBY state, it automatically reverts to the conditions it
was in before it transitioned to STANDBY. The circled ‘‘H’’ is read as
Historical. If the ON state is entered from the NOT ON state, it defaults to
maintain because there is no historical reference.
Figure 12.20 integrates the statecharts (Figures 12.17–12.19) for the CCS
with the additional decomposition for the STANDBY state shown in Figure
12.17 for SYSTEM STATUS.
When an event such as an interrupt causes a transition from many states to a
single state, an STD implements this with many arrows to depict the effect of a
single event. In a statechart an arrow can go from a state (blob in higraphs)
containing several atomic states (blobs). As a result an interrupt can be shown
with a singl e arrow from an aggregate state, demonstrating how the number of
NOT OFF
INDICATOR
DEAD
ALIVE
c
d
SYSTEM STATUS
ON
STANDBY
vr
f
e
vs
u
ARC LABEL
DEFINITION
c circuit closed (good bulb or fuse)
d circuit open ( bad bulb or fuse)
e brake depressed
f clutch depressed
u wheel revolutions > 7920/ (pi*r) where r
is the wheel radius in inches
vr push button to resume / set
vs push CCS button to standby
FIGURE 12.17 Decomposition of the ‘‘not off’’ State (after Charbonneau [1996]).
12.4 BEHAVIOR MODELING 393
these arrows can be reduced with statecharts. See the transitions between NOT
OFF and OFF in Figure 12.20.
Another extension of statecharts is the ability to nest transitions by using
labels such as a/b. This means that transition ‘‘a’’ will cause another transition
‘‘b.’’ located elsewhere in the statechart, to occur. Harel [1987] calls this
broadcasting because one event can broadcast a trigger that generates a chain
reaction of one or more transitions throughout the statechart.
12.4.4 Control Flow Diagrams
Control flow diagrams (CFDs) are used in conjunction with data flow diagrams
and model changes in the system’s operating mode, thus turning on or off or
restructuring sets of the system’s functions. As defined by Hatley and Pirbhai
[1988], the control structure of a system receives status information from
external systems and sends such information abou t the system to these external
systems. Control flows are typically discrete variables that can be modeled
symbolically.
Control flow diagrams mimic DFDs in syntax and semantics, except for one
additional symbol. In fact, the functional decomposition of the two should be
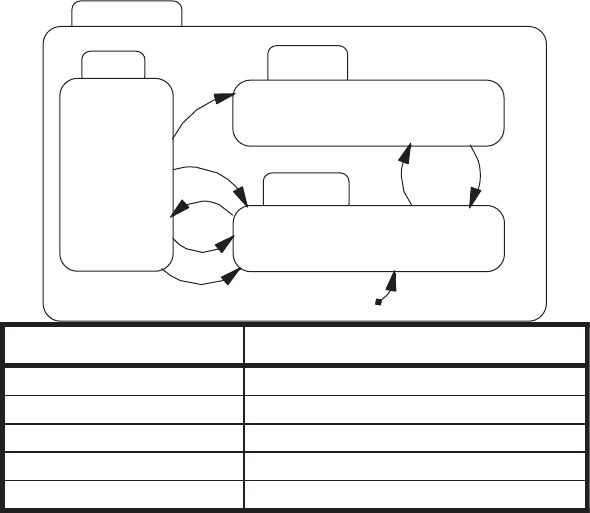
ALIVE
BLINK
OFF
ON
w
w
w
vr
f
e
vs
ARC LABEL DEFINITION
e
brake depressed
f
vr push button to resume / set
vs push CCS button to standby
w depress on/off button
clutch depressed
FIGURE 12.18 Decomposition of the alive state for the indicator (after Charbonneau
[1996]).
394
GRAPHICAL MODELING TECHNIQUES
identical. These two types of diagrams could be superimposed to form a single
diagram; some authors recommend this. There is a context diagram of control
that shows the relationship of the system with the external systems, for
example, the passing of status information concerning the changing of modes.
The control arcs are typically shown as broken lines to distinguish them from
data flow. The additional symbol is a bar or solid line, shown either vertically or
horizontally. All of the bars on a particular diagram represent an FSM
behavior for the functional element being decomposed by the functional
elements shown on the joint DFD/CFD diagram.
12.4.5 Petri Nets
Petri nets (PNs) are based on a rigorous mathematical definition leading to an
executable simulation model and having formal mathematical properties. Petri
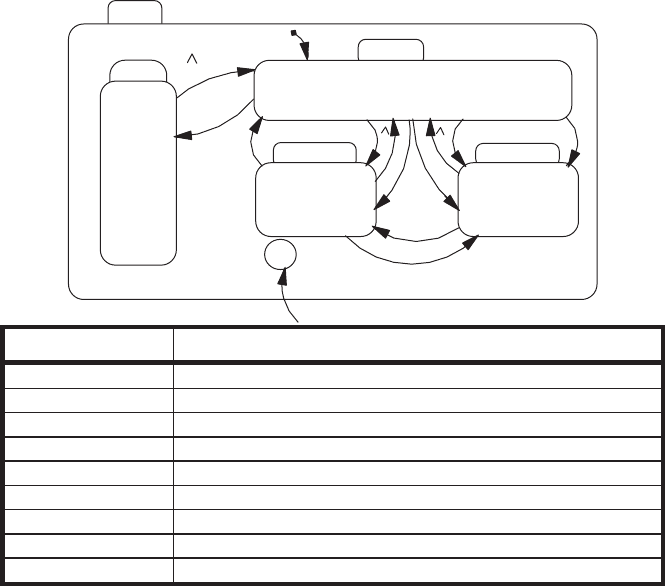
ON
MAINTAIN
ACCELERATE
DECELERATE
H
vr
k
j
i
vd
va
v
v
h
PULSE
h
vd
va
ARC LABEL DEFINITION
h non drive wheel RPM not equal to drive wheel RPM
h(hat) non drive wheel RPM equal to drive wheel RPM
i wheel RPM decrease from set speed
j wheel RPM increase from set speed
k wheel RPM match to set speed
v(hat) release the CCS button
va va = push CCS button to accelerate
vd push CCS button to decelerate
vr push button to resume / set
k
FIGURE 12.19 Decomposition of the ‘‘on’’ state for the INDICATOR (after
Charbonneau [1996]).
12.4 BEHAVIOR MODELING 395
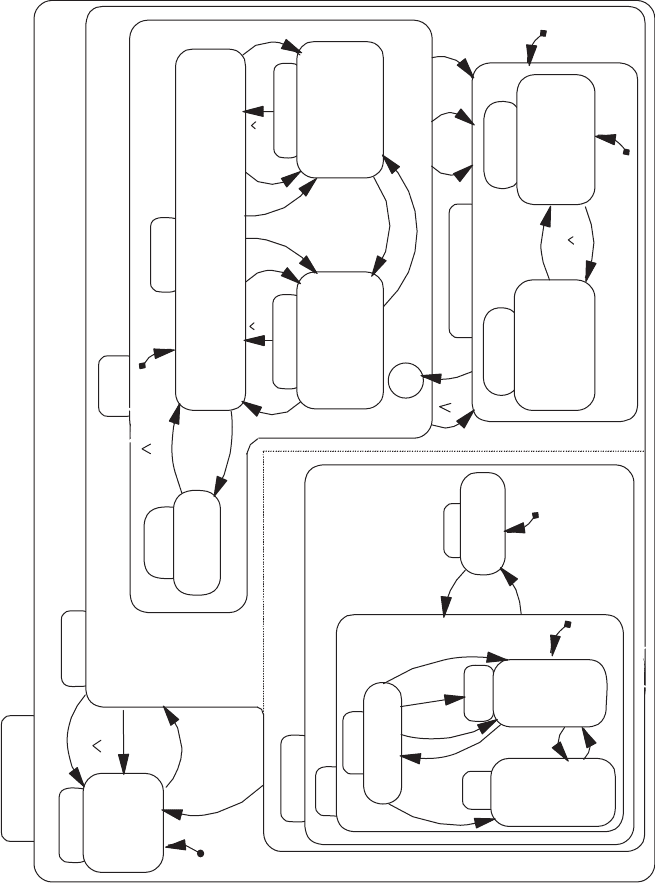
CCS
NOT OFF
INDICATOR
ALIVE
BLINK
ON
OFF
w
w
w
vr
f
e
vs
DEAD
c
d
OFF
w
w
b
m
ON
MAINTAIN
ACCELERATE
DECELERATE
H
k
j
vd
va
va
vd
i
v
v
PULSE
h
h
vr
STANDBY
MEMORY
SET
MEMORY
CLEAR
v
va
e
f
vs
u
k
FIGURE 12.20 Statechart for a cruise control system (after Charbonneau [1996]).
396

nets capture the precedence relations and structural interactions of potentially
concurrent and asynchronous events.
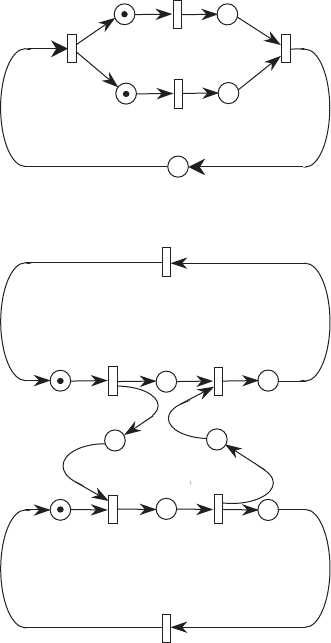
Mathematically, a PN is a bipartite directed multigraph. The two node types
are the place (depicted by a circle) and the transition (depicted by a bar or
rectangle); see Figure 12.21. The arcs are restricted to connect places to
transitions or transitions to places. In addition, PNs contain markings or a
mapping of tokens to places. A transition can fire when a token is present in
each of the places that have arcs entering the transition. So t
1
can fire in the top
half of Figure 12.21; after the firing the transition places one token in each place
that has an arc from the token.
A Petri net is defined a four-tuple, or four sets:
P={p
1
,p
2
, y,p
n
}, the set of places,
T={t
1
,t
2
, y,t
m
}, the set of transitions,
A={P T} , {T P}, the set of input and output arcs,
M={m
1
,m
2
, y,m
n
), the net’s initial markings (drawn as dots).
The state of the PN is defined by the marking. In ordinary PNs, the tokens
are indistinguishable. The existence of one or more tokens at a place indicates
the availability of a resource for the fulfillment of a condition that is associated
with a transition. Figure 12.22 provides two examples of simple systems for
concurrent processing and a simple communications protocol.
There are many extensions of ordinary PNs. Colored PNs allow more than
one type of token; timed PNs allow varying times for the transitions to occur;
and stochastic PNs allow stochastic transitions. See Murata [1989] for a good
overview of this topic.
p1
p2
p3
t1
p1
p2
p3
t1
t1 “fires”.
FIGURE 12.21 Simple Petri net example.
12.4 BEHAVIOR MODELING 397
12.5 SUMMARY
The complete model-based examination of a system requires at least the use of
data, process, and behavior modeling. When using multiple approaches to
model a single system, balancing or aligning the elements of the multiple
models is critical. Several approaches for each of these model categories were
presented in this chapter.
Data modeling is the specification of data entities and relationships bet-
ween pairs of entities at a minimum. In addition attributes of each data entity
can be developed. Entity relationship diagrams provide the basic data
modeling capability and are probably the most widely used of the data
modeling techniques. Higr aphs extend the data modeling of ER diagrams by
p
2
t
1
p
1
t
2
t
3
p
3
p
4
t
4
p
5
begin end
Concurrent Processing
Sim
p
le Communication Protocol
Wait
for ack.
Process 1
Ready
to send
Ack.
received
Message
received
Process 2
Ready
to receive
Ack.
sent
Send
Message
Buffer
full
Buffer
full
Receive
Message
Send
ack.
Receive
ack.
FIGURE 12.22 Petri net models of simple system architectures (after Murata [1989]).
398
GRAPHICAL MODELING TECHNIQUES
adding the representation of subset and cross-product relationships among
entities.
The three process modeling techniques covered in this book are IDEF0
(see Chapter 3), data flow diagrams, and N
2
charts. Each of these techni ques
captures the relationship among functions in the functional decomposition by
representing the transformation of inputs into outputs. The N
2
charts are the
simplest but least graphic al representation of a process model. Data flow
diagrams are widely used but least standardized of all of the modeling
techniques discussed in this book. IDEF0 was quite standardized since it
was created in the 1970s; the National Institute of Standards and Technology
(NIST) has created a FIPS for IDEF0, thus making an IDEF0 model easy to
read and comprehend. Distinctions between these techniques are that IDEF0
defines at least one control item for each function while the other techniques
treat control items as inputs or ignore them. IDEF0 also includes the
construct of a mechanism to represent the resources that execute the function,
making it the only process modeling technique general enough to represent
portions of the allocated architecture of the system. The control could be a
trigger to activate the function or policy instructions for implementing the
function. Data flow diagrams contain the concept of a data store that is
useful during design to define which data elements will be contained in a
specific database.
Five modeling techniques for behavior modeling were described in this
chapter. FFBDs were described in Chapter 3. Control flow diagrams are the
simplest and by far the least useful. Control flow diagrams add the concept of
transitions to data flow diagrams, which suggests that the system modes and
functions are identical. While this assumption may be useful in simple systems
and software products, it is very limiting in most real systems of hardware,
software, and other resources. Behavior diagrams come from the systems
engineering discipline and add FFBD control structures on top of a process
model to represent serial, concurrent, repetitive, and replicated process
execution as well as the rule-based selection of functional outputs. While no
formal mathematical model has been published to define these control
structures, they have been implemented in software, suggesting that such a
formal model exists and could be specified. Finite-state machines and state-
transition diagrams are used in other engineering disciplines, but are not
sufficiently general to capture the rich behavior possible in a complex system,
for example, concurrent processing. Statecharts are a generalization of state-
transition diagrams that enable many of these limitations to be overcome but
still provide a limited semantics and syntax for modeling complex systems.
Petri nets are the only behavior modeling technique with an underlying
mathematical model that defines what can be done and provides analytical
results without simulation. Unfortunately, Petri net models are quite sophis-
ticated and are not likely to be employed on a widespread basis in the
engineering discipline for systems until their potential benefits are much better
justified and become widely known.
12.5 SUMMARY 399
PROBLEMS
12.1 Expand the ER model in Figure 12.4 to be a complete representation of
the entities and classes discussed in Chapter 2 for the systems
engineering process.
12.2 Create a higraph that is a complete version of Figure 12.4.
12.3 Create a complete behavior diagram model of the process of engineer-
ing a system based upon the IDEF0 model of the engineering of a
system in Appendix B.
12.4 Create a statechart for the functioning of the air bag system from the
time the driver turns the car on until an accident occurs that activates
the air bag or the driver turns the car off.
400 GRAPHICAL MODELING TECHNIQUES

Chapter 13
Decision Analysis
for Design Trades
13.1 INTRODUCTION
Decision making is a process undertaken by an individual or organization.
The intent of this process is to improve the future position of the individual
or organization in terms of one or more criteria. Most scholars [Howard,
1968] of decision making define this process as one that culminates in an
irrevocable allocation of resources to affect some chosen change or the
continuance of the status quo. The most commonly allocated resou rce is
money, but other scarce resources are goods and services and the time and
energy of talented people.
Watson and Buede [1987] have identified three primary decision modes:
choosing one alternative from a list, allocating a scarce resource(s) among
competing projects, and negotiating an agreement with one or more adver-
saries. Decision analysis is the common analytical approach for the first mode,
optimization for the second, and a host of techniques have been applie d to
negotiation decisions [Jelassi and Foroughi, 1989]. Concepts of decision
analysis are relevant to the second and third of these modes.
Section 13.2 provides a philosophical discussion of decision making and the
elements of decision making: values, alternatives, and facts. Section 13.3
explains the rational basis of decision analysis in terms of a set of axioms
that provide a compelling structure for some decision makers. Section 13.4
provides an analytical basis for modeling stakeholder values in the face of
conflicting objectives, a critical element in design decisions when faster, better,
The Engineering Design of Systems: Models and Methods, Second Edition. By Dennis M. Buede
Copyright
r 2009 John Wiley & Sons, Inc.
401
and cheaper are all desir ed but not mutually compatible. Section 13.5 discusses
the modeling of uncertainty and risk preference for design decisions; decision
trees, relevance diagrams, and influence diagrams are introduced as modeling
tools. A sample application focused on the development of trade-off require-
ments consistent with an objectives hierarchy and performance requirements is
presented in Section 13.6; this sample application is based upon a real
application of decision analysis to requirements development.
This chapter describes a model of uncertainty (probability theory), a model
of value (multiattribute value theory), a model of risk preference (utility
theory), and a normative model for incorporating uncertainty, value, risk
preference, and complexity for aiding the thought and conversation process
needed to make explicit, rational decisions.
13.2 ELEMENTS OF DECISION PROBLEMS
Decision analysis is a normative theory for making a decision (an irrevocable
allocation of scarce resources). The three major elements of a decision
that make its resolution troublesome are the creative generation of alternatives,
the identification and quantification of multiple conflicting criteria, and the
assessment and analysis of uncertainty associated with the what is known and
not known about the decision situation. How ard [1993] has drawn an analogy
between the model building and analysis processes inherent in decision analysis
and a conversation with a decision maker. The conversation (or modeling)
needs to address what the de cision maker (stakeholders in systems engineering)
cares about (values), what the decision maker can do (alternatives), an d what
the decision maker knows (facts or absence thereof).
Many stakeholders and systems engineers claim to be troubled by the
feeling that there is an, as yet unidentified, alternative that must surely be
better than those so far considered. The development of techniques for
identifying such alternatives is receiving considerable attention [Elam and
Mead, 1990; Friend and Hickling, 1987; Keller and Ho, 1988; Keeney, 1992;
West, 2007].
Ample research [von Winterfeldt and Edwards, 1986] has been undertaken
to identify the pitfalls in assessing probability distributions that represent the
uncertainty of a stakeholder. Research has also focused on the identification of
the most appropriate assessment techniques. Similar research [von Winterfeldt
and Edwards, 1986] has focused on assessing value and utility functions.
Keeney [1992] has recently advanced concepts for the development and
structuring of a value hierarchy for key decisions. While it will never be
possible to turn decision support via decision analysis over to a computer, the
vast number of real-world applications of decision analysis [Kirkwood and
Corner, 1993] demonstrate that this analyt ic modeling support is well worth the
time and effort.
402 DECISION ANALYSIS FOR DESIGN TRADES