Buede D.M. The Engineering Design of Systems Models and Methods
Подождите немного. Документ загружается.


curves are continuous. If the value curves change significantly afte r trade offs
have been used, the weigh ts have to be reassessed.
SIDEBAR 13.2 AHP EXAMPLE
Returning to the example of design trade offs for a communica tion
system, suppose the stakeholders provide the judgments shown in the
following table into the AHP verbal mode.
Throughput Availability Operating
Life
Procurement
Cost
Operating
Cost
Throughput (Equal) 1 2 4 6 (Absolutely)
9
Availability 1/2 (Equal) 1 4 (Strongly) 5 (Absolutely)
9
Operating
Life
1/4 1/4 (Equal) 1 (Weakly) 3 (Strongly) 5
Procurement
Cost
1/6 1/5 1/3 (Equal) 1 2
Operating
Cost
1/9 1/9 1/5 1/2 (Equal) 1
The normalized eigenvector of the largest eigenvalue for the numerical
version of the above matrix is 0.43, 0.39, 0.11, 0.03, and 0.01. (Note that
the AHP process associates a 9 with absolutely, 7 with very strongly, 5
with strongly, 3 with weakly, and 1 with equal.)
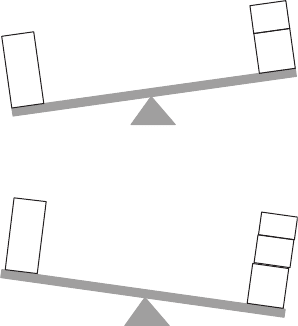
The balance beam approach is another approach for assessing the weights of
the objectives (see Sidebar 13.3). The stakeholders are initially asked to establish
a rank order of the overall swing weights of the objectives. Next, a series of
questions is posed to the stakeholders that begins with ‘‘Is the overall swing in
value of the first objective (a) greater, (b) less than, or (c) equal to the combined
overall swing in values of the second and third most important objectives?’’ To
illustrate this question a balance beam analogy (see Fig. 13.2) is used. If the
stakeholders respond that the first ranked objective has the highest overall swing
weight, the attractiveness of the other choice is increased by adding the fourth
ranked objective to the package of the second and third ranked objectives. If the
stakeholders say the package of second and third ranked objectives has a higher
swing value than the first ranked objective, the attractiveness of the combination
package is decreased by dropping the third ranked objective and adding the
13.4 MULTIATTRIBUTE VALUE ANALYSIS 413

fourth ranked objective. This process is continued until the stakeholders have
found a package of objectives with an overall swing in value that is comparable
to the first ranked objective. Next, the second ranked objective is compared with
the third and fourth ranked objectives. This continues until only the last two
objectives remain. The process creates a set of inequality and equality equations
that relate the swing weights of the objectives. Typically, a weight of 1 is assigned
to the least weighted objective, the stakeholders are asked to assign a swing
weight to the second least weighted objective, and then the equations are used to
bound the swing weights of the remaining objectives. It is possible that there will
be an inconsistency in a subset of the equations. If such an inconsistency exists,
the balance beam questions posed by this subset of equations are reexamined
until the stakeholders identify their inconsistency and make an adjustment.
This approach generally produces a wide spread in the swing weights for the
objectives.
SIDEBAR 13.3: BALANCE BEAM EXAMPLE
Using the balance beam approach for the communication system design
the stakeholders are asked to compare the swing in benefit of throughput
(T ) to that of the combined swings of availability (A) and operating life
(OL). The stakehol ders respond the combination is greater than that of
throughput, or
ToA þ OL
However, throughput (T ) is preferred to availability (A) and procure-
ment cost (PC):
T4A þ PC
Availability is preferred to OL, PC, and operating cost (OC):
A4OL 1 PC þ OC
OL is preferred to PC and OC:
OL4PC þ OC
Next, the unnormalized weight of operating cost is fixed at 1 and the
stakeholders are asked to provide a ratio weight for procurement cost;
suppose they say 1.5. Now the weight for operating life is greater than 2.5,
suppose the stakeholders say 3. The stakeholders now know that the
weight for availability is greater than 4.5 (3 + 1.5) and agree to a weight
of 6. Finally, the weight of throughput is between 7.5 (6 + 1.5) and 9
(6 + 3). The stakeholders choose 8. The normalized weights are 0.41,
0.31, 0.15, 0.08, and 0.05.
414 DECISION ANALYSIS FOR DESIGN TRADES
Graphical elicitation procedures have been implemented in several software
packages for the elicitation of scores and weights. Bar graph adjustment is most
commonly used, but some software packages contain adjustable pie charts,
where the wedges of the pie represent different objectives.
13.5 UNCERTAINTY IN DECISIONS
This section addresses the analysis of decisions when there is substantial
uncertainty associated with outcomes impacting the relative value of the
decision’s alternatives. In systems engineering this uncertainty could be asso-
ciated with the state of technology at some time in the future; the stakeholders’
needs now and in the future; the ability to achieve cost, schedule, or performance
goals; and environmental variables associated with the use or testing of the
system.
Probability theory is discussed in Section 13.5.1 to refresh the reader’s
knowledge of this subject. Section 13.5.2 discusses the use of relevance
diagrams to represent joint probability distributions. Influence diagrams are
introduced in Section 13.5.3 as a way of representing a decision. The calcula-
tions of expected utility are described in terms of decision trees. Section 13.5.4
addresses risk preference.
13.5.1 Probability Theory
This section is not meant to be a detailed introduction to probability theory; for
such an introduction see Roberts [1992] and Ghahramani [1996]. The reader is
B
C
A
B
C
A
D
FIGURE 13.2 Balance beam analogy for paired comparisons.
13.5 UNCERTAINTY IN DECISIONS 415
assumed to be familiar with the concepts of probability density functions for
continuous random variables, probability mass fun ctions for discrete random
variables, the difference between marginal and conditional probability distri-
butions, the notion of cumulative probability distributions, and joint prob-
ability distributions of two or more random variables. First, the concepts of
probabilistic independence and dependence are discussed. Then two important
equations, the law of total probability and Bayes rule, are provided. Finally,
relevance diagrams are introduced as a way to describe the probabilistic
dependencies among a set of random variables. This entire discussion will be
conducted in terms of discrete random variables because the mathematics is
easier to convey, and discrete random variables are more commonly encoun-
tered is systems engineering problems. In addition, decision analysis commonly
discretizes continuous random variables for computational ease.
The probabili stic independence of two rando m variables, X and Y, is defined
to occur when the conditional probability distribution on X given Y equals the
marginal probability distribution on X. It can be shown that when the
preceding is true for X, then the probability distribution on Y given X must
also equal the probability distribution on Y. As a result, the joint probability
distribution of instances of X, x
i
, and Y, y
i
, can be written as
pðx
i
; y
j
Þ¼pðx
i
jy
j
Þpðy
j
Þ¼pðy
j
jx
i
Þpðx
i
Þ¼pðx
i
Þpðy
j
Þð13:9Þ
when X and Y are probabilistically independent. Intuitively, probabilistic
independence means that learning the value of X does not cause us to change
our probability distribution about Y.
The law of total probability allows the computation of a marginal probability
distribution of one random variable by summing over all possible values of a
second random variable that is probabilistically dependent on the first. This
law is used to compute p(x
i
) when the probabilities on the right-hand side of
Eq. (13.10) are known bette r than p (x
i
) (shown in Fig. 13.3):
pðx
i
Þ¼
X
m
j¼1
pðx
i
jy
j
Þpðy
j
Þð13:10Þ
Bayes rule is used to update our uncertainty on one random variable when
information about another random variable becomes available, assuming the
y
1
y
2
y
3
y
4
y
5
y
6
x
i
FIGURE 13.3 x
i
as a subset of the universal event, which is partitioned by Y.
416
DECISION ANALYSIS FOR DESIGN TRADES

two random variables are probabilistically dependent on each other.
pðy
j
jx
i
Þ¼
pðx
i
jy
j
Þpðy
j
Þ
P
n
i¼1
pðx
i
jy
j
Þpðy
j
Þ
¼
pðx
i
jy
j
Þpðy
j
Þ
pðx
i
Þ
ð13:11Þ
In the case of Eq. (13.11) information about the value of random variable X is
obtained and is used to update our uncertainty about Y. The left-hand side of
Eq. (13.11) is called the posterior probability distribution of Y when all values
of j =1, 2, y m are considered. The p(y
j
) in the numerator on the right-hand
side of (13.10) is called the prior probability, the probability of Y before
information on X became available. The values of p(x
i
|y
j
) in the numerator and
denominator are called the likelihood values of getting information on X given
values of Y. Finally, the denominator of Eq. (13.10) is called the preposterior
and is in fact equal to p(x
i
), as computed by the law of total probability
[Eq. (13.10)]. The contrast between the law of total probability and Bayes rule
can be seen by revisiting Figure 13.3. With the law of total probability the
task is to compute the probability of a subset of the universal event using
conditional probabilities that partition the univers al event. With Bayes rule the
universal event has been redefined based upon a new state of information,
namely x
i
is known to be true. Bayes rule provides the process for updating the
probability of any variable based upon this new information.
Adoption of Bayes rule in practice requires a philosophical shift in the
meaning of probabilities for most people. The most common philosophical
interpretation of probability among engineers and statisticians is that of a long-
run frequency associated with a set of events that have been or could be
repeated many times, for example, flipping coins, removing production samples
from a production line. However, in systems engineering the engineer of a
system is typically involved in very early design decisions regarding the
operational system, the test system for the operational system, the manufactur-
ing system of the operational system, the test system for the manufacturing
system of the operational system, and so forth. In these early design decisions
there is typically a great deal of uncertainty about specific outcomes related to
these decisions and very little data. In fact, it is often not possible to
contemplate repeating experiments to develop long-run frequencies within a
reasonable amount of time and money. Bayesian, or subjective, probability
interprets a probability as a state of information about the uncertainty
regarding a variable. Powerful mathematical and logical arguments have
been put forward by Savage [1954], De Finetti [1974], Lindley [1994], and
others for this interpreta tion of probability. Now that the computational power
that we have on our desks is quite sizabl e, many theoreticians are becoming
Bayesians due to the theoretical justification of the Bayesian argument. Yet
many of these Bayesian converts still prefer to put uniform priors on the
random variables and let the data shape the posterior distributions. This is
fine when there is a lot of data, as there is late in the systems engineering
13.5 UNCERTAINTY IN DECISIONS 417
development process. Early in the development process there is precious little
data and uniform priors are not consistent with engineer ing judgment and
likely to lead to poor design decisions. There is a vast amount of research
available on the ability of humans to provide probability judgments [Hogarth,
1980; Kleindorfer et al., 1993; Wright and Ayt on, 1994]. Serious probability
elicitation processes have been developed and used extensively with successful
results [Spetzler and Stael von Holstein, 1975; Merkhofer, 1987].
Bayes rule is useful during the design phase in systems engineering when
there is little hard data available. During this phase there are often significant
results available from analyses and simulations; these results are appropriately
considered as data, making Bayes rule an appropriate tool.
Bayes rule has wide applicability in the world of testing. Before the test we
have some uncertainty about the ultimate value of certain performance, cost, or
schedule parameters. Data is collected during the test regarding the values of
certain system or project characteristics that relate to the parameters of interest.
These data should then be used to update our uncertainty about the parameters
of interest. Test data should always be viewed as likelihood measures. All too
often, the test result is viewed to be the answer, and only the data parameter
associated with the largest likelihood value is reported.
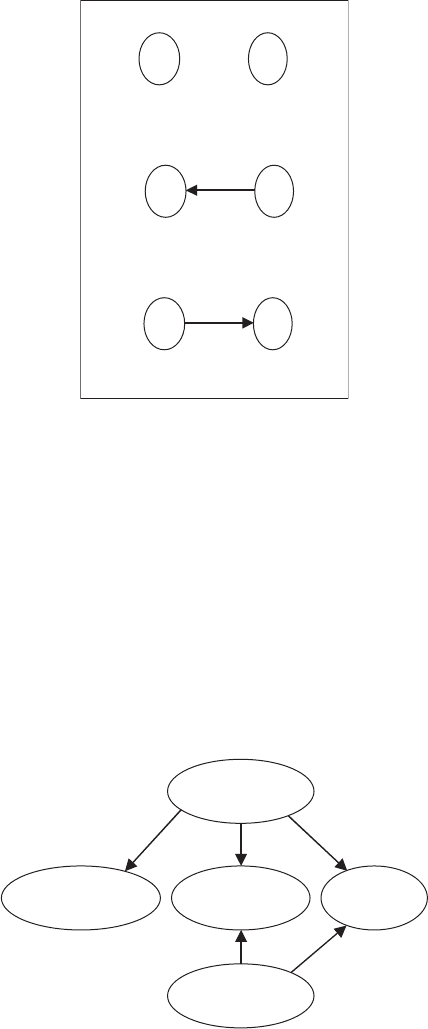
13.5.2 Relevance Diagrams
A relevance diagram is a directed graph, or digraph, that is a statement of the
joint probability distribution among a set of random variables as a factoriza-
tion of conditional and marginal probability distributions. For example, the
three possible factorizations of two random variables, X and Y, are shown
in Figure 13.4. Each random variable is shown as a node with an oval
encapsulation. The top case shows two probabilistically independent rand om
variables; the absence of an arc indicates this independence. The next two cases
show dependence or relevance in a Bayesian sense of probabilistic updating; the
arc can go in either direction, with the direction reflecting a different condi-
tional and marginal distribution that define the joint distribution. It is obvious
from this simple graph that the arc in the bottom two graphs can be flipped
(have its direction changed) without any repercussions. However, this is not
true in general. A relevance diagram cannot have a cycle (see Chapter 5 for a
definition), so flipping an arc that causes a cycle to form is never possible. In
addition, when flipping an arc does not cause a cycle to be formed, it is possible
that arcs will have to be added to the digraph [see Shachter, 1986].
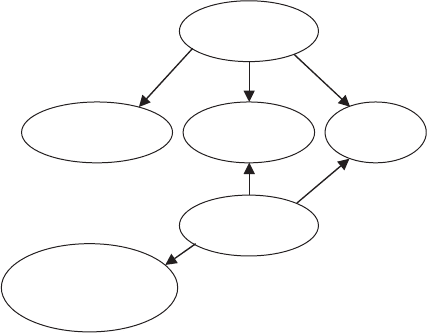
As an example of relevance diagrams for systems engineering, consider an
elevator design in which the state of technology related to control systems and
power systems is highly uncertain in the time frame of the development effort
(Fig. 13.5). The key performance requirements (design objectives) are elevator
performance in terms of mean wait times; the operational cost of the system;
and the availability of the elevator system. A relevance diagram depicting
the probabilistic dependencies is shown in Figure 13.5. Note that there is no
418 DECISION ANALYSIS FOR DESIGN TRADES
dependence between the three key performance requirements; these three
variables are probabilistically independent of each other given the states of
control technology and power technology. This is called conditional indepen-
dence; if the variables for the control and power technologies were not present,
there would be edges between the three requirements nodes (performance,
availability, and cost). As discussed in previous chapters, there is great power to
be gained in communicating the structure of reasoning (modeling) about design
issues by using a graphical representation such as relevance diagrams.
X Y
p(x
i
, y
j
) = p(x
i
) p(y
j
)
X Y
p(x
i
, y
j
) = p(x
i
|y
j
) p(y
j
)
X Y
p(x
i
, y
j
) = p(y
j
|x
i
) p(x
i
)
FIGURE 13.4 Relevance diagrams for two variables.
Control
Technology
Elevator
Performance
Elevator
Availability
Elevator
Cost
Power
Technology
FIGURE 13.5 Notional relevance diagram for elevator design.
13.5 UNCERTAINTY IN DECISIONS 419
As mentioned above, test results always provide likelihood information for
Bayes rule. As a result, a relevance diagram that includes test results will have
arcs going to the test result from the variable relevant to the test. A survey of
power technology to assess the possible state of power technology in two years
is an example of test data for the elevator design problem. This test data would
be shown as a node with an arc coming to it from the Power Technology node
in Figure 13.6. Bayes rule would then be used to flip this arc so that the survey
results could be incorporated in the decision being made.
13.5.3 Influence Diagrams and Decision Trees
Consider a standar d design decision faced by systems engineers: Should a
component for the system be bought from an existing supply source or be
developed from more basic components? The uncertainty that may be most
troublesome in this decision is how long it will to take to develop the major
component and how much will it cost. The schedule and cost results could be
better than, equal to, or worse than the result associated with purchasing the
component. For this simple example assume the performance of both alter-
natives is equal. A decision tree depicting this decision is shown in Figure 13.7.
The value computation at the end of each branch of the tree addresses the cost
and schedule issues via a multiattribute value formulation. The decision node at
the beginning of the tree depicts the two alternatives as branches emanating
from a small square. After the Build alternative there are chance nodes (little
circles) that represent the uncertainties concerning cost and schedule. The tree
is ‘‘rolled back’’ by multiplying the value at the end of each branch times the
probability value on the branch just before it. These probability-weighted
Control
Technology
Elevator
Performance
Elevator
Availability
Elevator
Cost
Power
Technology
Survey Results
on Power
Technology
FIGURE 13.6 Relevance diagram with survey data on power technology.
420
DECISION ANALYSIS FOR DESIGN TRADES
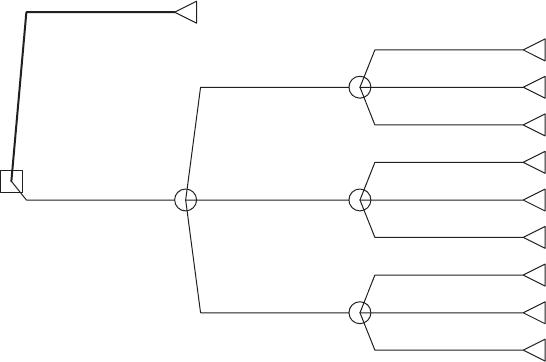
values are summed at each chance node to get an expected value at that node.
These expected values are then multiplied by the probabilities on the branches
before them and summed again. This process continues until the expected value
of each alternative is available at the decision node. The preferred alternative
should be the one with the highest expected value.
Influence diagrams are a graph-theoretic representation of a decision.
Shachter [1986, 1990] presented the requirements and algorithms needed to
transform an influence diagram from solely a communication tool into a
computation and analysis tool capable of replacing the standard decision
analysis tree. Significant additional research continues into influence diagrams
for structuring decision problems, defining the underlying mathematics and
graph theory of influence diagrams, and analyzing decision problems. When
properly implemented, decision trees and influence diagra ms provide identical
solutions to the same problem. They are referred to as isomorphic since the
decision tree can be converted to an influence diagram, and vice versa.
An influence diagram may include four types of nodes (decision, chance,
value, and deterministic), directed arcs between the nodes, a marginal or
conditional probability distribution defined at each chance node, and a
mathematical function associated with each decision, value, and deterministic
node. Each decision node, represented by a box, has a discrete number of states
(or decision alternatives) associated with it; chance nodes, represented by an
oval, must be discrete random variables. Deterministic nodes are represented
by a double oval. A value node may be represented by a roundtangle, diamond,
hexagon, or octagon.
An arc between two nodes (shown by an arrow) identifies a dependency
between the two nodes. An arc between two chance nodes expresses relevance
Buy
0.5
[0.5]
Low
1 .500
[1]
Nominal
0.85 .500
[0.85]
High
0.7 .000
[0.7]
Build_Schedule
Low
.100
[0.925]
Low
0.65 .250
[0.65]
Nominal
0.5 .500
[0.5]
High
0.35 .250
[0.35]
Build_Schedule
Nominal
.700
[0.5]
Low
0.3 .100
[0.3]
Nominal
0.15 .500
[0.15]
High
0 .400
[0]
Build_Schedule
High
.200
[0.105]
Build_Cost
Build [0.4635]
Buy_vs__Build
[0.5]
FIGURE 13.7 Decision tree for buy vs. build decision.
13.5 UNCERTAINTY IN DECISIONS 421
and indicates the need for a conditional probability distribution. An arc from a
decision node into a chance or deterministic node expresses influence and
indicates probabilistic or functional dependence, respectively. An arc from a
chance node into a deterministic or value node expresses relevance; that is to
say, the function in either the deterministic or value node must include the
variables on the other ends of the arcs. An arc from any node into a decision
node indicates information availability; that is, the states of these nodes are
known with certainty when the decision is to be made.
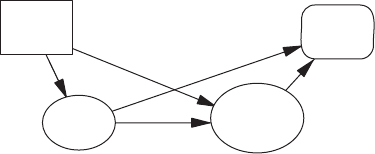
Figure 13.8 shows an influence diagram for the buy versus develop decision
described in the decision tree of Figure 13.7. The decision is represented in the
box, the value node in the box with rounded corners, and the two chance nodes
in ovals. Note that the alternatives and chance outcomes that were shown in the
decision tree are not visible in the influence diagra m. However, the edges in the
influence diagram provide new information that was not readily available in
the decision tree, namely the probabilistic and value dependencies inherent in
the decision. Both cost and schedule are dependent on which alternative is
selected. Cost and schedule are also probabilistically dependent on each other,
with the influence diagram showing an arc from Build Cost to Build Schedule.
Value only depends on cost and schedule.
The decision node represents a logical maximum (minimum) operation, that
is, choose the alternative with the maximum (minimum) expected value or
utility (cost). A deterministic node can contain any relevant mathematical
function of the variables associated with nodes having arcs into the determi-
nistic node. A value node also can contain any mathematical function of the
variables with arcs entering the value node. In addition, the mathematical
function in the value node defines the risk preference of the stakeholder.
A well-formed influence diagram meets the foll owing conditions: (1) the
influence diagram is an acyclic directed graph, that is, it is not possible to start
at any node and travel in the direct ion of the arcs in such a way that one retur ns
to the initial node; (2) each decision or chance node is defined in terms of
mutually exclusive and collectively exhau stive states; (3) there is a joint
probability distribution that is defined over the chance nodes in the diagram
that is consistent with the probabilistic dependence defined by the arcs; (4) there
is at least one directed path that begins at the originating or initial decision
node, passes through all the other decision nodes, and ends at the value node;
Value
Build
Cost
Build
Schedule
Buy vs.
Build
FIGURE 13.8 Influence diagram for build-buy decision.
422
DECISION ANALYSIS FOR DESIGN TRADES