Carranza E. Geochemical anomaly and mineral prospectivity mapping in GIS
Подождите немного. Документ загружается.

90 Chapter 4
where δ denotes that the perimeters and areas are measured using a common yardstick in
the box-counting method (Fig. 4-1). The exponent DAP is a fractal dimension associated
with both perimeter and area and it satisfies the relation (Cheng et al., 1994):
A
P
AP
D
D
D
2
=
. (4.2)
where DP and DA are fractal dimensions of perimeter and area, respectively. The
relations in equations (4.1) and (4.2) are independent of length of the yardstick (δ).
The log-log plot of the perimeter-area relationship for a series of contours of “high”
Fe values is shown in Fig. 4-5A. The perimeters and areas for different contours of
“high” Fe values are measured using the same yardstick of 10 m, which is equivalent to
the side of a pixel used in raster-based GIS operations for this example. Perimeter length
was determined by first converting into polygons the series of raster binary maps defined
by different contours of “high” Fe values. The straight line in the log-log plot (Fig. 4-
5A) is obtained by a least squares fit through the points. The value of D
AP
estimated by
equation (4.1) is 1.4904.
For a geometrical pattern in two-dimensional space with “true” perimeter P
0
, and
“true” area A
0
, the estimated perimeter P(δ) and estimated area A(δ) when the box-
counting method with yardstick δ is used can be expressed, respectively, as (Cheng et
al., 1994):
)1(
0
)(
P
D
PP
−
δ=δ , and (4.3)
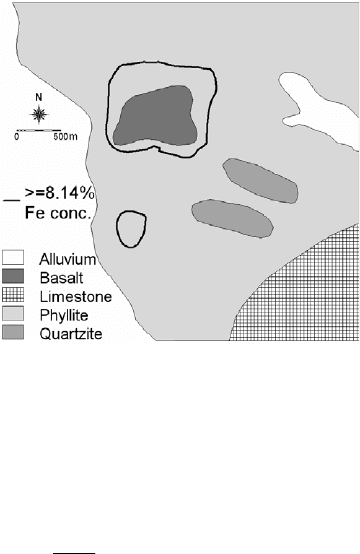
Fig. 4-4. Lithologic map and outline of areas with “high” Fe values (>8.14%) defined from the
concentration-area plot (Fig. 4-3).
Fractal Analysis of Geochemical Anomalies 91
)1(
0
)(
A
D
AA
−
δ=δ . (4.4)
If DP can be determined from equation (4.3), then DA can be estimated from the relation
in equation (4.2). Similarly, if DA can be determined from equation (4.4), then DP can
be estimated from the relation in equation (4.2).
For our example areas of “high” Fe values, Fig. 4-5B shows the estimated perimeters
using different yardsticks in the box-counting method. The straight lines in the log-log
plot (Fig. 4-5B) are obtained by least squares fit through the linear parts of the plot. The
estimated perimeters seem to have two fractal dimensions. The first one (D
P1
=1.0841)
for yardsticks less than 35 m is equivalent to the so-called “textural” fractal dimension
(cf. Kaye, 1989, p.27; Cheng et al., 1994), which is close to 1 for surfaces assumed and
explainable as a result of smoothing during interpolation. The second one (D
P2
=1.4935)
obtained by using yardsticks equal to or greater than 35 m, which is equivalent to the so-
called “structural” fractal dimension (cf. Kaye, 1989, p.27; Cheng et al., 1994), is
probably a more realistic geometry of the areas of “high” Fe values.
The D
P2
(=1.4935) and the D
AP
(=1.4904) may be used to estimate D
A
using the
relation in equation (4.2). In that case, D
A
= 2.0042. This estimate of the fractal
dimension of the areas of “high” Fe values is in agreement with the proposition of Cheng
et al. (1994) that, theoretically, D
A
cannot be greater than 2. In addition, Cheng (1995)
found that if, and only if, D
A
= 2 can D
AP
(equation (4.2)) be used to obtain an unbiased
estimate of D
P
. Inasmuch as our estimate of D
A
is very close to 2, then D
P2
is a very good
estimate of the fractal dimension of the perimeters of the areas of “high” Fe values based
on the perimeter-yardstick relation (Fig. 4-5B).
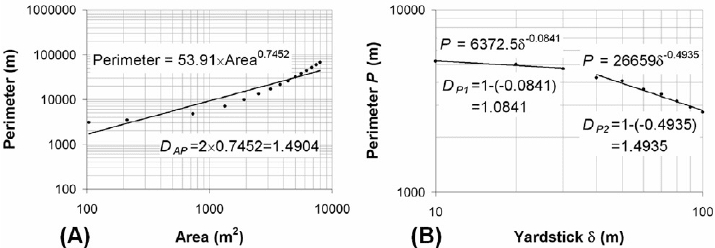
Fig. 4-5. (A) Perimeter-area relationship, plotted on a log-log graph, for a series of contours o
f
“high” Fe values greater than the threshold of 8.14%. (B) Plots, on a log-log graph, of estimates
perimeters of areas of “high” Fe values using variable yardstick.
92 Chapter 4
Multifractality of geochemical landscapes
The two line segments fitted to the log-log plot of the concentration-area relationship
(Fig. 4-3) indicate that there are at least two sets of fractal patterns in the soil Fe data.
This suggests that geochemical landscapes can be multifractals. A multifractal is
considered to be spatially intertwined sets of monofractals (Feder, 1988; Stanley and
Meakin, 1988). Whereas monofractals are characterised by one fractal dimension and
thus apply to binary patterns, multifractals have different fractal dimensions and thus
apply to patterns with continuous spatial variability (Agterberg, 1994, 2001). As the
subset of “high” Fe value can be characterised by a fractal dimension, so can the subset
of “low” Fe values, although this is not to say that either subset is a monofractal because
they both have continuous spatial variability. Thus, the multifractality of geochemical
landscapes can be related to the probability density distributions and spatial distributions
of geochemical data (Cheng and Agterberg, 1996; Gonçalves, 2001; Wei and Pengda,
2002; Panahi and Cheng, 2004; Xie and Bao, 2004; Shen and Cohen, 2005), which are
influenced by various processes that have occurred throughout geological time at various
rates and at various scales (e.g., Rantitsch, 2001). If that is the case, then the
concentration-area relation introduced earlier is appropriately a multifractal model,
which can be used to separate geochemical anomalies from background as proposed
originally by Cheng et al. (1994). The concentration-area fractal method has been
demonstrated by several workers to map significant anomalies using various
geochemical sampling media (e.g., Cheng et al., 1996, 1997, 2000; Cheng, 1999b; Sim
et al., 1999; Gonçalves et al., 2001; Panahi et al., 2004) and is reviewed and further
demonstrated here.
THE CONCENTRATION-AREA METHOD FOR THRESHOLD RECOGNITION
The following discussion of the concentration-area method for separation of
geochemical anomalies from background is adapted from Cheng et al. (1994). For a
series of contours of uni-element concentrations, the concentration contours v and the
areas of uni-element concentrations equal to or greater than v or the areas enclosed by
each contour [i.e., A(v)] satisfy the following power-law relation if they have
multifractal properties:
α−
∝≥ vvA )( (4.5)
where ∝ denotes proportionality and the exponent α represents the slope of a straight
line fitted by least squares through a log-log plot of the relation. If, on the one hand, the
concentration-area relation represents a fractal model, then the log-log plot can be fitted
by one straight line and thus by one value of α corresponding to the whole range of v,
representing a group of similarly-shaped concentration contours. If, on the other hand,
the concentration-area relation represents a multifractal model, then the log-log plot can
Fractal Analysis of Geochemical Anomalies 93
be depicted by at least two straight lines and thus by different values of α corresponding
to different ranges of v, reflecting groups of similarly-shaped concentration contours.
Consequently, the breaks in slopes of the straight lines fitted through the log-log plot of
the relation can be used to distinguish different ranges of v, which intuitively represent
different populations in the probability density distributions and spatial distributions of a
data set of uni-element concentrations.
Suppose a bifractal a geochemical landscape, meaning there is a threshold value (v
t
)
separating background and anomalous uni-element concentrations. The background uni-
element concentrations v
b
and the areas occupied by such uni-element concentrations
[i.e., A(v
b
v
t
)] satisfy the following power-law relation:
b
bbtb
vCvvA
α−
=≤ )( (4.6)
where C
b
is a constant and α
b
is an exponent associated with the background component.
The anomalous uni-element concentrations v
a
and the areas occupied by such uni-
element concentrations [i.e., A(v
a
>v
t
)] satisfy the following power-law relation:
a
aata
vCvvA
α−
=> )( (4.7)
where C
a
is a constant and α
a
is an exponent associated with the anomalous component.
Thus, if the soil Fe data are considered to represent a bifractal geochemical landscape
and an inflection point (or threshold) at 8.14% Fe is selected for the purpose of
illustration, two straight lines can be fitted through the concentration-area plots for the
soil Fe values have power-law equations shown in Fig. 4-6. The concentration-area
relation for the “low” Fe values (≤8.14% Fe) has α
low
=0.6939 and C
low
= 85536, whilst
the concentration-area relation for the “high” Fe values (>8.14% Fe) has α
high
=14.574
and C
high
= 3×10
17
.
The interpolated soil Fe data do not portray, however, a bifractal geochemical
landscape because by careful inspection of the concentration-area plots shown in either
Fig. 4-3 or 4-6, three inflection points or thresholds (1.6% Fe, 7.2% Fe, 8.6% Fe) can be
distinguished (Fig. 4-7). Accordingly, four straight lines can be fitted through the
concentration-area plots. Each of the three straight lines that fit the plots to the left of
any threshold satisfies the power-law relation in equation (4.6), whilst the straight line
that fits the plots to the right of the rightmost (or highest) threshold satisfies the power-
law relation in equation (4.7). Each of the lines represents a population in the soil Fe
data, which, from lowest to highest, can be classified as “low-background” (or LB),
“moderate-background” (or MB), “high-background” (or HB) and “anomaly” (or A). The
concentration-area relation for the “low-background” class (≤1.6% Fe) has α
LB
=0.2391
and C
LB
= 74877. The concentration-area relation for the “moderate-background” class
(1.6-7.2% Fe) has α
MB
=0.695 and C
MB
= 93259. The concentration-area relation for the
“high-background” class (7.2-8.6% Fe) has α
HB
=4.6729 and C
MB
= 2×10
8
. Finally, the
94 Chapter 4
concentration-area relation for the “anomaly” class (7.2-8.6% Fe) has α
A
=17.477 and
C
A
= 2×10
20
. This sort of analysis has been demonstrated by Cheng et al. (1997, 2000),
Cheng (1999b) and Panahi et al. (2004).
Discretisation of the interpolated soil Fe values based on the three threshold values
(Fig. 4-8) indicates that the three threshold values are related to variations in lithology
(see Fig. 4-4). Soil Fe values equal to or less than 1.6% pertain to areas underlain by the
quartzites and the adjoining phyllites. Soil Fe values ranging from 1.61% to 7.2% pertain
mainly to areas underlain by the phyllites. Soil Fe values ranging from 7.21% to 8.6%
pertain to areas underlain by phyllites surrounding the basalt. Soil Fe values greater than
8.6% pertain mainly to areas underlain by the basalt. Thus, geochemical data
classification based on threshold values determined from analysis of log-log plots
representing concentration-area relationships has strong ability to portray physically
meaningful spatial distributions of uni-element data.
APPLICATION OF GIS IN THE CONCENTRATION-AREA FRACTAL METHOD
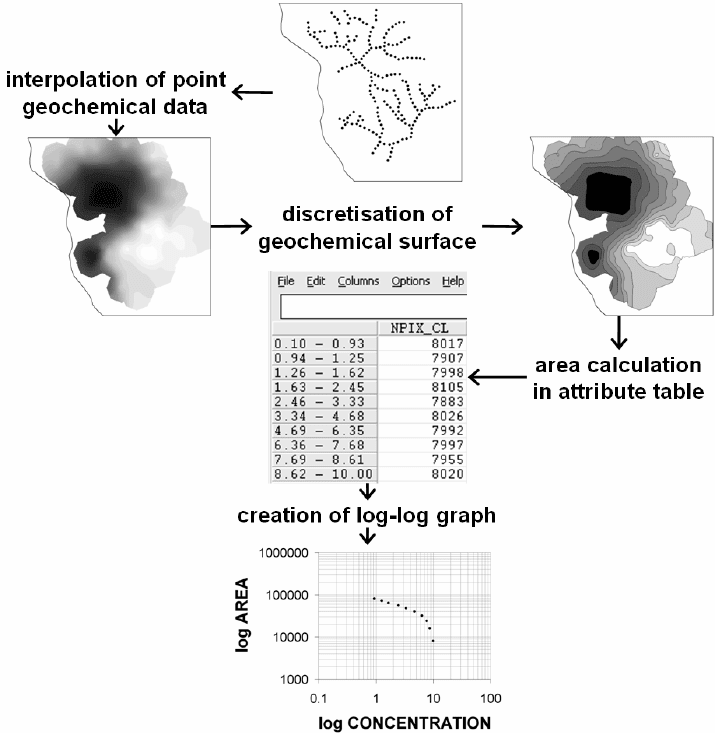
Fig. 4-9 summarises the basic operations on exploration geochemical data in order to
implement the concentration-area fractal method for separation of background and
anomaly. Basically, a GIS can support implementation of the concentration-area fractal
method in terms of (a) generation and discretisation of geochemical surfaces and (b)
attribute table operation for area calculations.
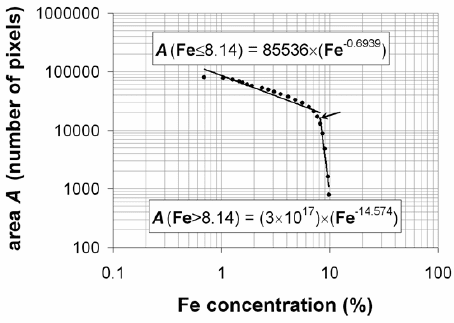
Fig. 4-6. Log-log plot of concentration-area relationship for the soil Fe data. By assuming that the
soil Fe data represent a bifractal geochemical landscape and considering an inflection point (or
threshold) corresponding to 8.14% Fe (pointed by short arrow), two straight lines can be fitted by
least squares through the concentration-area plots. The straight line fitted through the plots for
concentrations ≤8.14% Fe satisfies the power-law relation in equation (4.6), whilst the straight line
fitted through the plots for concentrations >8.14% Fe satisfies the power-law relation in equation
(4.7).
Fractal Analysis of Geochemical Anomalies 95
Generation and discretisation of geochemical surfaces
Because most exploration geochemical data are recorded as attributes of sampling
points, point-to-surface transformations through spatial interpolation (see Chapter 2) are
essential in analysis of geochemical thresholds via the concentration-area fractal method.
Spatial interpolation entails analysis of spatial correlation and variability of point
geochemical data in order to determine the precise way in which to generate a
geochemical surface for a certain element. This topic is, however, beyond the scope of
this volume. The references to this topic cited earlier in this chapter and many other
relevant publications can be consulted for further details.
Most GIS software packages support spatial interpolation of point data via either
triangulation or gridding techniques. The former techniques are not appropriate but the
latter techniques are appropriate for the application of the concentration-area fractal
method. That is because interpolation via gridding techniques provide surfaces
represented as a raster of pixels (see Figs. 2-5 and 2-14), which are amenable to the box-
counting method for estimation of areas enclosed by certain uni-element concentration
levels (Fig. 4-1). A geochemical surface generated from point data set must then be
discretised or classified according to some intervals of the data. Classification is, of
course, a basic functionality of a GIS (see Chapter 2).
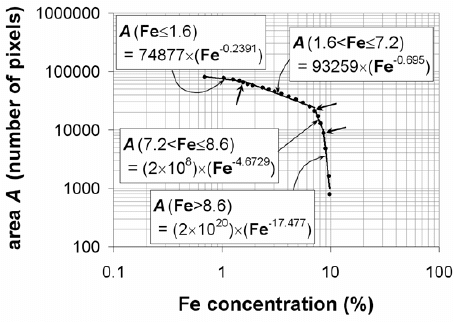
Fig. 4-7. Log-log plot of concentration-area relationship for the soil Fe data. By careful inspection
of the plots, three inflection points (or thresholds) corresponding to 1.6%, 7.2% and 8.6% Fe
(pointed by short arrows) can be defined and, thus, four straight lines can be fitted by least squares
through the concentration-area plots. The individual straight lines fitted through the plots to the
left of any threshold satisfy the power-law relation in equation (4.6), whilst the straight line fitted
through the plots to the right of the rightmost threshold satisfies the power-law relation in equation
(4.7).

96 Chapter 4
Attribute table operation for area calculations
For every raster map of geo-objects (see Chapter 2), such as a map of a discretised
geochemical surface, there is an associated table. The areas (usually expressed in number
of pixels or boxes) of polygonal geo-objects, such as areas enclosed within two contours
(i.e., class limits) of uni-element concentrations, are recorded automatically in the
associated attribute table during the discretisation process. For example in Fig. 4-10, the
second column (NPIX_CL) contains the number of pixels (or boxes) representing each
class of uni-element concentrations. The other columns in the table are created or
calculated. The third column (cl
min), containing the minimum values (or lower
limits) of each class, is created based on the first column. The fourth to last columns are
calculated via arithmetic operations using the values in the NPIX_CL column. The
values in the fourth column (npix
cum) are derived by calculating the cumulative sum
of the number of pixels in the NPIX_CL column successively from the lowest to the
highest class. The values in fifth column (npix
tot) are derived by aggregating the
total number of pixels in the NPIX_CL column. The total number of pixels is recorded
repeatedly in all cells of the npix_tot column because arithmetic operations on values
in at least two columns are executed by rows. The values in the sixth column
(npix_above_cl), which refer to cumulative sums of pixels in classes higher than a
certain class, are derived by subtracting the values in the fourth column from the
corresponding values in the fifth column [i.e., (npix_above_cl)=(npix_tot)–
(npix
cum)]. The values in the last column (npix_equal_above_cl_min), which
refer to cumulative sums of pixels of uni-element concentrations equal to or greater than
Fig. 4-8. Spatial distributions of the classified interpolated soil Fe data (Fig. 4-2, uppermost left)
based on three threshold values (1.6% Fe, 7.2% Fe, 8.6% Fe) defined in the log-log plot
representing relationships between areas and soil Fe concentrations (Fig. 4-7).
Fractal Analysis of Geochemical Anomalies 97
a class minimum, are derived by adding the values in the NPIX_CL column to the
corresponding values in the npix_above_cl column. The values in the cl_min
column and the npix_equal_above_cl_min column are then used to create a log-
log plot of the concentration-area relation.
Fig. 4-9. Schematic diagram of GIS-
b
ased operations that support implementation of the
concentration-area fractal method for recognition of threshold(s) separating background and
anomaly in geochemical data. See text and Fig. 4-10 for further explanation.

98 Chapter 4
CASE STUDY
Among the previously cited workers who demonstrated the application of the
concentration-area method in mineral exploration, Cheng et al. (1996) and Cheng
(1999b) applied the method using stream sediment geochemical data in different study
areas. The case study here demonstrates further the concentration-area method by using
the stream sediment geochemical data in the Aroroy district (Philippines). Details of the
geology, mineralisation and stream sediment geochemical data of the case study area are
given in Chapter 3.
Creation and classification of uni-element geochemical surface maps
Creating a geochemical surface based on stream sediment element concentrations is
not a trivial procedure. Firstly, unlike uni-element concentrations in soils or rocks, uni-
element concentrations in stream sediments actually do not represent spatially
continuous fields or variables (i.e., they are not everywhere). Secondly, stream sediments
and associated uni-element contents pertain only to a zone of influence – drainage
catchment basin. Nevertheless, there are many case studies in the geochemical
exploration literature wherein point data of stream sediment uni-element concentrations
have been transformed, usually via ‘weighted moving average’ interpolation techniques,
into a continuous surface (e.g., Ludington et al., 2006). Of the different ‘weighted
moving average’ interpolation methods, inverse distance weighting and kriging are the
most commonly used methods. Inverse distance weighting requires some knowledge of
Fig. 4-10. An example of an attribute table associated with a map of a discretised geochemical
surface. The first (leftmost) column contains the names of classes of uni-element concentrations.
The second column (NPIX_CL), which is the original attribute (or variable) column in the table,
contains the number of pixels (or boxes) of each class of uni-element concentrations. The third
column (cl_min) is created to indicate minimum concentration of each class. By performing
arithmetic operations using the values in the first column, the remaining columns are derived (see
text for explanations). The values in the columns cl_min and npix_equal_above_cl_min
are then used to create log-log plots of the concentration-area relation.
Fractal Analysis of Geochemical Anomalies 99
the point uni-element concentration data, which allows for the determination of the
appropriate size of the ‘moving average’ window (or kernel) and distance-decay
parameters (i.e., limiting distance and weight exponent). Kriging assumes that spatial
variability is too complex to be modeled mathematically such that it must be treated as a
stochastic process and the interpolation parameters (form of variation, magnitude and
spatial scale) are analyzed via variography. For simplicity, geochemical surfaces for the
stream sediment uni-element concentrations in this case study are generated via the
inverse distance moving average method using a limiting distance of 1700 m (which is
consistent with the sampling density of about one sample per 1-2 km
2
) and a weight
exponent of [1].
In respect of the zone of influence of each stream sediment sample location,
interpolated uni-element concentrations outside any of the stream sediment sample
catchment basins (Fig. 4-11) are masked out in the analysis of uni-element threshold via
the concentration-area fractal method. In addition to the continuous uni-element
geochemical surfaces, discrete geochemical surfaces are created by assuming that uni-
element concentrations within a stream sediment sample catchment basin are equal to
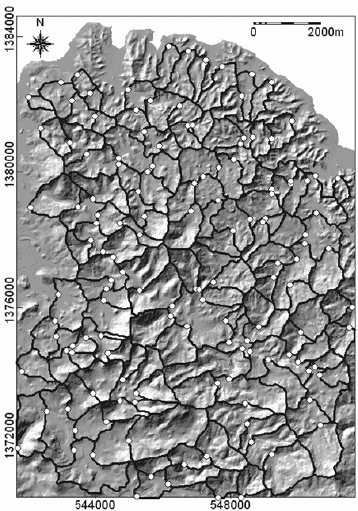
Fig. 4-11. Catchment basins (polygons in black outlines) of stream sediment sample locations
(white dots), Aroroy district (Philippines). Interpolated uni-element concentrations outside any o
f
these stream sediment sample catchment basins are excluded in the analysis of anomalies via the
concentration-area fractal method.