Everitt B.S. The Cambridge Dictionary of Statistics
Подождите немного. Документ загружается.

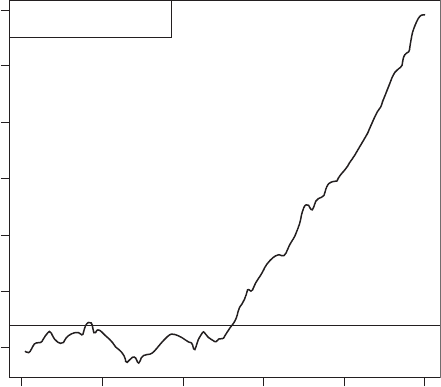
trend then the cusum is basically flat. A change in level of the raw data over time appears
as a change in the slope of the cusum. An example is shown in Fig. 48. See also exponen-
tially weighted moving average control chart.[Journal of Quality Techniques, 1975, 7,
183–92.]
Cuthbert, Dan ie l ( 1905^1 997): Cuthbert attended MIT as an undergraduate, taking English and
History along with engineering. He received a BS degree in chemical engineering in 1925
and an MS degree in the same subject in 1926. After a year in Berlin teaching Physics he
returned to the US as an instructor at Cambridge School, Kendall Green, Maine. In the 1940s
he read Fisher’s Statistical Methods for Research Workers and began a career in statistics.
Cuthbert made substantial contributions to the planning of experiments particularly in an
individual setting. In 1972 he was elected an Honorary Fellow of the Royal Statistical
Society. Cuthbert died in New York City on 8 August 1997.
Cuzick’s trend test: A
distribution free method
for testing the trend in a measured variable across
a series of ordered groups. The test statistic is, for a sample of N subjects, given by
T ¼
X
N
i¼1
Z
i
r
i
where Z
i
ði ¼ 1; ...; NÞ is the group index for subject i (this may be one of the numbers
1; ...; G arranged in some natural order, where G is the number of groups, or, for example, a
measure of exposure for the group), and r
i
is the rank of the ith subject’s observation in the
combined sample. Under the null hypothesis that there is no trend across groups, the mean
(µ) and variance (σ
2
)ofT are given by
¼ N ðN þ 1ÞEðZÞ=2
2
¼ N
2
ðN þ1ÞV ðZÞ=12
Days
0
0 102030405060
20 40 60 80 100
Cumulative sum
Reference level is 4
Fig. 48 Cusum chart.
119
where E(Z) and V (Z) are the calculated mean and variance of the Z values. [Statistics in
Medicine, 1990, 9, 829–34.]
Cycle: A term used when referring to
time series
for a periodic movement of the series. The period is the
time it takes for one complete up-and-down and down-and-up movement. [Cycles, the
Mysterious Forces that Trigger Events, 1971, E. R. Dewey, Hawthorn Books, New York.]
Cycle hunt analysis: A procedure for clustering variables in
multivariate data
, that forms clusters
by performing one or other of the following three operations:
*
combining two variables, neither of which belongs to any existing cluster,
*
adding to an existing cluster a variable not previously in any cluster,
*
combining two clusters to form a larger cluster.
Can be used as an alternative to
factor analysis
. See also cluster analysis.[Multivariate
Behavioral Research, 1970, 5, 101–16.]
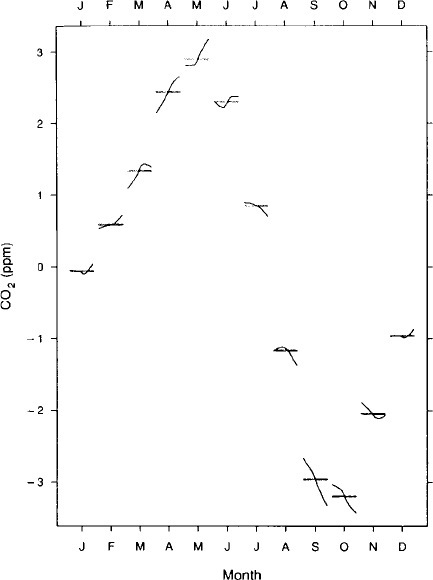
Cycle plot: A graphical method for studying the behaviour of seasonal
time series
. In such a plot,
the January values of the seasonal component are graphed for successive years, then the
February values are graphed, and so forth. For each monthly subseries the mean of the
values is represented by a horizontal line. The graph allows an assessment of the overall
pattern of the seasonal change, as portrayed by the horizontal mean lines, as well as the
behaviour of each monthly subseries. Since all of the latter are on the same graph it is readily
seen whether the change in any subseries is large or small compared with that in the overall
pattern of the seasonal component. Such a plot is shown in Fig. 49.[Visualizing Data, 1993,
W. S. Cleveland, Hobart Press, Murray Hill, New Jersey.]
Fig. 49 Cycle plot of carbon
dioxide concentrations.
(Taken with permission
from Visualizing Data, 1993,
W. S. Cleveland, Hobart Press,
Murray Hill, New Jersey.)
120

Cyclic d esigns:
Incomplete block designs
consisting of a set of blocks obtained by cyclic develop-
ment of an initial block. For example, suppose a design for seven treatments using three
blocks is required, the
7
3
distinct blocks can be set out in a number of cyclic sets generated
from different initial blocks, e.g. from (0,1,3)
0123456
1234560
3456012
[Statistical Design and Analysis of Experiments, 1971, P. W. M. John, MacMillan, New
York.]
Cyclic var iati on: The systematic and repeatable variation of some variable over time. Most people’s
blood pressure, for example, shows such variation over a 24 hour period, being lowest at
night and highest during the morning. Such
circadian variation
is also seen in many hormone
levels. [SMR Chapter 14.]
Czekanowskicoefficient: A
dissimilarity coefficient
, d
ij
, for two individuals i and j each having
scores, x
0
i
¼½x
i1
; x
i2
; ...; x
iq
and x
0
j
¼½x
j1
; x
j2
; ...; x
jq
on q variables, which is given by
d
ij
¼ 1
2
P
q
k¼1
minðx
ik
; x
jk
Þ
P
q
k¼1
ðx
ik
þ x
jk
Þ
[MV1 Chapter 3.]
121

D
DAG: See directed acyclic graph.
D’Agostino’s test: A test based on ordered sample values x
ð1Þ
x
ð2Þ
x
ðnÞ
with mean
x,
used to assess whether the observations arise from a normal distribution. The
test statistic
is
D ¼
P
n
i¼1
fi
1
2
ðn þ1Þgx
ðiÞ
n
ffiffiffiffiffiffiffiffiffiffiffiffiffiffiffiffiffiffiffiffiffiffiffiffiffiffiffiffiffiffiffiffiffiffi
n
P
n
i¼1
ðx
ðiÞ
xÞ
2
q
Appropriate for testing departures from normality due to
skewness
. Tables of critical values
are available. [Communication in Statistics: Theory and Methods, 1994, 23,45–47.]
DALYs: Abbreviation for disability adjusted life years.
Daniels, Henry (1912^2000): Daniels studied at the Universities of Edinburgh and Cambridge, and
was first employed at the Wool Industries Research Association in Leeds. This environment
allowed Daniels to apply both his mathematical skills to the strength of bundles of threads and his
mechanical bent to inventing apparatus for the fibre measurement laboratory. In 1947 he joined
the statistical laboratory at the University of Cambridge and in 1957 was appointed as the first
Professor of Mathematical Statistics at the University of Birmingham. He remained in
Birmingham until his retirement in 1978 and then returned to live in Cambridge. Daniels was a
major figure in the development of statistical theory in the 20th Century and was President of the
Royal Statistical Society in 1974–1975. He was awarded the Guy medal of the Royal Statistical
Society in bronze in 1957 and in gold in 1984. In 1980 Daniels was elected as a Fellow of the
Royal Society. Daniels was a expert watch-repairer and in 1984 was created a Liveryman of
the W or shipful Company of Clockmakers in recognition of his contribution to watch design.
Daniels died on 16 April 2000 whilst attending a statistics conference at Gregynog, Powys,
Wales.
Darling test: A test that a set of random variables arise from an
exponential distribution
.If
x
1
; x
2
; ...; x
n
are the n sample values the test statistic is
K
m
¼
P
n
i¼1
ðx
i
xÞ
2
x
2
where
x is the mean of the sample. Asymptotically K
m
can be shown to have mean () and
variance (
2
) given by
¼
nðn 1Þ
n þ1
2
¼
4n
4
ðn 1Þ
ðn þ 1Þ
2
ðn þ2Þðn þ 3Þ
so that z ¼ðK
m
Þ= has asymptotically a standard normal distribution under the expo-
nential distribution hypothesis. [Journal of Statistical Planning and Inference, 1994, 39,
399–424.]
122

Dantzig selector: An approach to variable selection with
high-dimensional data
that is similar to the
lasso
.[Annals of Statistics, 2007, 35, 2313–2404.]
Darmois-Skitovitch’stheorem: If X
k
(k = 1,2, ...n) are independent random variables and L
1
and L
2
are de fined as
L
1
¼
X
n
k¼1
b
k
X
k
L
2
¼
X
n
k¼1
c
k
X
x
where b
k
and c
k
(k = 1,2 ..., n) are nonzero real coef ficients, then if L
1
and L
2
are
independent, X
1
...... X
k
all have normal distributions. [Bulletin of the International
Statistical Institute, 1951, 23 (II), 79 –82.]
Data: See data set.
Data archives: Collections of data that are suitably indexed and are accessible to be utilized by
researchers aiming to perform secondary data analysis. Examples are the Economic and
Social Research Council Data Archive held at the University of Essex in the UK, the ICPSR
in Michigan (http://www.icpsr.umich.edu/) and StatLib (http://lib.stat.cmu.edu/datasets/)
Data augmentation: A scheme for augmenting observed data so as to make it more easy to analyse.
A simple example is the estimation of
missing values
to balance a
factorial design
with
different numbers of observations in each cell. The term is most often used, however, in
respect of an iterative procedure, the
data augmentation algorithm
common in the compu-
tation of the
posterior distribution
in
Bayesian inference
. The basic idea behind this
algorithm is to augment the observed data y by a quantity z which is usually referred to as
latent data. It is assumed that given both y and z it is possible to calculate or sample from the
augmented data posterior distribution pðjy; zÞ. To obtain the observed posterior pðjyÞ,
multiple values (imputations) of z from the predictive distribution pðzjyÞ are generated and
the average of pðjy; zÞover the imputations calculated. Because pðzjyÞdepends on pðjyÞan
iterative algorithm for calculating pðjyÞ results. Specifically, given the current approxima-
tion g
i
ðÞ to the observed posterior pðjyÞ the algorithm specifies:
*
generate a sample z
ð1Þ
; ...; z
ðmÞ
from the current approximation to the predictive
distribution pðzjyÞ;
*
update the approximation to pðjyÞ to be the mixture of augmented posteriors of
given the augmented data from the step above, i.e.
g
iþ1
ðÞ¼
1
m
X
m
j¼1
pðjz
ðjÞ
; yÞ
The two steps are then iterated. See also EM algorithm and Markov chain Monte Carlo
methods.[Analysis of Incomplete Multivariate Data, 1997, J.L. Schafer, Chapman and
Hall/CRC Press, London.]
Data augmentation algorithm: See data augmentation.
Database: A structured collection of data that is organized in such a way that it may be accessed easily
by a wide variety of applications programs. Large clinical databases are becoming increas-
ingly available to clinical and policy researchers; they are generally used for two purposes;
to facilitate health care delivery, and for research. An example of such a database is that
provided by the US Health Care Financing Administration which contains information
about all Medicare patients’ hospitalizations, surgical procedures and office visits. [SMR
Chapter 6.]
123
Database management system: A computer system organized for the systematic management
of a large structured collection of information, that can be used for storage, modification and
retrieval of data.
Data depth: A quantitative measurement of how central a point is with respect to a data set, and used
to measure the ‘depth’ of ‘outlyingness’ of a given multivariate sample with respect to its
underlying distribution. Several such measures have been proposed, for example,
convex
hull trimming
and the
bivariate Oja median
. Desirable properties of data depth measures are
affine invariance
and
robustness
.[Annals of Statistics, 1999, 27, 783–858.]
Data dredging: A term used to describe comparisons made within a data set not specifically
prescribed prior to the start of the study. See also data mining and subgroup analysis.
[SMR Chapter 6.]
Data editing: The action of removing format errors and keying errors from data.
Data fusion: The act of combining data from heterogeneous sources with the intent of extracting
information that would not be available for any single source in isolation. An example is the
combination of different satellite images to facilitate identification and tracking of objects.
The term is also used to mean the combination of statistically heterogeneous samples to
construct a new sample that can be regarded as having come from an unobserved joint
distribution of interest, i.e. the act of inferring a joint distribution when one only has
information about the marginal distributions. See also record linkage and copulas.
[Journal of Marketing Research, 2006, 43,1–22.]
Data generating mechanism (DG M): A term sometimes used for the statistical model which is
assumed to have generated a dataset.
Data intrusion simulation: A method of estimating the probability that a data intruder who has
matched an arbitrary population unit against a sample unit in a target
microdata
file has done
so correctly. [Statistical Journal of the United Nations Economics Commission for Europe,
2001, 18, 383 –391.]
Data matrix: See multivariate data.
Data mini ng: The non-trivial extraction of implicit, previously unknown and potentially useful
information from data, particularly
high-dimensional data
, using
pattern recognition
,
artifi-
cial intelligence
and
machine learning
, and the presentation of the information extracted in a
form that is easily comprehensible to humans. Significant biological discoveries are now
often made by combining data mining methods with traditional laboratory techniques; an
example is the discovery of novel regulatory regions for heat shock genes in
C. elegans
made
by mining vast amounts of gene expression and sequence data for significant patterns.
[Principles of Data Mining, 2001, D.J. Hand, H. Mannila and P. Smyth, MIT Press.]
Da ta mon i to ri ng co mm ittees ( DMC) : Committees to monitor accumulating data from
clinical
trials
. Such committees have major responsibilities for ensuring the continuing safety of trial
participants, relevance of the trial question, appropriateness of the treatment protocol and
integrity and quality of the accumulating data. The committees should be multidisciplinary,
and should always include individuals with relevant clinical and statistical expertise. [Data
124
Monitoring Committees in Clinical Trials: A Practical Perspective, S. S. Ellenberg,
T. R. Fleming and D. L. DeMets, 2002, Wiley, Chichester.]
Data perturbation: See statistical disclosure limitation.
Datareduction: The process of summarizing large amounts of data by forming frequency distribu-
tions, histograms, scatter diagrams, etc., and calculating statistics such as means, variances
and correlation coefficients. The term is also used when obtaining a low-dimensional
representation of
multivariate data
by procedures such as
principal components analysis
and
factor analysis
.[Data Reduction and Error Analysis for the Physical Sciences, 1991,
P. R. Bevington, D. K. Robinson, McGraw-Hill.]
Data science: A term intended to unify statistics, data analysis and related methods. Consists of three
phases, design for data, collection of data and analysis of data. [Data Science, Classification
and Related Methods, 1998, C. Hayashi et al. eds., Springer, Tokyo.]
Data screening: The initial assessment of a set of observations to see whether or not they appear to
satisfy the assumptions of the methods to be used in their analysis. Techniques which
highlight possible
outliers
, or, for example, departures from normality, such as a
normal
probability plot
, are important in this phase of an investigation. See also initial data
analysis. [SMR Chapter 6.]
Data set: A general term for observations and measurements collected during any type of scienti fic
investigation.
Data smoothing algorithms: Procedures for extracting a pattern in a sequence of observations
when this is obscured by noise. Basically any such technique separates the original series
into a smooth sequence and a residual sequence (commonly called the ‘rough’). For
example, a smoother can separate seasonal fluctuations from briefer events such as identi-
fiable peaks and random noise. A simple example of such a procedure is the
moving average
;
a more complex one is
locally weighted regression
. See also Kalman filter and spline
function.
Data squashing: An approach to reducing the size of very large data sets in which the data are first
‘binned’ and then statistics such as the mean and variance/covariance are computed on each
bin. These statistics are then used to generate a new sample in each bin to construct a reduced
data set with similar statistical properties to the original one. [Graphics of Large Data Sets,
2006, A. Unwin, M. Theus, and H. Hofmann, Springer, New York.]
Data swapping: See statistical disclosure limitation.
Data tilting: A term applied to techniques for adjusting the empirical distribution by altering the data
weights from their usual uniform values, i.e., n
–1
where n is the sample size, to multinomial
weights, p
i
for the ith data point. Often used in the analysis of
time series
.[Journal of the
Royal Statistical Society, Series B, 2003, 65, 425–442.]
Data theory: Data theory is concerned with how observations are transformed into data that can be
analyzed. Data are hence viewed as theory laden in the sense that observations can be given
widely different interpretations, none of which are necessitated by the observations them-
selves. [Data Theory and Dimensional Anaysis, 1991, W. G. Jacoby, Sage, Newbury Park.]
Data vizualization: Interpretable graphical representations of abstract data and their relationships.
See also statistical graphics.[Vizualization Handbook, 2004, C. Hansen and C. R. Johnson,
Academic Press, Orlando, Florida.]
125
David, Florence Nightingale (1909^1993): Born near Leominster, Florence David obtained a
first degree in mathematics from Bedford College for Women in 1931. Originally applied to
become an actuary but had the offer of a post withdrawn when it was discovered that the
‘F.N. David’ who had applied was a women. Worked with
Karl Pearson
at University
College, London and was awarded a doctorate in 1938. Also worked closely with
Jerzy
Neyman
both in the United Kingdom and later in Berkeley. During the next 22 years she
published eight books and over 80 papers. In 1962 David became Professor of Statistics at
University College, London and in 1967 left England to accept a position at the University of
California at Riverside where she established the Department of Statistics. She retired in
1977.
Davies ^ Quade test: A
distribution free method
that tests the hypothesis that the common under-
lying probability distribution of a sample of observations is symmetric about an unknown
median. [NSM Chapter 3.]
Death rate: See crude death rate.
Debugg i ng: The process of locating and correcting errors in a computer routine or of isolating and
eliminating malfunctions of a computer itself.
Decil es: The values of a variable that divide its probability distribution or its frequency distribution
into ten equal parts.
Decis i on functi o n: See decision theory.
Decis i on theory: A unified approach to all problems of estimation, prediction and hypothesis
testing. It is based on the concept of a
decision function
, which tells the experimenter how
to conduct the statistical aspects of an experiment and what action to take for each possible
outcome. Choosing a decision function requires a
loss function
to be defined which assigns
numerical values to making good or bad decisions. Explicitly a general loss function is
denoted as Lðd;Þexpressing how bad it would be to make decision d if the parameter value
were .A
quadratic loss function
, for example, is defined as
Lðd;Þ¼ðd Þ
2
and a
bilinear loss function
as
Lðd;Þ¼aðd Þ if d
Lðd;Þ¼bð dÞ if d
where a and b are positive constants. [KA2 Chapter 31.]
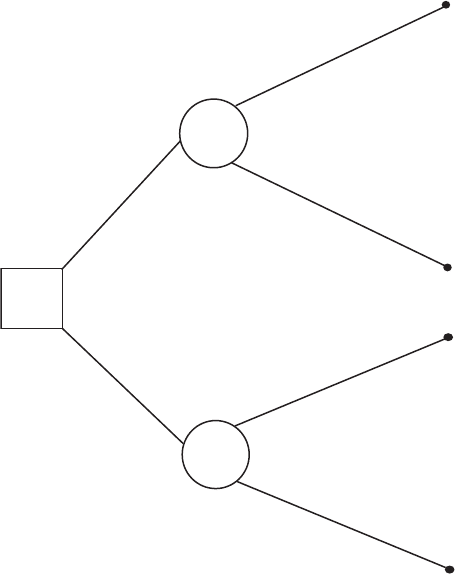
Decision tree: A graphic representation of the alternatives in a decision making problem that
summarizes all the possibilities foreseen by the decision maker. For example, suppose we
are given the following problem.
A physician must choose between two treatments. The patient is known to have one of
two diseases but the diagnosis is not certain. A thorough examination of the patient was not
able to resolve the diagnostic uncertainty. The best that can be said is that the probability that
the patient has disease A is p.
A simple decision tree for the problem is shown in Fig. 50. [KA2 Chapter 31.]
Deepmode ls: A term used for those models applied in
screening studies
that incorporate hypotheses
about the disease process that generates the observed events. The aim of such models is to
attempt an understanding of the underlying disease dynamics. See also surface models.
[Statistical Methods in Medical Research, 1995, 4,3–17.]
126
De Finetti, Bruno (1906^1985): Born in Innsbruck, Austria, De Finetti studied mathematics at
the University of Milan, graduating in 1927. He became an actuary and then worked at the
National Institute of Statistics in Rome later becoming a professor at the university.
De Finetti is now recognized as a leading probability theorist for whom the sole interpre-
tation of probability was a number describing the belief of a person in the truth of a
proposition. He coined the aphorism ‘probability does not exist’, meaning that it has no
reality outside an individual’s perception of the world. A major contributor to
subjective
probability
and
Bayesian inference
, De Finetti died on 20 July 1985 in Rome.
DeFrie s^Fulker analysis: A class of regression models that can be used to provide possible
estimates of the fundamental biometrical genetic constructs, heritability and shared or com-
mon environment. See also ACE model.[Annual Review of Psychology, 1991, 42,161–90.]
Degenerate distributions: Special cases of probability distributions in which a random
variable’s distribution is concentrated at only one point. For example, a discrete uniform
distribution when k ¼ 1. Such distributions play an important role in
queuing theory
.[A
Primer on Statistical Distributions, 2003, N. Balakrishnan and V.B. Neizorow, Wiley, New
York.]
Degrees of freedom: An elusive concept that occurs throughout statistics. Essentially the term
means the number of independent units of information in a sample relevant to the estimation
of a parameter or calculation of a statistic. For example, in a
two-by-two contingency table
with a given set of marginal totals, only one of the four cell frequencies is free and the table
has therefore a single degree of freedom. In many cases the term corresponds to the number
p
p
Disease A
Disease B
(1–p )
(1–p )
Treatment X
Treatment Y
Disease A
Disease B
Fig. 50 A simple
decision tree.
127

of parameters in a model. Also used to refer to a parameter of various families of distribu-
tions, for example,
Student’s t-distribution
and the
F- distribution
. [SMR Chapter 9.]
Delay distribution: The probability distribution of the delay in reporting an event. Particularly
important in AIDS research, since AIDS surveillance data needs to be appropriately
corrected for reporting delay before they can be used to reflect the current AIDS incidence.
See also back-projection.[Philosophical Transactions of the Royal Society of London,
Series B, 1989, 325, 135–45.]
Del ayed ent ry: In
survival analysis
this refers to situations where units do not come under observa-
tion when they become at risk for the event of interest but instead after a delay. [Survival
Analysis: State of the Art, 1992, eds J. P. Klein and P. K. Goel, Springer, New York.]
Delta(δ) method: A procedure that uses the
Taylor series expansion
of a function of one or more
random variables to obtain approximations to the expected value of the function and to its
variance. For example, writing a variable x as x ¼ þ where EðxÞ¼ and EðÞ¼0,
Taylor’s expansion gives
f ðxÞ¼f ðÞþ
df ðxÞ
dx
j
x¼
þ
2
2
d
2
f ðxÞ
dx
2
j
x¼
þ
If terms involving
2
;
3
, etc. are assumed to be negligible then
f ðxÞf ðÞþðx Þf
0
ðÞ
So that
var½ f ðxÞ ½ f
0
ðÞ
2
varðxÞ
So if f ðxÞ¼ln x then varð ln xÞ¼ð1=
2
ÞvarðxÞ.[The American Statistician, 1992, 46,
27–29.]
Deming , Edwa r ds ( 1900^1993): Born in Sioux City, Iowa, Deming graduated from the
University of Wyoming in 1921 in electrical engineering, received an MS in mathematics
and physics from the University of Colorado in 1925 and a Ph.D. in mathematics and
physics from Yale University in 1928. He became aware of early work on
quality control
procedures
while working at the Hawthorne plant of the Western Electric Company in
Chicago. Deming’s interest in statistics grew in the early 1930s and, in 1939, he joined the
US Bureau of the Census. During World War II, Deming was responsible for a vast
programme throughout the USA teaching the use of sampling plans and control charts but
it was in Japan in the 1950s that Deming’s ideas about industrial production as a single
system involving both the suppliers and manufacturers all aimed at satisfying customer need
were put into action on a national scale. In 1960 Deming received Japan’s Second Order
Medal of the Sacred Treasure and became a national hero. He died on 20 December 1993.
Demog raph y: The study of human populations with respect to their size, structure and dynamics, by
statistical methods. [Demography: Measuring and Modeling Population Processes,S.H.
Preston, P. Heiveline and M. Guillot, 2000, Wiley, New York.]
De M oi vre, Abraha m ( 1667^1754): Born in Vitry, France, de Moivre came to England in
c
.
1686 to avoid religious persecution as a Protestant and earned his living at first as a travelling
teacher of mathematics, and later in life sitting daily in Slaughter’s Coffee House in Long
Acre, at the beck and call of gamblers, who paid him a small sum for calculating odds.
A close friend of Isaac Newton, de Moivre reached the normal curve as the limit to the skew
binomial and gave the correct measure of dispersion
ffiffiffiffiffiffiffiffiffiffiffiffiffiffiffiffiffiffiffiffi
npð1 pÞ
p
. Also considered the
128