Everitt B.S. The Cambridge Dictionary of Statistics
Подождите немного. Документ загружается.


y
t
¼ y
t
αy
t1
and x
t
¼ x
t
αx
t1
an estimate of β can be obtained from
ordinary least
squares
of y
t
and x
t
. The unknown parameter α can be calculated from the
residuals
from the
regression, leading to an iterative process in which a new set of transformed variables are
calculated and thus a new set of regression estimates and so on until convergence.
[Communications in Statistics, 1993, 22, 1315–33.]
Codominance: The relationship between the
genotype
at a locus and a
phenotype
that it in fluences. If
individuals with heterozygote (for example, AB) genotype is phenotypically different from
individuals with either homozygous genotypes (AA and BB), then the genotype-phenotype
relationship is said to be codominant. [Statistics in Human Genetics, 1998, P. Sham, Arnold,
London.]
Coefficientofalienation: A name sometimes used for 1 r
2
, where r is the estimated value of the
correlation coefficient of two random variables. See also coefficient of determination.
Coefficientofconcordance: A coefficient used to assess the
agreement
among m raters ranking
n individuals according to some specific characteristic. Calculated as
W ¼ 12S=½m
2
ðn
3
nÞ
where S is the sum of squares of the differences between the total of the ranks assigned to
each individual and the value mðn þ1Þ=2. W can vary from 0 to 1 with the value 1 indicating
perfect agreement. [Quick Statistics, 1981, P. Sprent, Penguin Books, London.]
Coefficientofdetermination: The square of the correlation coefficient between two variables.
Gives the proportion of the variation in one variable that is accounted for by the other. [ARA
Chapter 7.]
Coeffic i ent of rac ia l li k eness (C RL ) : Developed by
Karl Pearson
for measuring resemblances
between two samples of skulls of various origins. The coefficient is defined for two samples I
and J as:
CRL ¼
1
p
X
p
k¼1
ðX
Ik
X
Jk
Þ
2
ðs
2
Ik
=n
I
Þþðs
2
Jk
=n
J
Þ
()
1
2
2
4
3
5
2
p
where
X
Ik
stands for the sample mean of the kth variable for sample I and s
2
Ik
stands for the
variance of this variable. The number of variables is p.[American Journal of Physical
Anthropology, 2005, 23, 101–109.]
Coeffic ient o f va r iat io n: A measure of spread for a set of data de fined as
100 standard deviation=mean
Originally proposed as a way of comparing the variability in different distributions, but
found to be sensitive to errors in the mean. [KA1 Chapter 2.]
Coefficientsignpredictionmethods: Methods used for predicting the signs of the coefficients
in a regression model; this is useful when the main purpose in selecting a model is
interpretation, because the sign of a coefficient is often of primary importance for this
task. [Journal of the Royal Statistical Society, Series B, 2007, 69, 447–461.]
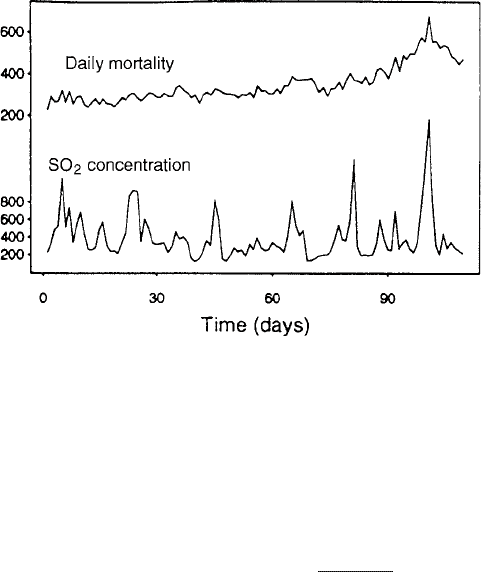
Coherence: A term most commonly used in respect of the strength of association of two
time series
.
Figure 37, for example, shows daily mortality and SO
2
concentration time series in London
during the winter months of 1958, with an obvious question as to whether the pollution was
in any way affecting mortality. The relationship is usually measured by the time series
analogue of the correlation coefficient, although the association structure is likely to be more
89
complex and may include a leading or lagging relationship; the measure is no longer a single
number but a function, ρ(ω), of frequency ω.Defined explicitly in terms of the Fourier
transforms f
x
(ω), f
y
(ω) and f
xy
(ω) of the
autocovariance functions
of X
t
and Y
t
and their
cross-
covariance function
as
2
ðωÞ¼
jf
xy
ðωÞj
2
f
x
ðωÞf
y
ðωÞ
The squared coherence is the proportion of variability of the component of Y
t
with frequency
ω explained by the corresponding X
t
component. This corresponds to the interpretation of
the squared
multiple correlation coefficient
in
multiple regression
. See also multiple time
series. [TMS Chapter 8.]
Cohort: See cohort study.
Cohort component method: A widely used method of forecasting the age- and sex-specific
population to future years, in which the initial population is stratified by age and sex and
projections are generated by application of survival ratios and birth rates, followed by an
additive adjustment for net migration. The method is widely used because it provides
detailed information on an area’s future population, births, deaths, and migrants by age,
sex and race, information that is uesful for many areas of planning and public administration.
[Demography, 1977, 14, 363–8.]
Cohort study: An investigation in which a group of individuals (the cohort) is identified and
followed prospectively, perhaps for many years, and their subsequent medical history
recorded. The cohort may be subdivided at the onset into groups with different character-
istics, for example, exposed and not exposed to some risk factor, and at some later stage a
comparison made of the incidence of a particular disease in each group. See also prospective
study. [SMR Chapter 5.]
Coincidences: Surprising concurrence of events, perceived as meaningfully related, with no appa-
rent causal connection. Such events abound in everyday life and are often the source of some
amazement. As pointed out by
Fisher
, however, ‘the one chance in a million will undoubt-
edly occur, with no less and no more than its appropriate frequency, however surprised we
Fig. 37 Time series for daily mortality and sulphur dioxide concentration in London during the winter
months of 1958.
90

may be that it should occur to us’. See also synchronicity [Chance Rules, 2nd edn, 2008,
B. S. Everitt, Springer, New York.]
Co in t egrat io n: Avector of
nonstationary time series
is said to be cointegrated if a linear combination
of the individual series is stationary. Facilitates valid testing of the hypothesis that there is a
relationship between the nonstationary series. [Econometrica, 1987, 55, 251–276.]
Co llaps ingcat egori es: A procedure often applied to
contingency tables
in which two or more row
or column categories are combined, in many cases so as to yield a reduced table in which
there are a larger number of observations in particular cells. Not to be recommended in
general since it can lead to misleading conclusions. See also Simpson’s paradox.
[Multivariable Analysis, 1996, A. R. Feinstein, New York University Press, New Haven.]
Collective risk models: Models applied to insurance portfolios which do not make direct reference
to the risk characteristics of the individual members of the portfolio when describing the
aggregate claims experience of the whole portfolio itself. To model the total claims of a
collection of risks over a fixed period of time in the future, the collective approach
incorporates both claim frequency and claim severity components into the probability
distribution of the aggregate. [Encyclopedia of Quantitative Risk Analysis and
Assessment, Volume 1, 2008, eds. E. L. Melnick and B. S. Everitt, Wiley, Chichester.]
Collector’sproblem: A problem that derives from schemes in which packets of a particular brand
of tea, cereal etc., are sold with cards, coupons or other tokens. There are say n different
cards that make up a complete set, each packet is sold with one card, and a priori this card is
equally likely to be any one of the n cards in the set. Of principal interest is the distribution of
N, the number of packets that a typical customer must buy to obtain a complete set. It can be
shown that the
cumulative probability distribution
of N ; F
N
ðr; nÞ is given by
F
N
ðr; nÞ¼
X
n
t¼0
ð1Þ
t
n!ðn tÞ
r
n
r
t!ðn tÞ!
; r n
The expected value of N is
E ð N Þ¼n
X
n
t¼1
1
t
[The American Statistician, 1998, 52, 175–80.]
Collinearity: Synonym for multicollinearity.
Collision test: A test for randomness in a sequence of digits. [The Art of Computer Programming,
2nd edition, 1998, D. K. Knuth, Addison-Wesley, Reading, Maine.]
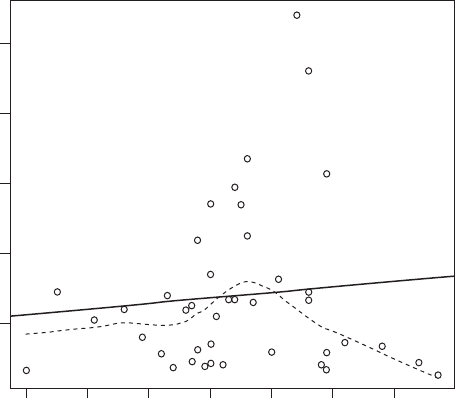
Comb i n i ng cond iti o na l ex pectatio ns and resi du als pl ot (CE RES ) : A generalization of
the partial residual plot that is often useful for identifying curvature in regression models. If,
for example, it is suspected that for one of the explanatory variables, x
i
, a term in x
2
i
is
needed, then this term is added to the usual residuals from the regression model and the result
is plotted against x
i
. Figure 38 shows an example from studying the relationship between
pollution (sulphur dioxide level) and annual rainfall and wind speed in a number of cities in
the USA. The plot for wind speed showing the linear and locally weighted fits indicates that
a quadratic term for this variable might be needed in the model. [Linear Regression Analysis,
2003, G. A. F. Seber and A. J. Lee, Wiley, New York]
Combining p-values: The combining of a number of p-values obtained from testing hypotheses
that are all related to a common question. In a
clinical trial
, for example, there may be several
91
outcome measures that are used in trying to determine whether or not a treatment is effective;
combining the p-values from the tests on each outcome may give stronger evidence than is
obtained from considering each p-value individually. The most common method of combin-
ing p-values is the Fisher combination test where the combined test statistic is
C
F
¼2
P
k
i¼1
logðp
i
Þ where p
i
; i ¼ 1; ...k, are the separate p-values; C
F
is tested as a
chi-square with 2k degrees of freedom. See also meta-analysis.[Computational Statistics
and Data Analysis, 2004, 47, 467–485.]
Comingling analysis: Essentially a synonym for the fitting of finite mixture distributions.
Commensurat e va ri ab les: Variables that are on the same scale or expressed in the same units, for
example, systolic and diastolic blood pressure.
Common cause fail ures (CC F): Simultaneous failures of multiple components due to a common
cause. A cause can be external to the components, or it can be a single failure that propagates
to other components in a cascade. Even if such events are rare compared to single failures of
a component, they can dominate system unreliability or unavailability. A variety of models
for predicting CCFs have been suggested. [Reliability Engineering and System Safety, 2005,
90, 186–195.]
Common factor: See factor analysis .
Common facto r var iance: A term used in
factor analysis
for the proportion of the variance of a
manifest variable
that is attributed to the
common factors
. [MV2 Chapter 12.]
Commonprincipalcompon ents analysis: A generalization of
principal components analysis
to several groups. The model for this form of analysis assumes that the
variance–covariance
matrices
, S
i
of k populations have identical
eigenvectors
, so that the same orthogonal
matrix diagonalizes all S
i
simultaneously. A modification of the model, partial common
Wind speed
6789101112
CERES residual
280260240220200
Fig. 38 CERES plot for wind speed in multiple regression model that includes wind speed and
precipitation with the dependent variable being sulphur dioxide concentration.
92
principal components, assumes that only r out of q eigenvectors are common to all
i
while
the remaining q r eigenvectors are specific in each group. [MV1 Chapter 4.]
Co m munality: Synonym for common factor variance.
Community controls: See control group.
Commun ity i nterventio n study: An
intervention study
in which the experimental unit to be
randomized to different treatments is not an individual patient or subject but a group of
people, for example, a school, or a factory. See also cluster randomization.[Statistics in
Medicine, 1996, 15, 1069–92.]
Co-morbidity: The potential co-occurrence of two disorders in the same individual, family etc.
[Statistics in Medicine, 1995, 14, 721–33.]
Co m parativ e ca lib ra t io n: The statistical methodology used to assess the calibration of a number
of instruments, each designed to measure the same characteristic on a common group of
individuals. Unlike a normal calibration exercise, the true underlying quantity measured is
unobservable. [Statistics in Medicine, 1997, 16, 1889–95.]
Comparative exposure rate: A measure of association for use in a
matched case–control study
,
defined as the ratio of the number of case–control pairs, where the case has greater exposure
to the risk factor under investigation, to the number where the control has greater exposure.
In simple cases the measure is equivalent to the
odds ratio
or a weighted combination of odds
ratios. In more general cases the measure can be used to assess association when an odds
ratio computation is not feasible. [Statistics in Medicine, 1994, 13, 245–60.]
Comparative trial: Synonym for controlled trial.
Co m pari so n g r o u p: Synonym for control group.
Comparison wise error rate: Synonym for per-comparison error rate.
Co m partment models: Models for the concentration or level of material of interest over time. A
simple example is the washout model or one compartment model given by
E ½Y ðtÞ ¼ α þ β expðγtÞ; ðγ
4
0Þ
where Y(t) is the concentration at time t 0[Compartmental Analysis in Biology in
Medicine, 1972, J. A. Jacquez, Elsevier, New York.]
Compensatory equalization: A process applied in some
clinical trials
and intervention studies,
in which comparison groups not given the perceived preferred treatment are provided with
compensations that make these comparison groups more equal than originally planned.
[Critically Evaluating the Role of Experiments in Program Evaluation, 1994, ed. K. J.
Conrad, Jossey-Bass, San Francisco.]
Competingrisks: A term used particularly in
survival analysis
to indicate that the event of interest
(for example, death), may occur from more than one cause. For example, in a study of
smoking as a risk factor for lung cancer, a subject who dies of coronary heart disease is no
longer at risk of lung cancer. Consequently coronary heart disease is a competing risk in this
situation. [Statistics in Medicine, 1993, 12, 737–52.]
Comp lementary events:
Mutually exclusive
events A and B for which
PrðAÞþPrðBÞ¼1
where Pr denotes probability.
93
Comp lementary l og ^log tra nsfo rmati o n: A transformation of a proportion, p, that is often a
useful alternative to the
logistic transformation
. It is given by
y ¼ ln½lnð1 pÞ
This function transforms a probability in the range (0,1) to a value in (1; 1), but unlike
the logistic and
probit transformation
it is not symmetric about the value p = 0.5. In the
context of a
bioassay
, this transformation can be derived by supposing that the tolerances of
individuals have the
Gumbel distribution
. Very similar to the logistic transformation when p
is small. [Modelling Survival Data in Medical Research, 2nd edn, 2003, D. Collett,
Chapman and Hall/CRC, London.]
Complete case analysis: An analysis that uses only individuals who have a complete set of
measurements. An individual with one or more missing values is not included in the
analysis. When there are many individuals with missing values this approach can reduce
the effective sample size considerably. In some circumstances ignoring the individuals with
missing values can bias an analysis. See also available case analysis and missing values.
[Journal of the American Statistical Association, 1992, 87, 1227–37.]
Complete ennumeration: Synonym for census.
Complete e stimator: A weighted combination of two (or more) component estimators. Mainly
used in sample survey work. [Journal of the American Statistical Association, 1963, 58,
454–67.]
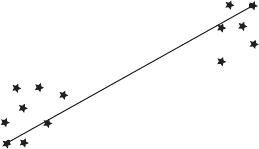
Complete li nkage cl uster analysis: An
agglomerative hierarchical clustering method
in which
the distance between two clusters is defined as the greatest distance between a member of
one cluster and a member of the other. The between group distance measure used is
illustrated in Fig. 39. [MV2 Chapter 10.]
Completely randomized design: An experimental design in which the treatments are allocated
to the experimental units purely on a chance basis.
Completeness: A term applied to a statistic t when there is only one function of that statistic that can
have a given expected value. If, for example, the one function of t is an unbiased estimator of
a certain function of a parameter, θ, no other function of t will be. The concept confers a
uniqueness property upon an estimator. [Kendall’s Advanced Theory of Statistics, Volume
2A, 6th ed., 1999, A. Stuart, K. Ord and S. Arnold, Arnold, London.]
Complete spatial randomness: A
Poisson process
in the plane for which:
*
the number of events N(A) in any region A follows a
Poisson distribution
with mean
ljAj;
*
given N(A)=n, the events in A form an independent random sample from the uniform
distribution on A.
Cluster A
Cluster B
d
AB
Fig. 39 Complete linkage distance for two clusters
A and B.
94
Here |A| denotes the area of A, and λ is the mean number of events per unit area. Often used
as the standard against which to compare an observed spatial pattern. [Spatial Data Analysis
by Example, Volume 1, 1985, G. Upton and B. Fingleton, Wiley, New York.]
Complex Bingham distributions: An exponential family with a
sufficient statistic
which is
quadratic in the data. Such distributions provide tractable models for landmark-based shape
analysis. [Journal of the Royal Statistical Society, Series B, 1994, 56, 285–299.]
Co m p lex su rvey da ta: Sample survey data obtained by using
cluster sampling
, unequal sampling
probabilities and stratification instead of
simple random sampling
.[Analysis of Complex
Surveys, 1989, C. J. Skinner, D. Holt and T. M. F. Smith, eds., Wiley, New York.]
Compliance: The extent to which participants in a
clinical trial
follow the trial protocol, for example,
following both the intervention regimen and trial procedures (clinical visits, laboratory
procedures and filling out forms). For clinical trial investigators it is an inescapable fact of
life that the participants in their trials often make life difficult by missing appointments,
forgetting to take their prescribed treatment from time to time, or not taking it at all but
pretending to do so. Because poor participant compliance can adversely affect the outcome
of a trial, it is important to use methods both to improve and monitor the level of compliance.
See also complier average causal effect and intention-to-treat analysis.[Clinical Trials in
Psychiatry, 2nd edn, 2008, B. S. Everitt and S. Wessely, Wiley.]
Complier average causal effect (CAC E ): The treatment effect among true compliers in a
clinical trial
. For a suitable response variable, the CACE is given by the mean difference in
outcome between compliers in the treatment group and those controls who would have
complied with treatment had they been randomized to the treatment group. The CACE may
be viewed as a measure of ‘efficacy’ as opposed to ‘effectiveness’.[Review of Economic
Studies, 1997, 64, 555–74.]
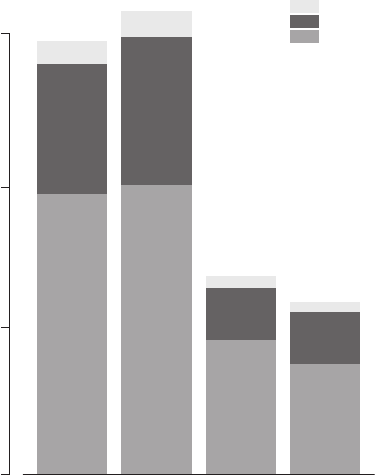
Co m ponen tbarchart: A
bar chart
that shows the component parts of the aggregate represented by
the total length of the bar. The component parts are shown as sectors of the bar with lengths
in proportion to their relative size. Shading or colour can be used to enhance the display.
Figure 40 gives an example.
Component -pl us-residua l plot: Synonym for partial-residual plot.
Composite estimators: Estimators that are a weighted combination of two or more component
estimators. Often used in sample survey work. [American Journal of Physical Anthropology,
2007, 133, 1028–1034.]
Composite hypothesis: A hypothesis that specifies more than a single value for a parameter. For
example, the hypothesis that the mean of a population is greater than some value.
Composite indicators: Indicators of multidimensional concepts, for example, sustainability, sin-
gle market policy and globalization, which cannot be captured by a single indicator. Such
indicators (or indices) are formed from combining a number of sub-indicators on the basis of
an underlying model of the multidimensional concept that is to be measured. [Handbook on
Constructing Composite Indicators: Methodology and User Guide, 2008, M. Nardo, M.M
Saisana, A. Saltelli and S. Tarantola, OECD publication.]
Co m pos it e l i ke lihoods: Pseudo-likelihoods constructed by pooling
likelihood
components, with
each component corresponding to a marginal or conditional event. Such likelihoods are used
to counter the problem of large computational demands produced in particular by the need to
evaluate integrals in many dimensions. [Biometrika, 2005, 92, 519–528.]
95
Composite sampling: A procedure whereby a collection of multiple sample units are combined in
their entirety or in part, to form a new sample. One or more subsequent measurements are
taken on the combined sample, and the information on the sample units is lost. An example
is
Dorfman’s scheme
. Because composite samples mask the respondent’s identity their use
may improve rates of test participation in senstive areas such as testing for HIV.
[Technometrics, 1980, 22, 179–86.]
Compositi onal data: A set of observations, x
1
; x
2
; ...; x
n
for which each element of x
i
is a
proportion and the elements of x
i
are constrained to sum to one. For example, a number of
blood samples might be analysed and the proportion, in each, of a number of chemical
elements recorded. Or, in geology, percentage weight composition of rock samples in terms
of constituent oxides might be recorded. The appropriate
sample space
for such data is a
simplex and much of the analysis of this type of data involves the
Dirichlet distribution
.
[MV2 Chapter 15.]
Compound bino mi al distr i buti o n: Synonym for beta binomial distribution
Compounddecisi o n pro bl em: The simultaneous consideration of n decision problems that have
an identical formal structure. [Annals of Statistics, 1993, 21, 736–745.]
Compound distributi o n: A type of probability distribution arising when a parameter of a
distribution is itself a random variable with a corresponding probability distribution.
See, for example,
beta-binomial distribution
. See also contagious distribution. [KA1
Chapter 5.]
Compound symmetry: The property possessed by a
variance–covariance matrix
of a set of
multivariate data
when its main diagonal elements are equal to one another, and additionally
its off-diagonal elements are also equal. Consequently the matrix has the general form;
Not good
Fairly good
Good
Southampton Swindon Jersey Guernsey
150010005000
Number of people
Fig. 40 Component bar
chart showing subjective
health assessment in four
regions.
96
¼
2
2
2
2
2
2
2
.
.
.
.
.
.
2
2
2
0
B
B
B
@
1
C
C
C
A
where ρ is the assumed common correlation coefficient of the measures. Of most impor-
tance in the analysis of
longitudinal data
since it is the correlation structure assumed by the
random intercept model
often used to analyse such data. See also Mauchly test. [MV2
Chapter 13.]
Computatio nal compl exity: The number of operations of the predominant type in an algorithm.
Investigations of how computational complexity increases with the size of a problem are
important in keeping computational time to a minimum. [Communications of the ACM,
1983, 26, 400–8.]
Co m p ut e r-ai ded d i agnos is: Computer programs designed to support clinical decision making.
In general, such systems are based on the repeated application of
Bayes’ theorem
. In some
cases a reasoning strategy is implemented that enables the programs to conduct clinically
pertinent dialogue and explain their decisions. Such programs have been developed in a
variety of diagnostic areas, for example, the diagnosis of dyspepsia and of acute abdominal
pain. See also expert system.[Biostatistics, A Methodology for the Health Sciences, 2nd
edn, 2004, G. Van Belle, L. D. Fisher P. J. Heagerty and T. S. Lumley, Wiley, New York.]
Computer al gebra: Computer packages that permit programming using mathematical expressions.
See also Maple and Mathematica.
Computer -assisted interviews: A method of interviewing subjects in which the interviewer
reads the question from a computer screen instead of a printed page, and uses the keyboard to
enter the answer. Skip patterns (i.e. ‘if so-and-so, go to Question such-and-such’) are built
into the program, so that the screen automatically displays the appropriate question. Checks
can be built in and an immediate warning given if a reply lies outside an acceptable range or
is inconsistent with previous replies; revision of previous replies is permitted, with auto-
matic return to the current question. The responses are entered directly on to the computer
record, avoiding the need for subsequent coding and data entry. The program can make
automatic selection of subjects who require additional procedures, such as special tests,
supplementary questionnaires, or follow-up visits. [Journal of Official Statistics, 1995, 11,
415–31; American Journal of Epidemiology, 1999, 149, 950–4.]
Co m p ut e r-inte ns i v e methods: Statistical methods that require almost identical computations
on the data repeated many, many times. The term computer intensive is, of course, a relative
quality and often the required ‘intensive’ computations may take only a few seconds or
minutes on even a small PC. An example of such an approach is the
bootstrap
. See also
jackknife. [MV1 Chapter 1.]
Co m p ut e r virus: A computer program designed to sabotage by carrying out unwanted and often
damaging operations. Viruses can be transmitted via disks or over
networks
. A number of
procedures are available that provide protection against the problem.
Concentrati o n matri x: A term sometimes used for the inverse of the
variance–covariance matrix
of a
multivariate normal distribution
.
Concentrationmeasure: A measure, C, of the dispersion of a categorical random variable, Y, that
assumes the integral values j; 1 j s with probability p
j
, given by
97

C ¼ 1
X
s
j¼1
p
2
j
See also entropy measure.[Agricultural Biological Forum, 2003, 6, 134–40.]
Concomitant variables: Synonym for covariates.
Concord ant mutati ons test: A statistical test used in cancer studies to determine whether or not
a diagnosed second primary tumour is biologically independent of the original primary
tumour. The test compares patterns of allelic losses at candidate genetic loci. It is a condi-
tional test, an adaptation of
Fisher’s exact test
, which requires no knowledge of the marginal
mutation probabilities. [Biometrics, 2007, 63, 522–530.]
Conditional distribution: The probability distribution of a random variable (or the
joint distribu-
tion
of several variables) when the values of one or more other random variables are held
fixed. For example, in a
bivariate normal distribution
for random variables X and Y the
conditional distribution of Y given X is normal with mean
2
þ
2
1
1
ðx Þ and variance
2
2
ð1
2
Þ. [KA1 Chapter 8.]
Conditiona l i ndependence g raph: A graph that displays relationships between variables such
that if two variables, a and b, are connected only via a third variable, c, then a and b are
conditionally independent given c. A simple example is shown in Figure 41 [Markov Chain
Monte Carlo in Practice, 1996, W. R. Gilks, S. Richardson and D. J. Spiegelhalter, Chapman
and Hall/CRC Press, London.]
Co nditi onal l ikeli h ood: The likelihood of the data given the
sufficient statistics
for a set of
nuisance parameters
. [GLM Chapter 4.]
Conditionalinference: An approach to inference that states that inference about a parameter, θ,in
a model, f (y;θ) should be conditional on any
ancillary statistic
for θ. This approach has
caused a great deal of discussion in the literature on the foundations of statistics.
[Biometrika, 1992, 79, 247–259.]
Conditionallogistic regression: A form of
logistic regression
designed to work with clustered
data, such as data involving matched pairs of subjects, in which subject-specific fixed effects
are used to take account of the matching. In order to take account of the matching in the
analysis of the observed data a
conditional likelihood
is constructed where conditioning is
on the sum of the responses in the matched pair, this being a
sufficient statistic
for the
subject-specific effect. [Modelling Binary Data, 2nd edition, 2003, D. Collett, Chapman
and Hall/CRC, London.]
Conditional mortality rate: Synonym for hazard function.
Conditional probability: The probability that an event occurs given the outcome of some other
event. Usually written, Pr(A|B). For example, the probability of a person being colour blind
given that the person is male is about 0.1, and the corresponding probability given that the
person is female is approximately 0.0001. It is not, of course, necessary that Pr(A|B)=Pr(B|
A); the probability of having spots given that a patient has measles, for example, is very high,
the probability of measles given that a patient has spots is, however, much less. If Pr(A|B)=Pr
a
b
c
Fig. 41 An example of a conditional independence
graph.
98