Everitt B.S. The Cambridge Dictionary of Statistics
Подождите немного. Документ загружается.

H aplotype analysis: The analysis of
haplotype
frequencies in one or more populations, with the
aim of establishing associations between two or more alleles, between a haplotype and a
phenotypic trait, or the genetic relationship between populations. [Statistics in Human
Genetics, 1998, P. Sham, Arnold, London.]
Hardy ^ Weinberg law: The law stating that both gene frequencies and genotype frequencies will
remain constant from generation to generation in an infinitely large interbreeding population
in which mating is at random and there is no selection, migration or mutation. In a situation
where a single pair of alleles (A and a) is considered, the frequencies of germ cells carrying A
and a are defined as p and q, respectively. At equilibrium the frequencies of the genotype
classes are p
2
(AA), 2pq(Aa) and q
2
(aa). [Statistics in Medicine, 1986, 5, 281–8.]
Harmonic analysis: A method of determining the period of the cyclical term S
t
in a
time series
of the form
X
t
¼ S
t
þ
t
where
t
represents the random fluctuations of the series about S
t
. The cyclical term is
represented as a sum of sine and cosine terms so that X
t
becomes
X
t
¼
X
i
ðA
i
cos ω
i
t þ B
i
sin ω
i
tÞþ
t
For certain series the periodicity of the cyclical component can be specified very accu-
rately, as, for example, in the case of economic or geophysical series which contain a strict
12-month cycle. In such cases, the coefficients {A
i
}, {B
i
} can be estimated by regression
techniques. For many series, however, there may be several periodic terms present with
unknown periods and so not only the coefficients {A
i
}, {B
i
} have to be estimated but
also the unknown frequencies {ω
i
}. The so-called
hidden periodicities
can often be
determined by examination of the
periodogram
which is a plot of I(ω) against ω where
IðωÞ¼
2
N
X
N
i¼1
X
t
cosðωtÞ
"#
2
þ
X
N
i¼1
X
t
sinðωtÞ
"#
2
8
<
:
9
=
;
and ω ¼ 2pp=N ; p ¼ 1; 2; ...; ½N=2; N is the length of the series. Large ordinates on this
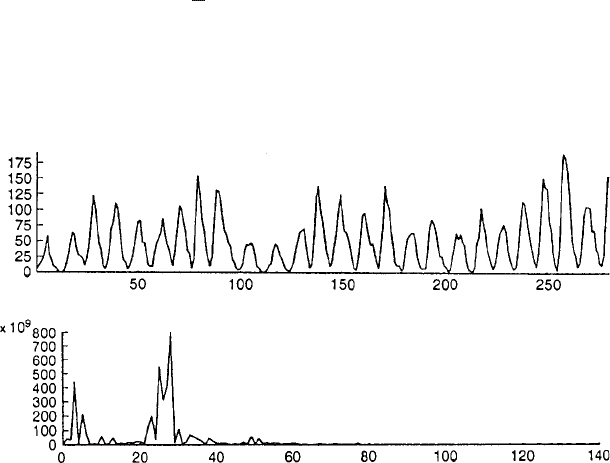
plot indicate the presence of a cyclical component at a particular frequency. As an
example of the application of this procedure Fig. 70 shows the sunspot series and the
Fig. 70 Sunspot activity and its periodogram (Reproduced from
Applications of Time Series
Analysis in Astronomy and Meteorology
by permission of the publisher, Chapman and Hall/CRC
Press London.)
199

periodogram of this series based on 281 observations. It is clear that the ordinate at
ω ¼ 2p 28=281, corresponding to a period of approximately 10 years, is appreciably
larger than the other ordinates. If several peaks are observed in the periodogram it
cannot be concluded that each of these corresponds to a genuine periodic component in
X
t
since it is possible that peaks may occur due simply to random fluctuations in the noise
term
t
. Various procedures for formally assessing periodic ordinates are available of
which the most commonly used are
Schuster’s test
,
Walker’s test
and
Fisher’s g statistic
.
See also spectral analysis, fast Fourier transform and window estimates. [TMS
Chapter 7.]
Harmonic mean: The reciprocal of the arithmetic mean of the reciprocals of a set of observations
x
1
; x
2
; ...; x
n
. Specifically obtained from the equation
1
H
¼
1
n
X
n
i¼1
1
x
i
Used in some methods of analysing
non-orthogonal designs
. The harmonic mean is either
smaller than or equal to the arithmetic mean and the
geometric mean
. [ARA Chapter 16.]
H a rr i ngto n and Fl em i ng G
p
tests: A class of linear rank test for comparing two
interval
censored samples
. Useful in testing for a difference between two or more
survival curves
or for a single curve against a known alternative. [
Biometrika
, 1982, 69, 553–66.]
H arris and Stevens forecast ing: A method of making short term forecasts in a
time series
that
is subject to abrupt changes in pattern and transient effects. Examples of such series are
those arising from measuring the concentration of certain biochemicals in biological
organisms, or the concentration of plasma growth hormone. The changes are modelled
by adding a random perturbation vector having zero mean to a linearly updated parameter
vector. [
Bayesian Forecasting and Dynamic Models
, 2nd edition, 1999, M. West and
J. Harrison, Springer Verlag, New York.]
Harris walk: A
random walk
on the set of nonnegative integers, for which the matrix of
transition
probabilities
consists of zeros except for the elements;
p
0;1
¼ 1
p
j;jþ1
¼ a
j
0
5
a
j
5
1; 1 j
5
1
p
j;j1
¼ 1 a
j
Har tley, Herman Otto (191 2^1980): Born in Berlin, Hartley obtained a Ph.D. degree in
mathematics from the University of Berlin in 1933. In 1934 he emigrated to England
where he worked with
Egon Pearson
in producing the
Biometrika Tables for Statisticians
.
In 1953 Hartley moved to Iowa State College in the USA and from 1963 to 1977
established and ran the Institute of Statistics at Texas A&M University. Contributed to
data processing,
analysis of variance
, sampling theory and
sample surveys
. Hartley was
awarded the S. S. Wilks medal in 1973. He died on 30 December 1980 in Durham, USA.
Har tley’s test: A simple test of the equality of variances of the populations corresponding to the
groups in a
one way design
. The test statistic (if each group has the same number of
observations) is the ratio of the largest (s
2
largest) to the smallest (s
2
smallest) within
group variance, i.e.
F ¼
s
2
largest
s
2
smallest
200

Critical values are available in many statistical tables. The test is sensitive to departures
from normality. See also Bartlett’s test and Box’s test.[Biometrika, 1950, 37, 308–12.]
Hat matrix : A matrix, H, arising in
multiple regression
, which is used to obtain the predicted values
of the response variable corresponding to each observed value via the equation
^
y ¼ Hy
The matrix H puts the ‘hats’ on the elements of y; it is a symmetric matrix and is also
idempotent
. Given explicitly in terms of
design matrix
, X as
H ¼ X ð X
0
XÞ
1
X
The diagonal elements of H are often useful diagnostically in assessing the results from
the analysis. See also Cook’s distance.[
Regression Analysis
, Volume 2, 1993, Ed.
M. S. Lewis-Beck, Sage Publications, London.]
Haugh’s test: A test for the independence of two
time series
which is based on the sum of
finitely many squares of residual cross-correlations. [
Canadian Journal of Statistics
, 1997,
25, 233–56.]
Hausd o rff di m ens io n: Synonym for fractal dimension.
Hausman misspecification test: A test for model misspecification that in its standard version
considers one estimator
^
β which is consistent under both correct and incorrect model
specification and another estimator
~
β which is consistent and efficient under correct
specification but inconsistent under misspecification. The null hypothesis is that both
^
β
and
~
β are consistent. The test statistic used is
ð
^
β
~
βÞ
0
½covð
^
βÞcovð
~
βÞ
1
ð
^
β
~
βÞ
0
which asymptotically has a chi-square null distribution with degrees of freedom equal to
the dimension of β. A common application is in testing multilevel models with random
effects versus fixed-effects models for clustered data. [Econometrica, 1978, 46, 1251–
1271.]
Hausman-Taylor estimator: An
instrumental variable estimator
for linear models for
panel
studies
where some
time-dependent covariates
and some time-invariant covariates are
endogenous in the sense of being correlated with the random intercept. [Econometrica,
1981, 49, 1377–1398.]
Hawthorne effect: A term used for the effect that might be produced in an experiment simply
from the awareness by the subjects that they are participating in some form of scientific
investigation. The name comes from a study of industrial efficiency at the Hawthorne Plant
in Chicago in the 1920s. [
Annals of Emergency Medicine
, 1995, 26, 590–4.]
Hazard function: The risk that an individual experiences an event (death, improvement etc.) in a
small time interval, given that the individual has survived up to the beginning of the interval.
It is a measure of how likely an individual is to experience an event as a function of time.
Usually denoted h(t), the function can be expressed in terms of the probability distribution
of the
survival times
f (t) and the
survival function
S(t), as h(t )=f (t)/S(t). The hazard function
may remain constant, increase, decrease or take on some more complex shape. The function
can be estimated as the proportion of individuals experiencing an event in an interval per unit
time, given that they have survived to the beginning of the interval, that is
^
hðtÞ¼
number of individuals experiencing an event in interval beginning at t
ðnumber of individuals surviving at tÞðinterval widthÞ
201
Care is needed in the interpretation of the hazard function because of both selection effects
due to variation between individuals and variation within each individual over time. For
example, individuals with a high risk are more prone to experience an event early, and
those remaining at risk will tend to be a selected group with a lower risk. This will result
in the hazard rate being ‘pulled down’ to an increasing extent as time passes. See also
survival function, bathtub curve and frailty models. [SMR Chapter 13.]
Hazard plotting: Based on the
hazard function
of a distribution, this procedure provides estimates
of distribution parameters, the proportion of units failing by a given time, percentiles of
the distribution, the behaviour of the failure rate of the units as a function of time, and
conditional failure probabilities for units at any time. [ Technometrics, 2000, 42,12–25.]
Hazard regression: A procedure for modelling the
hazard function
that does not depend on the
assumptions made in
Cox’s proportional hazards model
, namely that the log-hazard function is
an additive function of both time and the vector of covariates. In this approach,
spline functions
are often used to model the log-hazard function. [Statistics in Medicine, 1996, 15,1757–70.]
Head-banging smoother: A procedure for smoothing
spatial data
. The basic algorithm proceeds
as follows:
*
for each point or area whose value y
i
is to be smoothed, determine the N nearest
neighbours to location x
i
*
from among these N nearest neighbours, define a set of points around the point area,
such that the ‘triple’ (pair plus target point at x
i
) are roughly collinear. Let NTRIP be
the maximum number of such triplets
*
let (a
k
,b
k
) denote the (higher, lower) of the two values in the kth pair and let
A = median{a
k
}, B= median{b
k
}
*
the smoothed value corresponding to y
i
is
~
y
i
median{A, y
i
, B}. [IEEE Transactions
on Geosciences and Remote Sensing, 1991, 29, 369–78.]
Heady , James Austin (191 7^20 04): Born in Kuling, China, Heady studied mathematics at
Merton College, Oxford, United Kingdom from where he graduated in 1939. In 1946 he
was appointed to start a new Department of Statistics at St. Bartholomew’s Hospital in
London, and then in 1949 became a statistician in the Social Medicine Unit of the Medical
Research Council where he remained until 1975. During this period Heady produced
a long series of publications concerned with the social and biological factors in infant
mortality. Later he became interested in the methodology of dietary surveys. Heady died
in London on November 4th, 2004.
Healthylifeexpectancy(HLAE):The average number of years that a newborn child can
expect to live in good health. The measure is useful in assessing a health system’s effective-
ness in reducing the burden of disease. See also disability adjusted life years (DALYs).
[Demographic Research, 2009, 20, 467–494.]
Healthy worker effect: The phenomenon whereby employed individuals tend to have lower
mortality rates than those unemployed. The effect, which can pose a serious problem in
the interpretation of industrial
cohort studies
, has two main components:
*
selection at recruitment to exclude the chronically sick resulting in low
standardized
mortality rates
among recent recruits to an industry,
*
a secondary selection process by which workers who become unfit during employ-
ment tend to leave, again leading to lower standardized mortality ratios among long-
serving employees.
[Statistics in Medicine, 1986, 5,61–72.]
202
H eckman selecti on model: A model designed to obtain correct inference for regression models
based on nonrandom or “selected” samples. The Heckman selection model contains two
equations, a linear regression model of primary interest
Y
i
¼ x
0
i
β þ"
i
and a probit selection equation
S
i
¼ z
0
i
γ þ
i
determining that unit i is sampled if S
i
> 0 and not sampled if S
i
0. The error terms "
i
and
i
are assumed to be bivariate normal with zero means, Varð"
i
Þ¼
2
and Varð
i
Þ¼1, and
correlation .If ¼ 0, valid inference regarding the parameters of interest β can be
based on the substantive equation alone. However, there is “informative selection” if
6¼ 0. Valid inference must in this case be based on joint estimation of both equations
and estimators solely based on the substantive equation would be inconsistent. See also
Selection model.[Econometrica, 1979, 47, 153–161.]
Hellinger distance: A measure of distance between two probability distributions, f (x) and g(x)
given by
ffiffiffiffiffiffiffiffiffiffiffiffiffiffiffiffiffi
2ð1 Þ
p
where
¼
Z
ffiffiffiffiffiffiffiffiffiffiffiffiffiffiffiffiffiffi
f ðxÞgðxÞ
p
dx
See also Bhattacharya ’s distance. [MV2 Chapter 14.]
Hello-goodbye effect: A phenomenon originally described in psychotherapy research, but one
which may arise whenever a subject is assessed on two occasions, with some interven-
tion between the visits. Before an intervention a person may present himself/herself in
as bad a light as possible, thereby hoping to qualify for treatment, and impressing staff
with the seriousness of his/her problems. At the end of the study the person may want
to ‘please’ the staff with his/her improvement, and so may minimize any problems. The
result is to make it appear that there has been some improvement when none has
occurred, or to magnify the effects that did occur. [Journal of Clinical Psychology,
2000, 56, 853–9.]
Helmert contrast: A
contrast
often used in the
analysis of variance
, in which each level of a factor
is tested against the average of the remaining levels. So, for example, if three groups
are involved of which the first is a control, and the other two treatment groups, the first
contrast tests the control group against the average of the two treatments and the second
tests whether the two treatments differ. [KA1 Chapter 11.]
Helsinki declaration: A set of principles to guide clinicians on the ethics of clinical trials and other
clinical research. See also Nuremberg code.[Biostatistics: A Methodology for the Health
Sciences, 2nd edition, 2004, E. Van Belle, L. D. Fisher, P. J. Heagerty and T. S. Lumley,
Wiley, New York.]
Herbicide bioassay: A procedure for establishing a
dose-response curve
in the development of
new herbicides. As no objective death criteria can be given for plants, a graded response
such as biomass or height reduction must be considered. [Herbicide Bioassays, 1993, ed.
J. C. Streibig and P. Kudsk, CRC, Boca Raton, Florida.]
Hess, Irene (1910^2009): Born in Muhlenberg County, Kansas, Hess received a bachelor’s
degree in mathematics from Indiana University in 1931. After then studying statistics at
the University of Michigan, she joined the US. Bureau of Labour Statistics in 1941 and
then joined the US Census Bureau where she implemented the new ideas of
probability
203

sampling
. Later Hess became director of the Institute of Social Research at the University
of Michigan and was responsible for teaching several generations of sampling statisti-
cians how to translate theory into practice. She died on the 5th July, 2009, in Ann Arbor,
USA.
Herfindahl index: An index of industry concentration given by
H ¼
X
n
i¼1
½s
i
=S
2
where S is the combined size of all firms in an industry (scaled in terms of employees,
sales, etc.) and s
i
is the size of the ith firm and there are n firms ranked from largest to
smallest. Concentration increases with the value of the index. [Statistical Science, 1994, 9,
94–108.]
Hermite functions: Functions
j
ðxÞ given by
j
ðxÞ¼ð2
j
j!p
1
2
Þ
1
2
expð
1
2
x
2
ÞH
j
ðxÞ
where H
j
ðxÞ is the Hermite polynomial defined by
H
j
ðxÞ¼ð1Þ
j
expðx
2
Þd
j
fexpðx
2
Þg=dx
j
[KA1 Chapter 6.]
H e rm ite po lyno m ia ls: See Hermite functions.
Herzberg’sformula: See shrinkage formulae.
Hessian matrix: The matrix of second-order partial derivatives of a function f of n independent
variables x
1
, x
2
, ..., x
n
with respect to those variables. The element in the ith row and the
jth column of the matrix is therefore ∂
2
y/∂x
i
∂x
j
. In statistics the matrix most often occurs
for the
log-likelihood
as a function of a set of parameters. The inverse of the matrix then
gives standard errors and covariances of the
maximum likelihood estimates
of the
parameters. The Hessian is essentially the observed information matrix in contrast to the
Fisher information matrix
where expectations are taken. [MVA Chapter 6.]
Heterogeneous: A term used in statistics to indicate the inequality of some quantity of interest
(usually a variance) in a number of different groups, populations, etc. See also homo-
geneous. [MV1 Chapter 3.]
Heteroscedasticity : A random variable is heteroscedastic if its variance depends on the values
of another variable. The opposite case is called homoscedastic.
Hettmansperger^McKean test: A
distribution free method
for assessing whether specific
subsets of the regression parameters in a
multiple regression
are zero. [NSM Chapter 9.]
Heuristic computer program: A computer program which attempts to use the same sort of
selectivity in searching for solutions that human beings use.
Heywood cases: Solutions obtained when using
factor analysis
in which one or more of the
variances of the
specific variates
become negative. [MV2 Chapter 12.]
H idden Ma rko v models: An extension of
finite mixture models
which provides a flexible
class of models exhibiting dependence and a possibly large degree of variability. [Hidden
Markov and Other Models for Discrete Valued Time Series , 1997, I. L. MacDonald and
W. Zucchini, Chapman and Hall/CRC Press, London.]
204
Hidden periodicities: See harmonic analysis.
Hidden time effects: Effects that arise in data sets that may simply be a result of collecting the
observations over a period of time. See also cusum. [SMR Chapter 7.]
H ierarchical clusteri ng: See agglomerative hierarchical clustering.
Hierarchical de sign: Synonym for nested design.
H ierarchical li kelihood: A somewhat controversial approach to estimating the parameters of
generalized linear mixed models
that treats random effects as parameters. [Generalized
Linear Models with Random Effects: Unified Analysis via H-Likelihood, 2006, Y. Lee,
J. A. Nelder and Y. Pawitan, Chapman and Hall/CRC, Boca Raton.]
Hierarchical models: A series of models for a set of observations where each model results from
adding, deleting or constraining parameters from other models in the series. Alternatively,
synonym for
multilevel model
.
Higgins’slaw: A ‘law’ that states that the prevalance of any condition is inversely proportional
to the number of experts whose agreement is required to establish its presence.
High breakdown methods : Methods that are designed to be resistant to even multiple severe
outliers
. Such methods are an extreme example of
robust statistics
.[Computational
Statistics, 1996, 11, 137–46.]
High-dimensional data: A term used for data sets which are characterised by a very large
number of variables and a much more modest number of observations. In the 21
st
century
such data sets are collected in many areas, for example, text/web
data mining
and
bioinformatics
. The task of extracting meaningful statistical and biological information
from such data sets present many challenges for which a number of recent methodological
developments, for example,
sure screening methods, lasso
, and
Dantzig selector
, may be
helpful. [Nature Reviews Cancer, 2008, 8,37–49.]
H i gher criticism: A
multiple-comparison test
concept arising from the situation where there are
many independent tests of significance and interest lies in rejecting the joint null hypothesis.
A fraction of the observed significances at a given α-level is compared to the expected
fraction under the joint null and the difference between the two quantities is standardized
and this standardized value then maximised over a range of significance levels to give the
higher criticism statistic. This statistic is effective in assessing whether n normal means are
all zero against the alternative that a small fraction is nonzero. [Annals of Statistics, 2004,
32, 962–994.]
Highest post er ior density regi on: See Bayesian confidence interval.
High-throughput data: Data produced by modern biological assays and experiments which
supply thousands of measurements per sample and where the sheer amount of data increases
the need for better models to enhance inference. See also high-dimensional data.
[Bioinformatics, 2007, 23, 906–909.]
Hill, Austin Bradford (1897^1991 ): Born in Hampstead, London, Hill served as a pilot in World
War I. Contracting tuberculosis prevented him taking a medical qualification, as he would
have liked, so instead he studied for a London University degree in economics by corre-
spondence. His interest in medicine drew him to work with the Industrial Fatigue Research
Board, a body associated with the Medical Research Council. He improved his knowledge
of statistics at the same time by attending
Karl Pearson
’s lectures at University College. In
205
1933 Hill became Reader in Epidemiology and Vital Statistics at the recently formed
London School of Hygiene and Tropical Medicine (LSHTM). He was an extremely suc-
cessful lecturer and a series of papers on Principles of Medical Statistics published in
the Lancet in 1937 were almost immediately reprinted in book form. The resulting text
remained in print until its ninth edition in 1971. In 1947 Hill became Professor of
Medical Statistics at the LSHTM and Honorary Director of the MRC Statistical Research
Unit. He had strong influence in the MRC in particular in their setting up of a series of
randomized controlled clinical trials, the first involving the use of streptomycin in pulmo-
nory tuberculosis. Hill’s other main achievment was his work with Sir Richard Doll
on a case-control study of smoking and lung cancer. Hill received the CBE in 1951, was
elected Fellow of the Royal Society in 1954 and was knighted in 1961. He received the
Royal Statistical Society’s Guy medal in gold in 1953. Hill died on 18 April, 1991, in
Cumbria, UK.
Hill-climbing algorithm: An algorithm used in those techniques of
cluster analysis
which seek
to find a partition of n individuals into g clusters by optimizing some numerical index of
clustering. Since it is impossible to consider every partition of the n individuals into g
groups (because of the enormous number of partitions), the algorithm begins with some
given initial partition and considers individuals in turn for moving into other clusters,
making the move if it causes an improvement in the value of the clustering index. The
process is continued until no move of a single individual causes an improvement. See
also K-means cluster analysis.[Cluster Analysis, 4th edition, 2001, B. S. Everitt,
S. Landau and M. Leese, Arnold, London.]
Hinge: A more exotic (but less desirable) term for
quartile
.
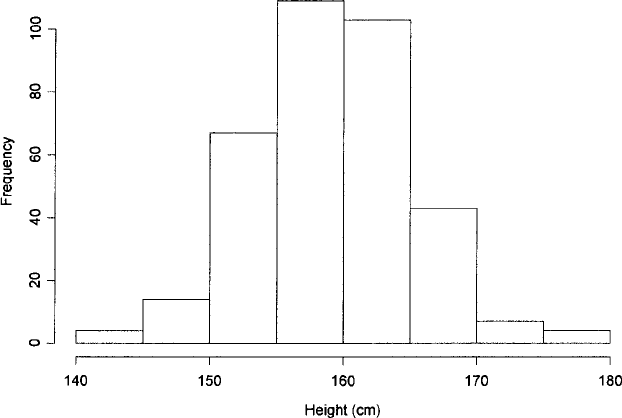
Histogram: A graphical representation of a set of observations in which class frequencies are
represented by the areas of rectangles centred on the class interval. If the latter are all
equal, the heights of the rectangles are also proportional to the observed frequencies.
A histogram of heights of elderly women is shown in Fig. 71. [SMR Chapter 2.]
Fig. 71 A histogram of heights of elderly women.
206
Historical controls: A group of patients treated in the past with a standard therapy, used as the
control group for evaluating a new treatment on current patients. Although used fairly
frequently in medical investigations, the approach is not to be recommended since possible
biases, due to other factors that may have changed over time, can never be satisfactorily
eliminated. See also literature controls. [SMR Chapter 15.]
Historical prospective studies: A ‘prospective study’ in which the cohort to be investigated
and its subsequent disease history are identified from past records, for example, from
information of an individual’s work history. [American Journal of Individual Medicine,
1983, 4, 651–7.]
Hit rate: A term occasionally used for the proportion of correct classifications in a
discriminant analysis
.
H-likelihood: See hierarchical likelihood.
HLM: Software for the analysis of
multilevel models
. See also MLwiN. [Scientific Software
International Inc., 7383 N. Lincoln Ave., Suite 100, Lincolnwood, IL 60712, USA.]
Hodges^Lehmann estimator: An estimator for the location difference of two uncensored data
samples, y
1
; y
2
; ...; y
n
1
and y
n
1
þ1
; ...; y
n
; n ¼ n
1
þ n
2
, given by
^
D
HL
¼ medianfðy
i
y
j
Þ : i ¼ 1; ...; n
1
; j ¼ n
1
þ 1; ...; ng
[Nonparametric Statistical Methods, 2nd edition, 1999, M. Hollander and D. A. Wolfe,
Wiley, New York.]
Hoeffding test: A
distribution free method
for testing for the independence of two random
variables X and Y, that is able to detect a broader class of alternatives to independence
than is possibly by using sample correlation coefficients. [NSM Chapter 8.]
Hoeffding’sinequality:A result from probability theory that gives an upper bound on the
probability for the sum of random variables to deviate from its expected value. [Journal of
the American Statistical Association, 1963, 58,13–30.]
Hoeffding, Wassily (191 4^1991 ): Born in Mustamaki, Finland, Hoeffding began his university
education studying economics but quickly switched to mathematics eventually earning
a Ph.D. degree from Berlin University in 1940 with a dissertation on nonparametric
measures of association and correlation. He emigrated to the USA in 1946 settling in
Chapel Hill, North Carolina. Hoeffding made significant contributions to
sequential
analysis
, statistical
decision theory
and
central limit theorems
. He died on 28 February
1991 in Chapel Hill.
Hogbe n, Lan celot (1895^1975): Born in Southsea, Hampshire, Hogben studied at Cambridge.
He was a man of remarkable intellect and a great communicator who made important
and original contributions in both theoretical and applied science. Hogben held academic
appointments in zoology in England, Scotland, Canada and South Africa before becoming
Professor of Zoology at Birmingham from 1941 to 1947, and then Professor of Medical
Statistics at the same university from 1947 to 1961. During his career he held five
university chairs. Best remembered for his popular book, Mathematics for the Millions.
Hogben died on 22 August 1975.
Holdout estimate: A method of estimating the
misclassification rate
in a
discriminant analysis
.
The data is split into two mutually exclusive sets and the classification rule derived from
one and its performance evaluated on the other. The method makes inefficient use of the
data (using only part of them to construct the classification rule) and gives a pessimistically
207

biased estimate of the derived rule’s misclassification rate. [ Pattern Recognition,
A Statistical Approach, 1982, P. A. Devijver and J. Kittler, Prentice Hall Inc., London.]
H oldo ver effect: Synonym for carryover effect.
Holgate, Philip (1934^1993): Born in Chesterfield, UK, Holgate attended Newton Abbot
Grammar School and then entered Exeter University in 1952 to read mathematics. He
began his career as a school teacher, teaching mathematics and physics at Burgess Hill
School, Hampstead. Holgate’s career as a statistician began in 1961 when he joined the
Scientific Civil Service at Rothamsted. In 1967 he took up a lecturer post at Birkbeck
College, London, progressing to professor in 1970. Holgate’s statistical work was primarily
in the area of stochastic processes in biology, and he also made seminal contributions to
non-associative algebras.
Hollander test: A
distribution free method
for testing for bivariate symmetry. The null hypothesis
tested is the two random variables X and Y are exchangeable. [NSM Chapter 3.]
Homogeneous: A term that is used in statistics to indicate the equality of some quantity of interest
(most often a variance), in a number of different groups, populations, etc. See also hetero-
geneous. [SMR Chapter 7.]
Horseshoe shape: See seriation.
Horvitz^Thompson estimator: An unbiased estimator of the total size of a population when
sampling is with or without replacement from a finite population and sampling unit i has
probability p
i
of being included in the sample. The estimator does not depend on the number
of times a unit may be selected, since each unit is utilized only once in the formula
^τ ¼
X
i¼1
y
i
p
i
where is the effective sample size (the number of distinct units in the sample) and y
i
is the
number of individuals, animals or species observed in the ith sampling unit. If the proba-
bility that both unit i and unit j are included in the sample is p
ij
and all these joint
inclusion
probabilities
are greater than zero then an unbiased estimator of the variance of ^τ is
varð^τÞ¼
X
i¼1
1
p
2
i
1
p
i
y
2
i
þ 2
X
i¼1
X
j
4
i
1
p
i
p
j
1
p
ij
y
i
y
j
See also Hansen–Hurwitz estimator.[Experimental and Ecological Statistics, 2003, 10,
115–127.]
Hosmer-Lemeshow test: A goodness-of-fit test used in
logistic regression
, particularly when
there are continuous covariates. Units are divided into
deciles
based on predicted proba-
bilities and a 2 × 10 contingency table of expected and observed frequencies for the
deciles obtained. The Hosmer-Lemeshow test statistic is the Pearson chi-square statistic
for this contingency table and has an approximate
chi-squared distribution
with 8 degrees
of freedom if the model is correct. The test has limited power. [Applied Logistic
Regression, 2nd edn, 2000, D. W. Hosmer and S. Lemeshow, Wiley, New York.].
Hospital controls: See control group.
Hot deck: A method widely used in surveys for imputing missing values. In its simplest form the
method involves sampling with replacement m values from the sample respondents A
r
to
an item y, where m is the number of non-respondents to the item and r is the number of
respondents. The sampled values are used in place of the missing values. In practice, the
208