Feny? D. (Ed.) Computational Biology
Подождите немного. Документ загружается.

100 Gronwald and Kalbitzer
NMR spectroscopy to the validation of a predicted structure
without using NMR directly for structure determination. However,
with the present state of the art, this seems only to be possible
when structures of close homologues are readily available.
The validation of structures has two important aspects: the
proof that (1) the obtained structure represents a solution consis-
tent with all experimental data and (2) that the experimental data
are sufficient to define the obtained structure as a unique solution
within the limits of a predefined accuracy. For the first condition,
a number of methods have already been reported, the most
important one (but still far from optimal) is probably the calcula-
tion of quantities such as NMR R-factors. For practical purposes,
the required quality of a structure is dependent on the specific
problem to be solved. The amount of time and resources needed
usually increases rapidly with the demand on quality (resolution).
In addition, one would demand that the structures obtained from
automated procedures should be at least as accurate as those
obtained from manual data evaluation. In the so-called top-down
approach that is described here, one starts from a trial structure
and uses the structure information contained in the spectra to
obtain iteratively improved structures and resonance assignments
(Fig. 1). The trial structure may consist in the two extreme cases
either of an arbitrary random structure or of the well-defined
structure of a close homologue.
In the following section, we will use the AUREMOL example
shown in Fig. 1 to describe the necessary steps of automated
structure determination in more detail. Note that many of the
details given below are also applicable to other programs for auto-
mated protein NMR structure determination.
All relevant information about the considered biomolecule, for
example, protein should be collected in a molecule-specific local
database such as primary sequence information, composition of
the used buffer, and physical parameters, for example, pH and
temperature. A general local database provides additional infor-
mation. It contains data such as the chemical structure of the
amino acids, chemical shifts and their distributions, J-couplings,
Karplus parameters, and temperature-dependent viscosities.
Structures and sequences of homologous proteins can be loaded
from nonlocal databases. Based on this information, a trial assign-
ment and a trial structure are generated. It should be noted that
for the basic algorithm one has to allow that these starting values
can be far removed from the final results. For example, it must be
possible to start with an extended strand as a starting structure.
Although it is possible to start with an extended strand structure,
it is clear that it is advantageous to use the best structural model
available (Fig. 1). In case that homologous structural information
3.1. Molecule
Definition and Local
and Global Databases
3.2. Homology
Modeling
101
Automated Protein NMR Structure Determination in Solution
is available, homology modeling approaches can be successfully
applied for obtaining a starting model. AUREMOL contains for
this purpose the PERMOL module. PERMOL (27, 28) is a
restraint-based program for homology modeling of peptides and
proteins. Restraints are generated from the information contained
in structures of homologous template proteins. Employing the
restraints generated by PERMOL, three-dimensional structures
are obtained using MD programs such as CYANA (29), CNS
(30), or XPLOR-NIH (31). AUREMOL provides a direct inter-
face to these programs. In contrast to other programs, PERMOL
is mainly based on the use of dihedral angle and hydrogen bond
information which is optimally suited to preserve the local sec-
ondary structure, and on long-range distance restraints for the
representation of the general fold.
The following tasks concerning the spectra database are mostly
performed outside of AUREMOL. Besides the optimization of
the protein production, automated NMR data evaluation has the
highest potential for substantially reducing the total time needed
in automated NMR structure determination. Independent of the
specific strategy used in the automated NMR structure determi-
nation, the analysis of the multidimensional NMR data comprises
the following steps: (1) data processing including improvement
3.3. Spectra Database
Molecule definition
General and
molecule-specific
databases
Spectra
database
Automated pre-
processing of
spectra
Side-chain
assignment
(GSA, TV)
NOE assignment
(KNOWNOE)
Distance
restraints
(REFINE)
Structure-
calculation
(outside)
Structure
validation
(RFAC)
Done
Homology
modeling
Automated
backbone
assignment
Spectra
simulation
(RELAX
)
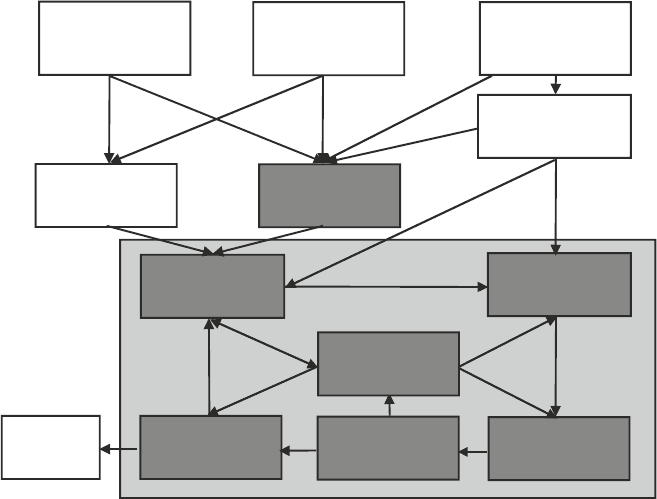
Fig. 1. Overview of the general top-down strategy used within the program AUREMOL. The most central modules are
highlighted in grey.
102 Gronwald and Kalbitzer
of spectra quality and signal enhancement, (2) pattern recognition
and classification of objects, and (3) interpretation of objects and
classes of objects. After recording a set of multidimensional spec-
tra, the proper processing of the data is the first critical step, since
information lost in this step cannot be regained in subsequent
steps. Optimal processing of the data is especially important in
automated data analysis since computer algorithms are usually
not as good as human experts in distinguishing artifacts from true
signals. Appropriate time domain filtering of the data is one of the
most important steps performed prior to Fourier transformation.
The key assumption used in these filtering methods is that reso-
nance signals, noise, and artifacts have different time constants so
that their contribution to the total detection signal varies during
the acquisition period. Accordingly, a reduction in the intensity of
the initial part of the time-domain signal decreases contributions
from component signals, which slowly vary in the frequency
domain, such as baseline rolls and tails of resonance signals.
A reduction in the intensity of the final segments of time-domain
signal decreases the intensity of rapidly varying components such
as instrumental noise and as a consequence enhances not only the
signal-to-noise ratio but also increases the line width (line broad-
ening). In typical spectra used for automated protein structure
determination such as 3D triple resonance and 3D NOESY spectra,
a maximum signal-to-noise ratio is usually required to detect even
weak signals, so in general, it is recommended to adjust the window
(filter) functions for an optimal signal-to-noise ratio and to accept
a slight increase in line width. We recommend using the 90°
shifted squared sine bell or Lorentzian-to-Gaussian transformations
for such applications (see also Notes 5–7 and 9).
A flat base plane is not only important for the correct integration
of multidimensional NMR spectra, where base plane variation can
dominate the integral, but also for peak recognition, where a
threshold must be defined to sort resonance peaks from noise
spikes. The fundamental assumption is that the base plane is flat
in the absence of signals and that the slopes of resonance peaks
are greater than those of base plane artifacts. Those regions which
contain no cross peaks can either be defined by the user (32–34)
or identified automatically by the program (35–37). However, the
methods that are more convenient for the user are those which
automatically identify base plane points. At least for spectra with
similar signal-to-noise ratios, line widths, and spectral resolution,
these automated routines work well and can be recommended.
The simplest base plane correction method fits the baseline of each
row to a cubic Lagrange polynomial where only three reference
columns, which contain no signals, are defined (33). After correction
of all the rows, the same method is applied to the correspon-
ding columns. A similar method is implemented in the program
3.3.1. Base Plane
Correction in the
Frequency Domain
103
Automated Protein NMR Structure Determination in Solution
TOPSPIN, where the baseline points are automatically identified
and the baseline is fitted to a polynomial of up to sixth order.
Better results are obtained using the spline method (32), where
an arbitrary number of cross-peak free rows and columns can be
defined. The spline function then approximates the base plane
between two neighboring points using a cubic polynomial func-
tion (see also Notes 8–10).
The signal of the physiological solvent, H
2
O, is by far the most
intense feature in
1
H NMR spectroscopy of biological macromole-
cules and causes spectral artifacts even when strongly attenuated
by presaturation or selective excitation. Independent component
analysis (ICA) or singular spectrum analysis (SSA) appear to be
promising new approaches in this regard since no spectrum-
dependent parameters have to be adjusted (38, 39).
The next critical step in any manual or automated structure
determination project concerns the proper preprocessing of the
various spectra for the optimal extraction of information.
Since, in general, a set of spectra is used in any automated structure
determination process, it is important that all spectra have been
referenced properly; this is usually achieved by using an internal
standard such as DSS or TSP. For heteronuclei, it is advisable to
use an indirect referencing scheme (40–42). The first and most
important step in the automated spectra analysis is the recognition
of resonance peaks which must be separated from the background.
In principle, this step called peak picking is a straightforward
procedure in multidimensional spectra since a relative maximum
(or minimum) is defined by the property that all adjacent data
points have a lower (or higher) intensity. However, since reso-
nance peaks must be distinguished from the large number of noise
and artifact signals, additional criteria must be defined. Approaches
to automated peak picking can usually be divided into three types:
(1) threshold-based methods, (2) peak shape-based methods, and
(3) Bayesian approaches. (1) The simplest and most widely used
criterion is the intensity threshold criterion, that is, only peaks with
absolute intensities above a specific threshold are recognized as
true resonance peaks (43–48). In many cases, a global threshold
is not applicable for the whole spectrum; therefore, programs
such as AUTOPSY (49) and AUREMOL allow the automatic
calculation of local thresholds. Since the reliability of automatic
assignment procedures critically depends on a high ratio of true
peaks versus noise and artifact signals, optimal reduction of the
number of noise and artifact contributions is mandatory. However,
true signals lost in this filtering step can never be regained in
3.3.2. Removal of Spectral
Artifacts
3.4. Automated
Pre-processing
of Spectra for
Information Extraction
3.4.1. Peak and Multiplet
Recognition
104 Gronwald and Kalbitzer
subsequent stages. A simple method for significantly reducing the
number of noise and artifact peaks is the exclusion of areas from
the peak search where no meaningful resonances can be expected.
Such spectral areas include regions outside the spectral range of
the molecule under investigation and spectral regions where reso-
nance peaks cannot be separated from artifact peaks (e.g., near
the water t
1
-ridge). In programs such as AURELIA (50) and
AUREMOL, these spectral regions can be defined interactively by
the user. (2) Additional information can be derived from the line
shape itself. With a segmentation procedure, the n-dimensional
line widths can be determined and peaks with very small line
widths (i.e., noise spikes) or very large line widths (ridges and
baseline rolls) can be automatically removed (51). (3) A Bayesian
approach coupled to a multivariate linear discriminant analysis of
the data (52) can be used as a generally applicable method for the
automated classification of multidimensional NMR peaks. The
analysis relies on the assumption that different signal classes have
different distributions of specific properties such as line shapes,
line widths, and intensities. In addition, a nonlocal feature is
included that takes into account the similarities of peak shapes in
symmetry-related positions. The calculated probabilities for the
different signal class memberships are realistic and reliable with a
high efficiency of discriminating between peaks that are true signals
and those that are not (53) (see also Notes 11–13).
The basis for macromolecular structure determination in solution
is still given by distance information from multidimensional NOE
data. As a consequence, automated routines for NOE integration
are required. Accurate integration of spectral cross-peaks demands
a reliable definition of the cross-peak area. However, such a
definition is always a compromise between requirements that the
integration area be as large as possible so that a complete integra-
tion is obtained, and also, as small as possible to reduce the
influence from artifacts associated with baseline rolls and tails of
other peaks. A similar approach defines the peak integration area
using an iterative “region-growing” algorithm (44, 51, 54), which
recognizes all data points that are part of a given cross-peak; the
integration can be performed based on a user-defined threshold
level. In AUREMOL, this threshold is defined relative to the
maximum value of the peak to ensure that the relative volumes are
directly proportional to the strength of interaction. This automatic
integration procedure works surprisingly well even for overlapping
peaks as long as the peak maxima are separately visible and there-
fore recognizable by the peak picking procedure. In a different
approach, peaks are fitted by a set of reference peaks defined by the
user (48, 55). This approach is probably best suited in cases where
peaks strongly overlap; however, it demands a careful selection of
the reference peaks by the user and is therefore not applicable for
fully automated applications (see also Notes 14–16).
3.4.2. Signal Integration
105
Automated Protein NMR Structure Determination in Solution
Very different approaches have been published in the literature
for this stage of the automated structure determination process.
In this section, we will summarize the methods in use for spin
system recognition and sequential resonance assignments that are
necessary steps in most schemes proposed for automated structure
determination in solution. For the methods described in this section,
usually four separate steps are necessary, which can vary in the
order they are applied and sometimes several steps are performed
simultaneously (2). These steps are (a) grouping of resonances
from one or more spectra to spin systems, (b) association of spin
systems with amino acid types, (c) linking of spin systems to
smaller or longer fragments, and (d) mapping of fragments
obtained from step (c) to the primary sequence. The routine
implemented in AUREMOL calculates sequential assignments
based on information obtained from triple resonance spectra such
as HNCA and CBCANH spectra. As input, a list of so called
pseudo residues is used where signals from the various spectra are
grouped into spin systems. Here, the user should check that the
number of obtained spin systems corresponds to the number of
residues in the primary sequence. A too high number indicates
the presence of extensive noise and/or artifacts, whereas a too
low number hints either poor spectra quality and/or insufficient
preprocessing of the spectra. Next, individual spin systems are
simultaneously connected to longer fragments and mapped to the
primary sequence. For this purpose, a simulated annealing like
algorithm that minimizes a pseudo energy is used. The used
energy function contains a term that describes the matching of
the individual fragments to each other and a term that facilitates
the mapping to the primary sequence based on the comparison of
expected and observed chemical shifts (also see Note 17).
The other steps in the AUREMOL structure determination
process are performed in an iterative fashion.
The basic idea for the assignment of side-chain resonances is the
iterative comparison of simulated and experimental NOESY spectra
to drive the assignment process. Using the preliminary structural
model, NOESY spectra are simulated. Each signal is simu lated with
its proper line shape and volume. The shifts for the simulated signals
are randomly assigned to positions where signals are present in the
corresponding experimental spectra. In case that a start assignment
is provided as input, the shifts are assigned accor ding to the start
assignment. As partial start assignment the resonance line assign-
ment of the backbone atoms obtained in the previous step may be
used. In the next step, the resulting simulated spectrum is compared
with the experimental one with respect to line shapes and signal
volumes. The degree of accordance is expressed as a probability.
In the following section, a quenching protocol is applied to the
simulation procedure to improve the agreement of the spectra.
3.5. Automated
Backbone Assignment
of Resonance Lines
3.6. Side Chain
Assignment (GSA)
106 Gronwald and Kalbitzer
A random perturbation swaps the shifts of two simulated signals
and the probability of accordance is recalculated. If the new
signal assignment leads to an improved agreement with the
experimental data, it is accepted, otherwise declined. This method
is repeated until the agreement between experiment and simu-
lation does not improve any further. As a result, a sequential
chemical shift assignment is obtained that can explain the experi-
mental spectra with the final probability of accordance. Note that
the output is a list of chemical shifts contai ning in an ideal case the
complete side- and main-chain resonance line assignment, but it
is not a fully assigned NOESY spectrum. Other well-established
methods for side-chain assignments are based, for example, on
the use of 3D
1
H–
13
C HCCH-TOCSY spectra. However, while
main-chain assignments can be obtained in a fully automated
fashion in many cases, for side-chain assignments often manual
intervention is still required (56). These difficulties stem on
one hand from missing peaks due to incomplete TOCSY transfer
and on the other hand from overlapping signals. To our knowledge,
the FLYA package (25) is currently the only published software
suite that has successfully fully automated this step by combining
side-chain assignments, NOE-assignment, and structure calcula-
tions (also see Notes 18 and 19).
In the previous two steps, the resonance line assignment of the
backbone and side-chain resonances has been obtained. The next
step is the complete NOE assignment including all structurally
relevant long-range signals. For this purpose, several strategies have
been published in the literature, of which two widely used methods
are the r
−6
averaging of ambiguous restraints in ARIA (57) and the
network anchoring algorithm (58) implemented in CYANA (29).
We will discuss here the probabilistic method KNOWNOE (59)
implemented in AUREMOL. It is applicable when the sequential
resonance line assignment has been fully or almost completely
achieved. Structural information, when available is helpful in the
assignment process especially for larger systems, but it is not
required. KNOWNOE contains as a central part a knowledge driven
Bayesian algorithm for solving ambiguities in the NOE assignments.
These ambiguities arise mainly from chemical shift degenerancies,
which allow multiple assignments of cross peaks. Statistical tables in
the form of atom-pairwise volume probability distributions (VPDs)
were derived from a set of 1,000 protein NMR structures. VPDs for
all assignment possibilities relevant to the assignments of inter proton
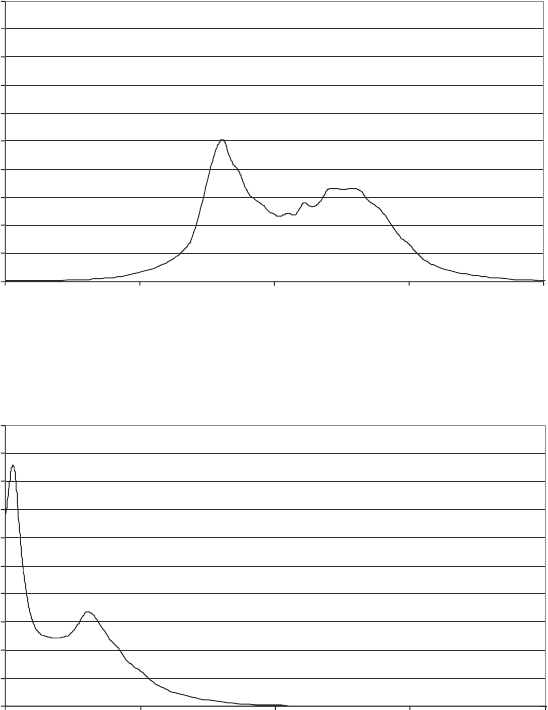
NOEs were calculated. Two examples are shown in Fig. 2. They
basically contain expected volume distributions for a given assign-
ment possibility. It is evident that, for example, for an intraresidual
assignment another volume distribution is expected than for a long-
range assignment. Therefore, they can be used together with the
known cross-peak volume to solve ambiguous NOE assignments.
3.7. NOE Assignment
(KNOWNOE)
107
Automated Protein NMR Structure Determination in Solution
Val Hα/Gln Hα(i,j=i+1)
Val Hα/Gln Hα(i,j=i+3)
V
ij
[nm
3
]
V
ij
[nm
3
]
P
[nm
–3
]
P
[nm
–3
]
0.00000 0.00005 0.00010 0.00015 0.00020
0.00000 0.00005 0.00010 0.00015 0.00020
0
5000
10000
15000
20000
25000
30000
35000
40000
45000
50000
0
5000
10000
15000
20000
25000
30000
35000
40000
45000
50000
Fig. 2. Examples of volume probability distributions derived from 1,000 non homologous protein structures.
With these data for a given cross peak, with N possible
assignments A
i
(i = 1,…, N), the conditional probabilities
P(A
i
, a|V
0
) that the assignment A
i
determines essentially all
(a-times) of the experimental cross-peak volume V
0
can be calcu-
lated. An assignment A
k
with a probability P(A
k
, a|V
0
) higher than,
for example, 0.95 is transiently considered as unambiguously
assigned. Note that usually not all of the signals are unambigu-
ously assigned in the first round. With the list of unambiguously
assigned peaks, a set of structures is calculated. These structures
are used as input for the next cycle of iteration where a distance
threshold D
max
is dynamically reduced. Starting with a trial
structure (e.g., an extended strand), all assignments of a cross
108 Gronwald and Kalbitzer
peak possible within the dimension specific chemical shift limits
are considered where the corresponding atoms are separated in
the trial structure by a distance r
ij
< D
max
. The aim of the distance
threshold D
max
is to reduce the number of assignment possibilities
for the individual cross peaks, which in turn leads to a higher
number of signals that could be unambiguously assigned. Again
assignment probabilities are calculated, and a new round of
structure calculations is performed. This procedure is iterated until
D
max
reaches its lower limit. The lower limit of D
max
is usually set
to 0.75 nm, in general, the maximum detection range of a NOESY
spectrum plus a margin to allow for only partially fixed side-chain
positions. Note that in each iteration the original unassigned peak
list is used, and all previous assignments are discarded. This is
done to ensure that the structure determination process does not
get trapped in preliminary conformations.
In addition, KNOWNOE considers mutual information
in a similar way as introduced by Herrmann et al. (2002) (58).
That means putative NOE assignments that are supported by a
network of neighboring assignments are treated as more probable
than assignments that are isolated. Within KNOWNOE, the use
of mutual information also termed network-anchoring is espe-
cially important during the first few cycles of NOE assignments
and structure calculations. When no additional 3D structural
information is available as it is often the case in the beginning of
the structure determination process usually many NOE signals
possess a high number of possible assignments within the ranges
of the sequential chemical shift assignment. Using mutual infor-
mation a prescreening step is performed for each ambiguous
assignment and only assignment possibilities that are supported by
a network of neighboring assignments are passed to the next step
of KNOWNOE. Only from these preselected assignment possi-
bilities the most probable assignment is calculated as described
above. Compared with the original KNOWNOE method (59),
this combination of methods usually allows for a considerably
higher number of reliably assigned NOEs.
In the following, we will give an example for the iterative
structure determination of the Ras-binding domain of RalGDS a
small protein of 88 residues in size (60, 61). As input, the reso-
nance line assignment for the main- and side-chain atoms was used
together with a 2D
1
H and a 3D
15
N edited NOESY spectrum.
In total, six iterations of assignments and structure calculations
were performed, of which the first two and the last are shown
below (also see Notes 20 and 21).
See Fig. 3 and Table 1.
See Fig. 4 and Table 2.
3.7.1 Iteration 1
3.7.2 Iteration 2
109
Automated Protein NMR Structure Determination in Solution
Table 1
Iteration 1: Parameters used within AUREMOL/KNOWNOE (see Notes 22 and 23)
Parameter Value Description
Mixing time 2D 0.08 s NOESY mixing time
Relaxation delay 1.56 s D1 plus acquisition time
Used structure Extended
strand
Determines used 3D structure
Assign limit F1 (2D) 0.02 ppm Allowed divergence between assignment and
actual spectrum
Assign limit F2 (2D) 0.02 ppm Allowed divergence between assignment and
actual spectrum
Lower probability limit 0.95 Minimal accepted assignment probability
Distance limit 100 nm Allowed atom separation for possible assignments
in current structure
Mutual information
prob limit
0.2 Minimal accepted mutual information probability
Use mutual information Yes Switches use of mutual information on/off
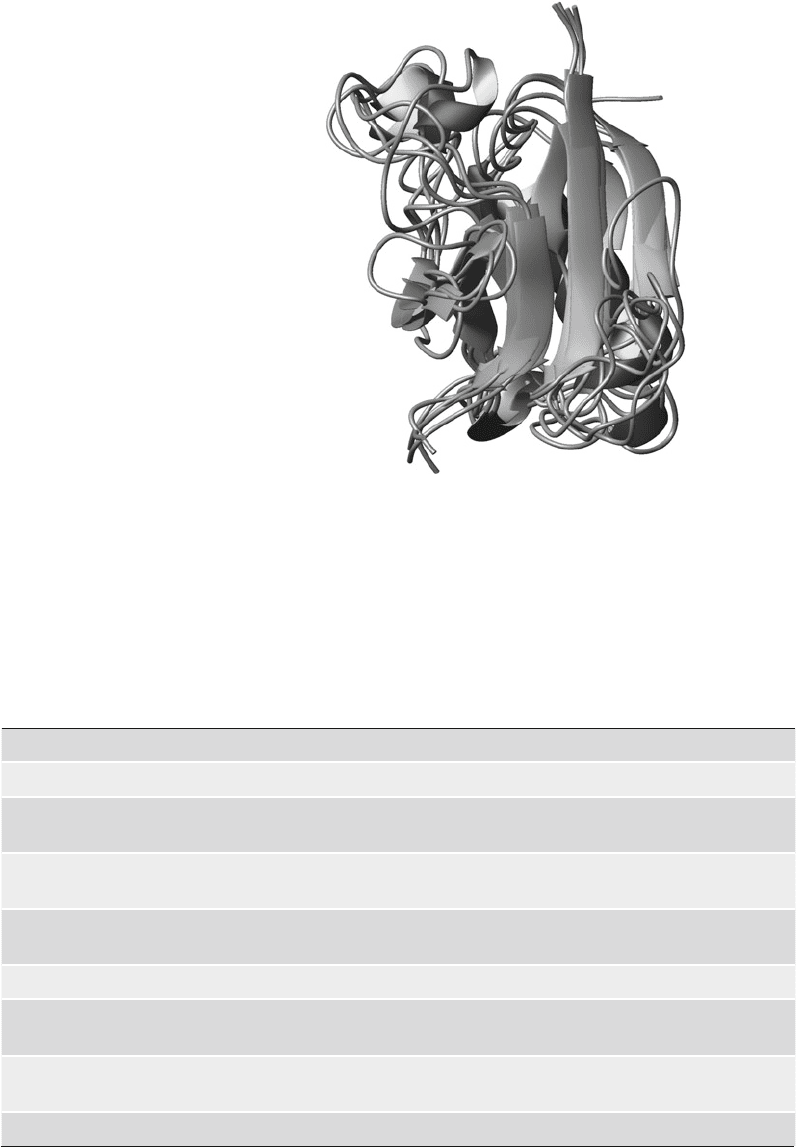
Fig. 3. Bundle of five selected structures of RalGDS after iteration 1.
(continued)