Feny? D. (Ed.) Computational Biology
Подождите немного. Документ загружается.

263
Reverse Engineering Gene Regulatory Networks
The structure
H
of a Bayesian network is defined by a directed
acyclic graph (DAG) indicating how different variables of interest,
represented by nodes and connected by directed edges, “interact.”
The edges of a Bayesian network are associated with conditional
probabilities, defined by a functional family and their parameters.
The interacting entities are associated with random variables,
which represent some measured quantities of interest, like relative
gene expression levels or protein concentrations. We are interested
in learning a network of causal relations between interacting nodes.
While such a causal network forms a valid Bayesian network, the
inverse relation does not always hold: when we have learned a
Bayesian network from the data, the resulting graph does not nec-
essarily represent the correct causal graph. One reason for this dis-
crepancy is the existence of unobserved nodes. When we find a
probabilistic dependence between two nodes, we cannot necessar-
ily conclude that there exists a causal interaction between them, as
this dependence could have been brought about by a common yet
unobserved regulator. Even under the assumption of complete
observation the inference of causal interaction networks is impeded
by symmetries within so-called equivalence classes, which consist
of networks that define the same conditional independence rela-
tions. As such, each Bayesian network represents a whole equiva-
lence class, represented by a complete partially directed acyclic
graph (CPDAG). Under the assumption of complete observation,
directed edges in a CPDAG can be taken as indications of putative
causal interactions.
We denote the set of all measurements of all random variables
as the data, represented by the letter D. As a consequence of the
acyclicity of the network structure, the joint probability of all the
random variables can be factorized into a product of lower-com-
plexity conditional probabilities according to conditional inde-
pendence relations defined by the graph structure
H
. Under
certain regularity conditions, the parameters associated with these
conditional probabilities can be integrated out analytically. This
allows us to compute the marginal likelihood
H(|)P D
, which
captures how well the network structure
H
explains the data D.
In the present study, we compute
H(|)P D
under the assumption
of a linear Gaussian distribution. The resulting score was derived
by Geiger and Heckerman (26) and is referred to as the BGe score.
The objective of inference is to find the DAG (or CPDAG)
that is most supported by the data. Mathematically, this is the
mode of the posterior distribution
∝H HH( | ) ( | ) ( ),P PPDD
(11)
where
()P H
is the prior distribution over network structures,
which represents the biological knowledge that we might have
prior to measuring the data D. Since the number of structures
H
increases super-exponentially with the number of nodes, an
264 Lin et al.
exhaustive search for the mode of
H(|)P D
is usually intractable,
and some greedy search procedure based on hill climbing is usu-
ally pursued: the network structure is locally modified, and the
modification is accepted if the score
H(|)P D
increases. This pro-
cedure is iterated until some convergence criterion is satisfied.
Note that in systems biology, where we aim to learn complex
interaction patterns involving many components, the amount of
information from the data and the prior is usually not sufficient to
render the distribution
H(|)P D
sharply peaked at a single graph.
Instead, the distribution is usually diffusely spread over a larger
set of networks. Summarizing this distribution by a single network
is therefore usually not appropriate. A more sophisticated procedure
is to sample network structures
H
from the posterior distribution
H(|)P D
with MCMC, as pursued, e.g., (27–29). As a heuristic
simplification of this approach, a hill climbing optimization
scheme can be run repeatedly on bootstrap replicated data, as
pursued in Friedman et al. (21), and carried out in the present
work; see Subheading 4 for further details.
Many approaches towards reverse engineering gene regulatory
networks are based on analyzing expression levels of the regula-
tors and comparing them to those of the genes they regulate.
This is a reasonable method if there is reason to believe that highly
expressed regulators have more influence on the genes they regu-
late. However, this may not always be the case. For example, some
regulatory genes may be posttranscriptionally modified, with the
consequence that the amount of mRNA present in the cell is not
a good indicator of the corresponding protein activity.
Nested effects models (NEMs) (30) are one approach to dealing
with this problem. Rather than looking at the expression levels of
regulating genes (called S-genes for signalling genes), NEMs look
at the effect that knocking out each of these genes has on the
3.5. Nested Effects
Models
3.5.1 Model Overview
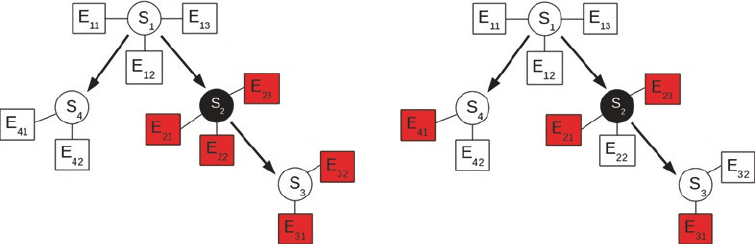
Fig. 3. Illustration of nested effects models (NEMs). Circles represent S-genes, boxes represent E-genes. Left panel: The
black circle represents an S-gene that has been knocked out. The shaded boxes represent E-genes where significant
effects are expected. Right panel: Due to noise in the data, some true effects are missed (here: E
22
and E
32
), and some
spurious effects are observed (here: E
41
).

265
Reverse Engineering Gene Regulatory Networks
expression levels of the genes that they regulate (called E-genes for
effect reporting genes). Based on these effects, it is possible to
determine the structure of the signalling pathway that the S-genes
are a part of. For example, if gene S
1
regulates E
1
and S
2
regulates
E
2
, and additionally S
2
is downstream from S
1
, then we would
expect to see an effect on E
1
and E
2
if we knock out S
1
, but only
an effect on E
2
if we knock out S
2
. Note that for real world appli-
cations, the situation is more difficult than described in this simple
example. This is because gene regulation is a stochastic process
and measurements are susceptible to noise. An illustration is given
in Fig. 3.
To complete the specification of an NEM, we need two sets
of parameters: A network hypothesis
H
, which describes the rela-
tions between the S-genes, and a model Q for the regulation of
the E-genes, where q
i
= j if E-gene i is regulated by S-gene j. We
assume that an E-gene can only be regulated by one S-gene and
use model averaging to account for all possibilities. Using Bayes’
theorem, the score for a network hypothesis given data D is:
=
HH
H
( | )()
(|) .
()
PP
P
P
D
D
D
(12)
If we assume that the observations of each E-gene, the parameters
q
i
and the knockout experiments are independent, then the likeli-
hood P
H(|)D
for a data set consisting of m E-genes and n
S-genes decomposes as:
==
=
θ= θ=
∏∑∏
H HH
11
1
( | ) = ( | , ) ( | ),
n
mn
ik i i
ik
j
P P jP jD D
(13)
where P
θ =H( |, )
ik i
jD
is the likelihood of the effect observed at
E-gene i when knocking out S-gene k and P
( |)
i
jθ = H
is the
prior probability of E-gene i being regulated by S-gene j. Note
that we usually do not know which E-genes are controlled by
which S-genes. For this reason, Eq. (13) includes a marginaliza-
tion over all possible assignments of E-genes to S-genes. More
details can be found in refs. (30, 31).
In order to find the likelihood of observing an effect at E-gene i
when knocking out S-gene k, Markowetz et al. (30, 32) first used
a discretization scheme based on thresholding to transform the
continuous expression values of the E-genes into binary indica-
tors. Then they calculated the likelihood based on the expected
false-positive and false-negative rates. This approach incurs an
inevitable loss of information, and also requires both positive and
negative controls to estimate the error rates, which may not always
be available. Fröhlich et al. (31) developed an alternative method
which uses p- values that correspond to the likelihood of an E-gene
3.5.2. Modelling
the Effects

266 Lin et al.
i being differentially expressed when S-gene k is knocked out.
They obtain the raw p- value using LIMMA (3), as described in
Subheading 2.4, and fit a three-component Beta-uniform mix-
ture (BUM) model to those values. The BUM model consists of
a uniform distribution (reflecting the null hypothesis) and two
Beta distributions such that:
=π +π α +π β
12 3
( ) ( , ,1) ( ,1, )
ik k k ik k k ik k
P D Beta D Beta D
(14)
where D
ik
is the p-value of E
i
at knockout S
k
, the p
*k
are the mixing
coefficients and we have the constraints that a
k
< 1 and b
k
> 2. If
( 1)
ik
PDπ ==
is the maximum uniform part of the model, then we
have:
π
θ
π
−
=
−
H
H
ˆ
()
if predicts an effect
ˆ
( | ,)
1
1
.
otherwise
ik
ik i
PD
PD
(15)
A typical microarray experiment can measure the expression levels
of thousands of genes, not all of which will be affected by the
knockout of an S-gene. For that reason, it makes sense to apply an
a priori filtering step to remove E-genes that only show random
effects. Fröhlich et al. (31) use a scheme that finds patterns of dif-
ferentially expressed genes that are statistically significant. Given
the multiple-testing corrected p-value p
k
of an E-gene expression
level in experiment k, and a false-positive rate a, we can set:
<
=
α1 if
0 otherwise
.
k
k
p
b
(16)
If s
k
is the number of significant genes in experiment k, then the
probability of observing a pattern b = (b
1
, …, b
n
) under the null
hypothesis H
0
is:
=
−
= α + − −α
∏
0
1
( | ) (1 )(1 ) ,
n
kk
kk
k
s Ms
PH b b
MM
b
(17)
where M is the total number of E-genes. This allows us to calcu-
late the number of times that we should expect to see b by chance.
Using a binomial test, we can calculate the statistical significance
of seeing b more often than expected, and keep only those effects
which show a significant pattern.
We now know how to calculate the likelihood for a given network
hypothesis. Unfortunately, unless the number of S-genes is very
small, it is impractical to score all possible network structures. To
circumvent this problem, Markowetz et al. (32) developed a method
based on scoring networks consisting of triples and combining
3.5.3. A Priori Filtering
of Effects
3.5.4. Network Inference
Methods
267
Reverse Engineering Gene Regulatory Networks
them. Two alternative methods are greedy hill climbing (33) and a
module approach based on hierarchical clustering (31).
In the triples approach, we consider all possible triples of
S-genes and score the networks that can be formed using only
three nodes. Then we select the highest-scoring network for each
triple and use model averaging to combine them into a complete
network. We calculate the frequency of each edge and include all
the edges whose frequency exceeds a certain threshold.
Greedy hill climbing is a more basic approach where we start
from a network (usually with no edges) and at each step add the
edge that gives the biggest improvement to the score. If no more
improvements are possible, the algorithm terminates. This only
gives us a local optimum, so it is usually advisable to use boot-
strapping (repeat the greedy hill climbing algorithm several times,
each time sampling with replacement from the E-genes) to get a
measure of the confidence we have in each edge.
The module networks method starts out by creating a hierar-
chical clustering of the gene expression profiles using a standard
clustering method (Frohlich et al. (33) suggest average linkage).
Then, starting from the top, we look for clusters containing at
most four S-genes. When the network has been decomposed into
non-overlapping clusters (or modules) of at most four S-genes,
we find the highest-scoring network for each cluster using an
exhaustive search. Finally, the modules are connected using a
constrained greedy hill climbing approach, which only adds edges
between S-genes in different modules.
A feature that NEMs have in common with Bayesian net-
works is the existence of equivalence classes. Two pathway hypoth-
eses
1
and
2
have the same likelihood, P(D|
1
) = P(D|
2
) if
they only differ in transitive edges. Consider three S-genes A, B,
and C. If A is upstream of B, and B is upstream of C in the regula-
tory hierarchy, then silencing A will affect C. The structure of the
model and the scoring scheme do not allow distinguishing between
a direct interaction A → C, an indirect interaction A → B → C,
or the existence of both regulatory paths. Assuming parsimony,
we can select among all score-equivalent graphs the one with the
minimum number of edges. This technique is called transitive
reduction and was adopted in our study.
This section contains notes on how we applied the methods
described in the previous section in practice. Table 1 includes an
overview of the software packages used, with their web addresses
from which they can be downloaded. Networks are obtained with
these programs as follows.
4. Notes

268 Lin et al.
BNlearn (for BNets) learns a network using a greedy learning
algorithm (the growth-shrink algorithm) proposed by Margaritis
(34). To estimate the confidence in the edges, we follow Friedman
et al. (21) and apply a bootstrap procedure. To this end, the opti-
mization is repeated on 100 bootstrap replicas, from which boot-
strap support values are computed as the relative frequency of
occurrence of the edges. These bootstrap support values provide an
indication of the confidence we have in the edges. They also allow
us to obtain sparser network structures by only keeping those edges
whose bootstrap support values exceed a specified threshold.
SparseBayes (for SBR) predicts a network that results from a
greedy optimization procedure where, starting from an empty
graph, parent nodes are added and removed for each node until
the Bayesian score can no longer be improved. Again, confidence
scores for the edges are obtained via bootstrapping, in the same
way as obtained for BNets.
GeneNet (for GGMs) computes p- values for both non-zero
edges and edge directions. From these p- values, a network can be
predicted when a target false-discovery rate (FDR) is specified. In
our application, we used the default threshold provided by the soft-
ware. In principle, networks at different connectivity densities can
be obtained by varying the FDR threshold. Alternatively, one can
keep the threshold fixed and obtain support values for the edges via
a bootstrap analysis, as described above. We found that both proce-
dures lead to similar results. The bootstrap approach is computa-
tionally more expensive, but avoids the assumption of an asymptotic
functional form for the distribution under the null hypothesis, on
which the computation of the p- values in GeneNet is based.
Given a fixed value for the regularization parameter, Lars (for
LASSO) predicts a network using a greedy optimization scheme.
The program automatically optimizes the regularization hyperpa-
rameter via tenfold cross-validation. Networks with different con-
nectivity densities can be obtained by varying the threshold. As an
alternative, we use a 100-fold bootstrapping procedure, where for
each bootstrap replica the hyperparameter is inferred on the basis
of the same tenfold cross-validation procedure.
Owing to the absence of a gold-standard network for the real data,
we evaluated the performance of the methods on simulated data.
We first compare the performance of the four methods for
complete data: GGM, BNet, LASSO, and SBR. We would also
like to compare their individual performance with that of the con-
sensus network obtained from model averaging. In machine
learning, it is well known that model averaging leads to an
5. Simulations
269
Reverse Engineering Gene Regulatory Networks
improvement of the generalization performance of a predictor or
classifier. The performance of the combined model is better than
the average performance of the individual model: see e.g. Chapter
9 in Bishop (35). We would like to test whether model averaging
also results in an improved network reconstruction. We take as
the gold-standard network the graph shown in the top left panel
of Fig. 11, and generate data in the following way. For the root
node (expM), we sample a new value Y from a normal distribution:
σ
2
~ (0,Y ),
a
N
(18)
with s
a
= 1.0. For a node with parent set {p}, new values are
sampled from a Gaussian distribution whose mean is given by the
average over the parent set:
ππ π
π
ξσ ξ
σσ
=
==
+
∑
2
22
1
1
~ ( , ); ; ,
K
a
ab
K
YN X X X
K
(19)
where X
p
is the value of the pth parent node, and K is the cardi-
nality of the parent set. The factor x is chosen to yield a constant
average signal-to-noise ratio of
σσ
22
/
ab
across all nodes in the net-
work. We chose three signal-to-noise ratios:
=
2
0.1, 0.2
b
σ
, and 0.5.
We generated data sets with N = 30 instances, which is about the
same number as available for the real data. For each value of
2
b
σ
, we
inferred networks from the data by applying the programs listed in
Table 1. We repeated this process on 100 independent data instan-
tiations and computed, for each method and each edge, the mar-
ginal probability of the edge occurring. We also averaged the
probabilities over the individual methods; this gives the marginal
probability of an edge obtained from model averaging. Imposing a
threshold on these probabilities, we can determine the number of
true-positive (TP), false-positive (FP), true-negative (TN), and
false-negative (FN) edges by comparison with the gold-standard
network. We then compute the sensitivity = TP/(TP + FN), the
specificity = TN/(TN + FP), and the complementary specificity =
1 − specificity = FP/(TN + FP). Rather than selecting an arbitrary
value for the threshold, we repeat this scoring procedure for all pos-
sible threshold in the interval (0,1), and plot the ensuing sensitivity
scores against the corresponding complementary specificity scores.
This gives the receiver operating characteristics (ROC) curves of
Fig. 4, where a larger area under the curve (AUC) indicates, overall,
a better performance of the method. We found that the AUC score
obtained with model averaging was slightly but consistently larger
than the average AUC score, in corroboration of our conjecture.
In order to assess the reliability of the NEM results, we
decided to perform a simulation study similar to the one described
in Fröhlich et al. (31). However, rather than sample network
structures, we restricted ourselves to one of the networks inferred
270 Lin et al.
from the real knockout data. We chose, rather arbitrarily, the
graph in the top left panel of Fig. 11. This has the advantage that
we evaluate the NEM performance on a network that is semireal-
istic, rather than the transitively closed ideal networks of Fröhlich
et al. (31). Like Fröhlich et al. (31), we sample p values for each
knockout from the mixture distribution in Eq. (14). Each S-gene
is linked to 100 E-genes. The p-values for E-genes where we do
not expect an effect due to the network structure are sampled
from the uniform distribution. There is a slight subtlety in when
to expect an effect if there are different paths between two S-genes
(e.g. between expM and aepA in the network we use here). If one
path is disabled by a network, do we expect to see an effect down-
stream (AND model) or will the signal travel via the alternative
path (OR model). We chose to adopt the AND model, which
corresponds, e.g. to heterodimerization. For each S-gene where
one would expect an effect, we calculate the probability of observ-
ing that effect, based on the distance of the current S-gene to the
knockout gene. The observed effects are sampled from the beta
distributions according to the mixing coefficients p
1k
and p
2k
,
while for unobserved effects we sample from the uniform distri-
bution. For each knockout, all parameters are drawn from the
same ranges as in Fröhlich et al. (31), and for each E-gene a small
amount of Gaussian noise is added to these parameters.
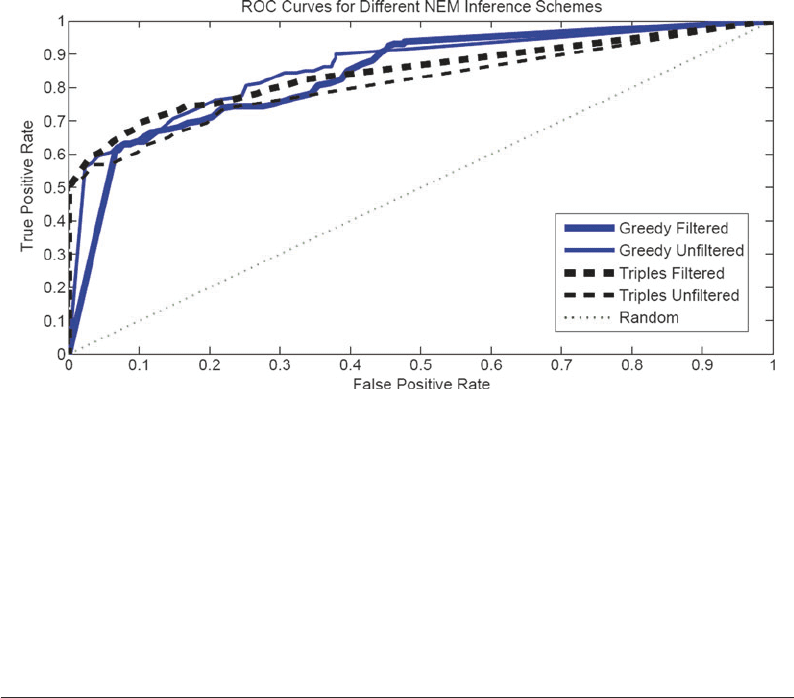
The results are shown in Fig. 5. There is no significant differ-
ence between the two optimization schemes: triples versus greedy
search, whereas the filtering versus unfiltering scheme shows a sig-
nificant difference (at the 0.05 significance level). Surprisingly, the
effect of filtering is not consistent, though, leading to an improvement
Var=0.5 Var=0.2 Var=0.1
SBR(0.94)
BNets(0.91)
GGM(0.91)
Lasso(0.81)
CON(0.90)
SBR(0.96)
BNets(0.93)
GGM(0.92)
Lasso(0.85)
CON(0.93)
SBR(0.95)
BNets(0.94)
GGM(0.93)
Lasso(0.93)
CON(0.94)
1
0.9
0.8
0.7
0.6
0.5
True positive rate
0.4
0.3
0.2
0.1
0
0 0.2 0.4 0.6
False positive rate
0.8 100.2 0.4 0.6
False positive rate
0.8 100.2 0.4 0.6
False positive rate
0.8 1
1
0.9
0.8
0.7
0.6
0.5
True positive rate
0.4
0.3
0.2
0.1
0
1
0.9
0.8
0.7
0.6
0.5
True positive rate
0.4
0.3
0.2
0.1
0
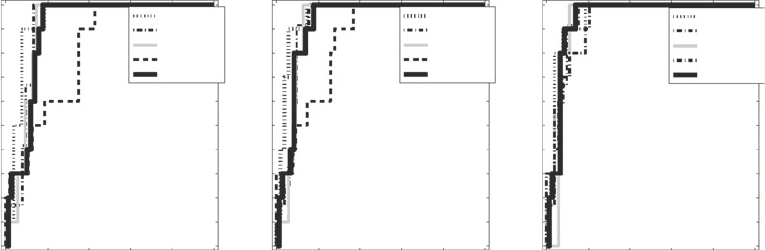
Fig. 4 ROC curves obtained on the synthetic data for GGMs, BNets, LASSO, SBR, and the consensus network. For each
graph, the proportion of true-positive edges (vertical axis) is plotted against the proportion of false-positive edges (hori-
zontal axis). The three panels refer to different noise levels. The areas under the ROC curves (AUC) obtained for the differ-
ent methods are shown in the legends. Note that the AUC scores obtained with model averaging were found to be slightly
but consistently larger than the average AUC scores. Left panel
2
( 0.5)
b
σ =
: 0.90 versus 0.89; centre panel
2
( 0.2)
b
σ =
: 0.93
versus 0.915; right panel
2
( 0.1)
b
σ =
: 0.94 versus 0.9375.
271
Reverse Engineering Gene Regulatory Networks
in the performance of the triple method, but a deterioration in the
performance of the greedy search. Given these inconsistencies, we
decided to apply all four methods to the real data.
In order to assess the networks inferred with the different meth-
ods, we use a three-prong approach. First, we compute global
network properties based on the degree distribution and check if
they are consistent with typical patterns found in gene regulatory
networks. Second, we assess how consistent the different predic-
tions are, based on a bootstrap analysis and ROC (receiver oper-
ating characteristics) curves. Finally, we investigate the biological
plausibility of the inferred network structures. Owing to our lim-
ited knowledge of regulatory networks and signalling pathways in
Pba, the last approach is only partially feasible for the key regula-
tory genes targeted in the knockout experiments, as listed in
Subheading 2.1. We have therefore only applied it to the graphs
inferred with NEMs.
A comparison of topological features in networks has revealed
certain common characteristics among gene regulatory networks.
In particular, these networks tend to be scale free, as discussed for
instance in Guelzim et al. (36). This means that gene regulatory
6. Results
6.1. Global Network
Properties and Degree
Distribution
Fig. 5. ROC curves obtained for different training schemes of the NEMs. Two training methods (triples versus greedy
search) were combined with two data filtering schemes; see Subheadings 3.5.3 and 3.5.4 for details. The different line
types refer to the four different combinations. The areas under the ROC curves are as follows: Greedy filtered (solid thick
line): 0.84 ± 0.04. Greedy unfiltered (solid thin line): 0.86 ± 0.04. Triples filtered (dashed thick line): 0.84 ± 0.05. Triples
unfiltered (dashed thin line): 0.81 ± 0.04. The graphs and estimates were obtained from ten independent data
instantiations.
272 Lin et al.
networks tend to be characterized by a power law, where the
number of nodes with a certain degree k is a power of that degree:
N(k) ak
a
. The degree of a node k is the number of connections it
has. The polynomial dependence of N(k) on k implies a linear
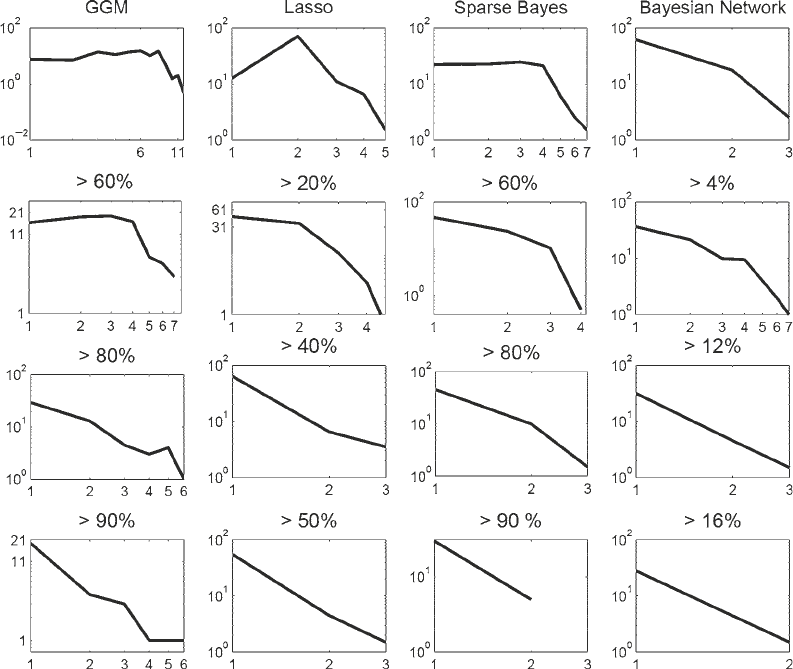
dependence in a double-logarithmic representation. Figure 6
suggests that none of the networks inferred from the original
gene expression profiles with the programs listed in Table 1 satisfies
this dependence. This means that none of the inferred networks
exhibits a global structure that is consistent with what is expected
to be found in gene regulatory networks. We suspect that this
deviation is a consequence of the prediction of several spurious
edges. To proceed, we carried out the bootstrap analysis described
Fig. 6. Double logarithmic plot of the number of nodes N(k) with a given degree k for networks inferred with different
methods. Left column : Graphical Gaussian models (GGMs). Centre left column : LASSO. Centre right column : Sparse
Bayesian regression (SBR). Right column : Bayesian networks (BNets). The top row shows the degree distributions for
networks obtained as outputs of the programs shown in Table 1. The remaining rows show the degree distributions for
sparser networks obtained from a bootstrap analysis, as described in Subheading 4. Percentage scores over the graphs
indicate the thresholds on the bootstrap support values. For each panel, the x-axis represents the degree of a node, N ( k),
and the y-axis represents the number of nodes with a specified degree, k. Both axes are on a logarithmic scale. Hence,
a non-trivial straight line is indicative of a power law distribution.