Floud R., Johnson P. The Cambridge Economic History of Modern Britain, Volume 1: Industrialisation, 1700-1860
Подождите немного. Документ загружается.


Education and skill of the British labour force 341
theabsence of any centrally administered or financed schooling network,
one can surmise that by 1700 a substantial minority of English children
would have spent at least some time in school. The 1851 Census of Edu-
cation indicates that, by that date, 60 per cent of boys and 56 per cent of
girls aged 5 to 9 were scholars. Relatively sluggish growth of literacy and
schools in the century and a half prior to this would suggest that the
level of school attendance in the early eighteenth century would have
been between perhaps 20 and 40 per cent of this age group. Therefore,
attending school in early eighteenth-century England was not an uncom-
mon experience, even for many working-class children (Jones 1938; Hans
1951;Simon 1968; Lawson and Silver 1973; O’Day 1982; Mitch 1993). For
this period it is estimated that between 40 and 50 per cent of adults
could sign their name (Cressy 1980). Although basic reading and writing
skills were often acquired outside of formal schooling during this period,
these figures would suggest widespread familiarity with what was done in
school. Schools were quite heterogeneous in their financing and in their
educational aims (Lawson and Silver 1973; O’Day 1982). The majority of
students were probably in private-venture schools, i.e. single-teacher oper-
ations (commonly neighbourhood women or dames or elderly men lack-
ing alternative employment) run for profit. The curriculum would have
focused on basic literacy and whatever other odd subjects the teacher
wanted to throw in. Schools with religious affiliation and support were
widespread as well, though religious motives behind the propagation of
education did not attain the same level of intensity as in other Protes-
tant regions such as Sweden and Germany (Houston 1988b: 40–8). Philan-
thropists also supported schools without any formal religious affiliation
(Lawson and Silver 1973: 181–2).
Achild reaching adolescence around 1700 would have been relatively
unlikely to attend school, given the rise in his or her opportunity costs
(foregone earnings) with maturation. Traditional grammar schools, to-
gether with academies run by and for religious dissenters, did pro-
vide some secondary instruction (O’Day 1982: ch. 11). The Universities
of Oxford and Cambridge offered higher education, and institutions
for morespecialised professional training such as the Inns of Court
were present in London. Such post-primary education would have been
pursued by well under 5 per cent of the relevant age group in early
eighteenth-century England. Many children would have made their sub-
sequent way in life through the school of hard knocks: finding employ-
ment as adolescents in order to take advantage of their maturing earning
power or, in the case of females, helping out at home (Ben-Amos 1994).
Because of its shorter length and the younger age when it would have
occurred, with consequent lower opportunity cost, the typical personal
investment in formal schooling would have cost considerably less than
thetypical apprenticeship. For example, three years of schooling between
theagesof8and 10, perhaps roughly sufficient to acquire basic literacy,
Cambridge Histories Online © Cambridge University Press, 2008

342 David Mitch
can be costed as having direct fees of 6 pence per week and opportu-
nity costs per week usually exceeding no more than 2 shillings. At forty
weeks of attendance per year, this implies a total cost per person of £15.
Assume that 40 per cent of an estimated 100,000 English 10-year-olds in
1700 had been in school for three years and that the average working
life for those reaching the age of 10 was a further thirty-five years.
6
This
yields a further cumulative human capital stock in literacy and related
primary schooling for males and females of £21 million, about half of
theestimated cumulative investment in male apprenticeship of £52 mil-
lion. This combined human capital stock in both literacy and primary
schooling for males and females and in apprenticeship for males in 1700
of £73 million is still well under half of Allen’s (1994) estimates of the
capital stock in agriculture in 1700 of £183 million.
The benefits from apprenticeship, in terms of a stream of enhanced
earnings once qualified, were potentially large. This is suggested by
Gregory King’s assignment of an annual income per family of £40 for
those in artisan and handicraft occupations compared with £15 for
labouring people and outservants (Mathias 1979: 186–7). However, the
percentage rate of return for schooling may have been higher, relative to
its markedly lower opportunity and total costs.
Apprenticeship and formal schooling were by no means incompatible.
Indeed in a range of contexts, pursuit of apprenticeship was based on
an earlier foundation of formal schooling. This would have occurred in
professions such as law and medicine, in which some instruction in basic
languages and other disciplines would generally be expected before en-
tering the apprenticeship upon which professional training in the early
eighteenth century was generally based. One important activity, for which
formal schooling was the foundation for apprenticeship and related on-
the-job experience, was that of the merchant. Pollard (1965) has suggested
affinities between the education and training of the merchant and that of
subsequent industrialists in the early industrial revolution. The merchant
commonly mastered both general skills such as basic literacy and more
specific skills suitable for commerce such as accounting and mastery of
certain modern languages used in trade. Malachy Postlethwayt (1774) pro-
posed in the mid-eighteenth century that a formal commercial academy
be set up for this purpose. Although nothing came of this proposal,
dissenting academies set up a similar curriculum (O’Day 1982: 208–15,
270).
7
Aspiring merchants commonly started as agents in distant loca-
tions as preparation for acquiring more senior status in merchant houses
6
The thirty-five-year expected service life figure for a 10-year-old comes from the admittedly
quite crude adjustment of simply adding ten years to the previous rough estimate of a
twenty-five-year service life for a 21-year-old.
7
Alecture given by Leone Levi (1868) in 1868 indicates that at that time, King’s College,
London was offering classes in physical geography, commerce and commercial law aimed
at the aspiring merchant. However, Levi’s remarks also suggest that few students were
actually taking these classes.
Cambridge Histories Online © Cambridge University Press, 2008

Education and skill of the British labour force 343
(Ben-Amos 1994: 124–7). Given the creative nature of entrepreneurial ac-
tivity, it is not clear that training for entrepreneurship can be provided in
asystematic way. It was probably at least as critical in guaranteeing a sup-
ply of entrepreneurs that relatively few barriers and disincentives were
created for those wishing to pursue their entrepreneurial proclivities.
TRENDS IN HUMAN CAPITAL
ACCUMULATION, 1700–1860
The century and a half that is surveyed in this volume is commonly seen
as a period of profound change and transformation in the English econ-
omy. One might expect corresponding evidence of fundamental change in
theeducation of the English labour force. Yet educational histories of this
period tend to suggest a pattern more of stagnation than of improvement.
However, evidence on schooling and other forms of investment in human
capital during this period is fragmentary. This sets the tasks of examin-
ing the evidence for educational stagnation and how the relationship
between educational trends and economic change can be understood.
Literacy rates as measured by signature rates at marriage provide the
most easily quantifiable indicator of trends in education between 1700
and 1860. Signature rates are not without difficulty as measures of read-
ing and writing ability, but nevertheless long-term trends in signature
ratesare likely to reflect trends in the latter (Schofield 1973; Houston
1988b; Reay 1991). Cressy (1980: 176), having examined a range of sources
such as legal documents which indicate signature rates, has suggested
that, at the accession of George I in 1714, approximately 45 per cent of
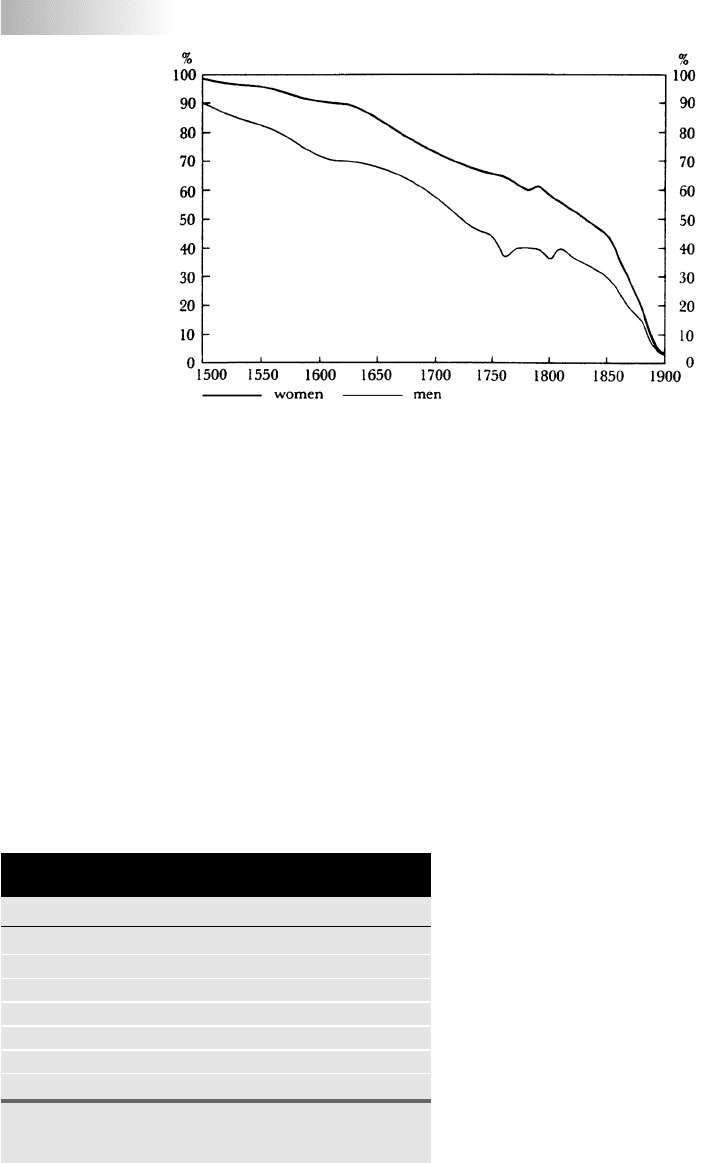
men and 25 per cent of women could sign their names (see Figure 12.1).
Cressy’s assessment is that this reflects continuous improvement since
1500, at which date perhaps at best 10 per cent of men, and an even
smaller per centage of women, could sign their names. By this point, as
Table 12.2 shows, other countries already had an educational lead over
England. North America and Sweden stand out in this regard (Graff 1987:
ch. 6). It is also commonly believed that Scotland had higher literacy rates
than England, though recent research has qualified this view (Houston
1985). England seems to have been in a similar position to France, and
wasperhaps behind Germany and Holland, but almost surely ahead of
areas in southern and eastern Europe such as Spain, Italy and Russia
(Graff 1987: ch. 6). As already suggested, while literacy was not acquired
exclusively in schools, these literacy figures probably in some degree re-
flected the widespread network of primary schools which were present
throughout England at this time.
Asimilar intermediate position in higher levels of educational at-
tainment characterises the international standing of England’s universi-
ties and scientific establishment in 1700 (Stone 1974; O’Day 1982: 273–5;
Cambridge Histories Online © Cambridge University Press, 2008
Edited by Foxit Reader
Copyright(C) by Foxit Software Company,2005-2008
For Evaluation Only.
344 David Mitch
Figure 12.1
Estimated illiteracy of
men and women in
England, 1500–1900
Source: Cressy 1980:
177.
Houston 1988b: ch. 4; Inkster 1991). Scotland and the Netherlands had far
more vibrant activity than England in such fields as law and medicine.
But despite recurrent disdainful comments about Oxford and Cambridge,
these universities did have some scholars making respectable if not
exceptionally brilliant intellectual contributions.
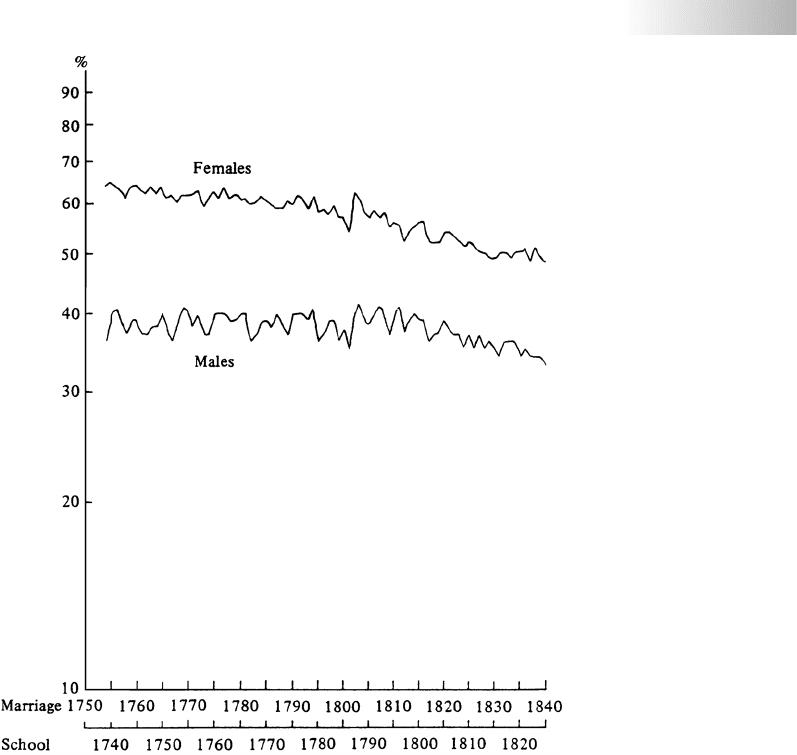
Schofield (1973) has made national-level estimates of trends in signa-
ture rates for brides and grooms at marriage for England between 1750
and 1840 (see Figure 12.2). Some improvement in ability of brides to sign
their name isevident, with the proportion rising from about a third in
the1750s to about half in the 1830s. However, for grooms, any rise was
more modest, increasing from perhaps 60 to 70 per cent over this pe-
riod. Moreover, regional studies focusing on Lancashire, a focal point of
thegrowth of cotton textile manufacture, have found deteriorating sig-
nature rates during industrialisation (Sanderson 1972a). This assessment
has been subject to some debate. Laqueur (1974) has argued that literacy
Table 12.2 Literacy for selected areas in Europe and North
America c. 1700
Region Male literacy rate Female literacy rate
England 40% 25%
France 29% 14%
Amsterdam 70% 44%
Moklinta, Sweden 89% 89%
(reading ability)
Iceland Almost 50% Almost 50%
New England 70%
Note: Literacy rates for England, France and Amsterdam based on signature
rates at marriage.
Sources: Cressy 1980; Graff 1987.
rateswere actually rising modestly in
industrialising Lancashire. And Nicholas
and Nicholas (1992) have constructed na-
tional literacy estimates by occupational
grouping, indicating that rates were ac-
tually rising during a first phase of
industrialisation through the late eigh-
teenth century, followed by a decline
which they interpret as reflecting a
deskilling phase of industrialisation.
More generally, considerable variation in
local and regional literacy trends has
been noted (Schofield 1973; Stephens
1987). Nevertheless, the preponderance
Cambridge Histories Online © Cambridge University Press, 2008
Education and skill of the British labour force 345
Figure 12.2
Estimated annual
percentage of males
and females unable to
sign at marriage,
1754–1840 (from a
random sample of 274
English parish
registers)
Source: Schofield
1973: 445.
of evidence suggests little overall upward trend in literacy rates before
the second quarter of the nineteenth century.
Evidence on corresponding schooling trends is much more patchy.
In considering likely developments, it is useful to distinguish between
theprivate-venture, for-profit schooling market and schools that were fi-
nanced at least in part by subsidies. There is no reason to think there were
any major changes between 1700 and 1850 in the private-venture school-
ing market. It is likely to have expanded and contracted with working-
class demand. There would seem to have been a ready and elastic supply
of those willing to sell instructional services at prevailing market rates
(Gardner 1984). There is little reason to think there was an expansion
in working-class demand during the industrial revolution period, in so
farasneither living standards nor labour market demands for schooled
workers were increasing.
Cambridge Histories Online © Cambridge University Press, 2008

346 David Mitch
Table 12.3 Proportion of population under 20 in England and
Wales who were scholars, 1818–71
1818 1833 1851 1861 1871
0.128 0.179 0.267 0.346 0.355
Source: Mitch 1982: 10.
Turning to subsidised schools, there
does seem to have been an extensive
charity school network in the early eigh-
teenth century. However, there is lit-
tle evidence to suggest clear revival or
growth of this network (Simon 1968).
Beginning in the early nineteenth century, various religiously affiliated
societies do seem to have been active in promoting the growth of school-
ing provision. The national surveys sponsored by parliament in 1818 and
1833 are themselves evidence of awakened national interest in schooling
activity. And in 1833 parliament began to fund the building of schools
and subsequently developed apparatus for supporting running costs as
well as for the development of curriculum standards and the provision
of teacher training and certification. The impact of this was revealed in
rising enrolment rates in day schools between 1818 and 1851. Yet private-
venture enrolments appear to have kept up with subsidised enrolments
throughout this period. The proportion of all scholars who were enrolled
in private venture schools was more or less the same, at 60 per cent, in
both the 1818 and the 1833 national educational surveys.
Sunday schools experienced the clearest surge of activity in the late
eighteenth and early nineteenth centuries. They were virtually non-
existent before the late eighteenth century. By the second quarter of the
nineteenth century, Sunday school enrolments exceeded those in day
schools. While Sunday schools commonly had religious affiliations and
sponsorships, they also appear to have offered some secular instruction
in basic literacy skills. Historians have differed over the extent to which
their expansion was driven by working-class demand for secular educa-
tion or by the supply of sponsoring religious organisations (Laqueur 1976;
Dick 1980). Sunday schools were commonly used as an alternative to day
school instruction. Sunday school enrolment rates were positively corre-
lated with child labour force participation and negatively correlated with
literacy rates (Laqueur 1976; Mitch 1992; Snell 1999).
The period 1700 through 1860 does not appear to have been one of
general expansion or improvement for secondary and university educa-
tion. Secondary education during the eighteenth century was subject
to conflicting forces. Inflation had eroded the value of many grammar
school endowments but students seeking commercial and related types
of practical education contributed to the growth of dissenting academies
(Parker 1969; O’Day 1982). Enrolments at Oxford and Cambridge reached a
nadir in the mid-eighteenth century and university enrolments relative to
population continued to decline in England through the mid-nineteenth
century (Sanderson 1972b: 3; Stone 1974). In any case, no more than a
small percentage of the population would have enrolled in secondary
or higher education during this period. There does appear to have been
an upsurge in more informal intellectual institutions such as literary,
Cambridge Histories Online © Cambridge University Press, 2008

Education and skill of the British labour force 347
philosophical and scientific societies and in free-lance lecture series with
quite diverse aims and clientele (Musson and Robinson 1969; O’Day 1982:
210; Inkster 1991) but the magnitude and significance of this activity are
difficult to gauge.
Turning to trends in other forms of human capital than schooling,
formal apprenticeship is commonly seen as going into decline during
theeighteenth century, culminating in repeal of the Statute of Artificers
in 1814. Dunlop’s (1912) assessment is that compulsory apprenticeship
under the terms of the Statute of Artificers was in decline as early as the
late seventeenth century. According to her, over the course of the eigh-
teenth century, capitalist master employers who increasingly demanded
less skilled labour than that implied by a seven-year apprenticeship term
were able to evade the conditions of the Statute. In trades in which guilds
were able to maintain their control over entry or in which an extensive
apprenticeship period was genuinely required for mastery of the skills
involved, apprenticeship, albeit voluntary, persisted into the nineteenth
century. Snell (1985), using settlement documents for artisans from south-
ern England, found that the length of apprenticeship terms declined
appreciably in the second half of the eighteenth century compared with
thefirst half. He argued that this occurred because apprentices perceived
shrinking opportunities for utilising the skills acquired and hence less
value in completing their apprenticeships. This decline was in evidence in
theapprenticeship documents that Snell examined for women as well.
However, Berg (1987: 75) has suggested that the purpose of female ap-
prenticeships was more often to provide support and socialisation while
awaiting marriage than mastery of specific crafts. Furthermore, with the
decline in the agricultural sector and shift of labour out of agriculture,
both the more structured institutions such as service and the more in-
formal exposure to agricultural work that served as training would have
been on the decline as well.
Some have argued that the eighteenth-century decline of apprentice-
ship was followed by further deskilling tendencies in the early nineteenth
century, with the rise of outwork or so-called sweated trades and the in-
creasing employment of women in unskilled manufacturing occupations,
especially textiles and metal manufactures (Berg 1987). According to this
view, the ready supply of low-wage labour, especially female labour, made
it profitable to divide up manufacturing processes in clothing, textiles
and metal working into specialised steps, each requiring dexterity that
it was thought female labour could provide but which did not entail a
long period of skill acquisition.
On the other hand more informal sorts of skill acquisition arrange-
ments arose as alternatives to apprenticeship. Boot (1995) has argued
that the effective period of training in cotton textile factories could be at
least as long as traditional formal apprenticeship, and perhaps as long as
ten years,implyingcomparable magnitudes of human capital investment
Cambridge Histories Online © Cambridge University Press, 2008

348 David Mitch
and well in excess of what characterised typical patterns of formal school-
ing. It can be argued that such informal arrangements were better suited
than traditional apprenticeships to the development and acquisition of
the range of new empirically based skills that were important for the
newly emerging technologies fuelling industrialisation. Informal train-
ing could be adjusted in length to suit newly emerging and expanding
skills and occupations. In addition factory masters wanted to instil habits
of discipline and routine in their workforce that may have been incompat-
ible with guild and artisan traditions of independence, instead requiring
amore coercive approach (Pollard 1959).
Furthermore, Boot (1991) has documented the introduction of age-
related clerical salaries in the Bank of Scotland between 1780 and 1830
in contrast to previous apparently level age-earnings gradients for clerical
staff in the bank. Boot attributes this change to the effort of the bank to
create an internal labour market in response to changing conditions in
theclerical labour market. He suggests that this reflected an increasing
tendency over time for relevant skills in the bank to rise with age.
Nettrends in skill acquisition are difficult to ascertain. Williamson
(1985) has argued that there was a rising premium for skill over the first
half of the nineteenth century and that this indicates that the demand
for skill was rising relative to supply. However, others have questioned his
estimates, and available evidence would not seem to support a uniform
widening premium for skill over the industrial revolution period (see
Mitch 1999: 268–70 for more detail). The redeployment of perhaps a quar-
terofthe male labour force from agriculture into manufacturing (based
on Crafts 1994: 45) between 1700 and 1840 and the arguably greater poten-
tial of manufacturing than agriculture for investing in skill (as suggested
by themuch flatter profile of earnings by age for agricultural labourers
than for cotton textile workers reported by Burnette (2000)) would seem
to imply a net increase in skill acquisition over this period. Baxter’s 1867
allocations of the male manual labour force according to skill level indi-
cate that over 60 per cent were in lower or higher skilled occupations (see
Table 12.4). This is arguably higher than would have been the case in 1700
as crudely suggested by the 17 per cent of those in the overall categories
of general labour, trade, distribution and manufactures, as reported in
King’s 1688 estimates (Mathias 1979: 189).
8
8
Lindert and Williamson (1982, 1983b) have proposed adjustments to both King’s 1688 figures
and Baxter’s 1867 figures. Using Lindert and Williamson’s readjustment of Baxter’s 1867
figures yields 68 per cent of the manual classes in higher and lower skilled occupations
(their figure is for all types of labour, not just male labour). Using their readjustment of
King’s 1688 figures yields 52 per cent of the manual classes in higher and lower skilled oc-
cupations. Thus, while Lindert and Williamson’s revised estimates still suggest an increase
between 1688 and 1867 in the percentage of the manual classes who were skilled, this in-
crease is considerably less than implied by King’s ‘unadjusted’ estimates. Thus there would
seem to be a good deal of uncertainty as to the extent of any increase in the percentage
of the manual labour force who were skilled during the eighteenth and early nineteenth
centuries.
Cambridge Histories Online © Cambridge University Press, 2008

Education and skill of the British labour force 349
Table 12.4 Distribution of men in the manual labour classes
across wage categories following Baxter’s 1867 classification
Premium relative to Percentage of all
Wage category in unskilled wage of adult males in
shillings per week 10 shillings per week manual labour class
Higher skilled labour and manufactures
35s. 25s. 1.07%
28–30s. 19s. 20.3%
Lower skilled labour and manufactures
25s. 15s. 14.8%
21–3s. 12s. 26.1%
Unskilled labour and agriculture
15–20s. 7.5s. 6.62%
14s. 4s. 29.2%
14.5s. 4.5s. 1.9%
Source: Based on Baxter 1868: appendix IV.
Trends in physical capital accumula-
tion appear to have been much more
rapid than those in human capital ac-
cumulation. Investment flows in physical
capital as a share of national income
were substantially larger than invest-
ment flows in schooling. West’s (1970)
estimates of direct educational expendi-
tures of £3 million in 1833 for England
is just under 10 per cent of Feinstein’s
(1978: 76) estimate of annual fixed cap-
ital formation for Britain averaged over
theperiod 1831–40 (pro-rated to Eng-
land’s population share). Allowance for
opportunity costs could increase school-
ing investments to as high as a quarter of
fixed capital formation. Once allowance
is made for workplace training investments as with Boot’s estimates, the
gap would appear to be considerably smaller. Nevertheless, there is no
clear evidence in favour of a marked increase in the rate of human capital
investment during the eighteenth and early nineteenth centuries.
This is suggested by considering the impact of a similar annihilation by
plague followed by Eskimo repopulation in 1700 as that considered above
for1860. One can use Gregory King’s figures for 1688 to estimate total na-
tional income at £44.7 million. Deducting income to nobility and rentiers,
to landed agriculture, and to trade and distribution other than seamen,
leaves an income of £17.3 million that can be attributed to labour income.
Alternative estimates per family for unskilled labour income would be
the£15 per family for labouring people and outservants and the £6.5
per family for cottagers and paupers. King estimates a total of 1,360,000
families. Using £15 per family yields an income to unskilled labour of
£20.4 million, which is greater than the total labour figure and obviously
problematic. Using the alternative lower figure yields an income to un-
skilled labour of £8.8 million. This leaves a residual for human capital of
£17.3 million − £8.8 million = £8.5 million. This in turn produces an es-
timate of the share of human capital in national income of 8.5/44.7 = 19
per cent for 1700 compared with the 15.41 per cent estimated above for
1860. However, employing the upper estimates above for 1860 human
capital shares in the range of 25 to 35 per cent implies substantially
more scope for expansion of the role of human capital during the 150
years inquestion.This underscores the degree of uncertainty in current
knowledge about the quantitative extent of skill formation during this
period.
How is one to explain the apparently limited role of human capi-
tal in the industrial revolution? One explanation, following Galor and
Moav (2000), is that Britain was still at a relatively early stage in the
Cambridge Histories Online © Cambridge University Press, 2008

350 David Mitch
accumulation of physical capital and that returns to physical capital were
substantially in excess of those to human capital. Evaluating this possibil-
ity requires deciding on the relevant margin for expansion and coming
up with economy-wide estimates for the marginal return to each type of
capital. On some margins it would appear that returns to human capital
were in excess of those on physical capital, thus challenging this expla-
nation. Estimates of both nominal and real interest rates for government
bonds and other types of capital investments tend to average in the range
of 3 to 7 per cent for the eighteenth and first half of the nineteenth cen-
turies. Estimates of the rate of return to basic literacy for the 1840s are
well in excess of 20 per cent (Mitch 1984), and Elbaum (1989) for the
early twentieth century estimates a rate of return to apprenticeship of
just over 20 per cent. A second explanation is that technical change was
not skill using during this phase but was to become so in later periods.
This can be explained by the increasing role of science-based technical
change later in the nineteenth century and the corresponding increasing
importance of formal over informal education. A third explanation is that
market failures led to underinvestment in human capital, as suggested
by its high relative returns as just noted above.
UNDERINVESTMENT IN HUMAN CAPITAL?
It has been suggested that England was underinvesting in schooling by
themid-nineteenth century, not because of evidence of the high rate of
return to schooling but on indications of higher levels of literacy and
primary school enrolments in other countries such as the United States
and Prussia (see Table 12.5A).
It is difficult to address claims of underinvestment directly, because it
is difficult to determine what the optimal level of investment in educa-
tion is for any economy. Since it is now commonly presumed in modern
societies that both the financing and the provision of primary school-
ing should be subject to government controls, the lag of England behind
other countries in establishing such provision has often been seen as
reflecting some deficiency (Green 1990).
Closer examination of England’s public provision of primary school-
ing in the eighteenth and early nineteenth centuries mitigates the ex-
tent to which there was any underinvestment due to the lack of gov-
ernment in education. There was extensive financing and provision of
non-profit schooling from non-governmental sources even prior to the
initial government funding of elementary schooling in 1833. The funds
came from a diverse mix of organisations and individuals and with di-
verse aims, including the propagation of religious doctrine, philanthropy
and a sense of obligation to the local community. As early as 1818, some
40 per cent of the scholars recorded in a national parochial survey were
Cambridge Histories Online © Cambridge University Press, 2008