Gubbins D., Herrero-Bervera E. Encyclopedia of Geomagnetism and Paleomagnetism
Подождите немного. Документ загружается.

Si
Si
X
and O
O
X
are much less mobile than is Mg
Mg
X
and the migrations
of these two ions do not work as effective conduction mechanisms.
Ionic conduction is also a thermally activated process, and can be
written as:
s ¼ s
0
expðDE
i
=kTÞ (Eq. 3)
where DE
i
is the activation energy for ionic conduction. The bodily
motion of ions causes a very strong distortion of the lattice and so
the activation energy for ionic conduction would be much larger than
that of a small polaron (DE
i
DE
p
). This indicates that the tempera-
ture dependence of ionic conduction is much larger than that of small
polaron conduction. Ionic conduction can dominate small polaron con-
duction at higher temperatures.
The population of V
Mg
00
increases with that of Fe
Mg
.
so that the
charge balance is maintained. The increase in oxygen partial pressure
increases Fe
Mg
.
and, therefore increases V
Mg
00
. Hence, the ionic con-
ductivity of V
Mg
00
increases with increasing oxygen partial pressure.
Ionic conductivity is linked with the diffusion coefficient by the
Nernst-Einstein relation:
s ¼ q
2
nD=kT (Eq. 4)
where q is the charge of the carrier, n is the concentration of the car-
rier, and D is the diffusion coefficient. The diffusion is a thermally
activated process:
D ¼ D
0
expðDH
d
=kTÞ (Eq. 5)
From Eqs. (4) and (5), we have
s ¼ðq
2
nD
0
=kTÞexpðDH
d
=kTÞ (Eq. 6)
Therefore, the preexponential term for ionic conduction is inversely
proportional to the absolute temperature. The migration of a small
polaron is also a diffusion process and its preexponential term should
also be inversely proportional to the absolute temperature.
A certain amount of water could be transported into the deep mantle
by the subduction process. Although water should form hydrous
minerals, olivine and its high-pressure polymorphs can contain a cer-
tain amount of water. The rate of diffusion of a proton is very high
and so transportation of an electric carrier by H
þ
(proton conduction)
could have an important role in electrical conduction in the deep
mantle. Proton conduction is a form of ionic conduction and so its
temperature dependence should be also expressed by Eq. (3).
Though it is usually difficult to specify the electrical conduction
mechanism, an indication may come from the sign of the dominant
charge carrier that can be inferred from the thermopower. The thermo-
power, Q, is the ratio of the voltage, DV, generated across a sample
with a temperature difference, DT,toDT:
Q ¼DV
T
=DT: (Eq. 7)
The voltage, DV
T
, is generated because the charge carrier has a larger
energy at a higher temperature. Hence, the sign of the charge carrier is
the same as that of the thermopower, Q.
At high pressures, compression can change the energy barrier. We
introduce the activation enthalpy, DH, as follows:
DH ¼ DE þ PDV (Eq. 8)
where P is pressure and DV is the activation volume.
In small polaron conduction, the energy barrier for migration of a
hole decreases with increasing pressure because the distance between
ions shortens. Hence, it is expected that small polaron conductivity
should increase with an increasing pressure (DV
a
< 0). In ionic
conduction, the corridor for the bodil y migration of ions narrows with
increasing pressure, resulting in an increase in the energy barrier.
Hence ionic conduction is expected to have negative pressure depen-
dence (DV
a
> 0).
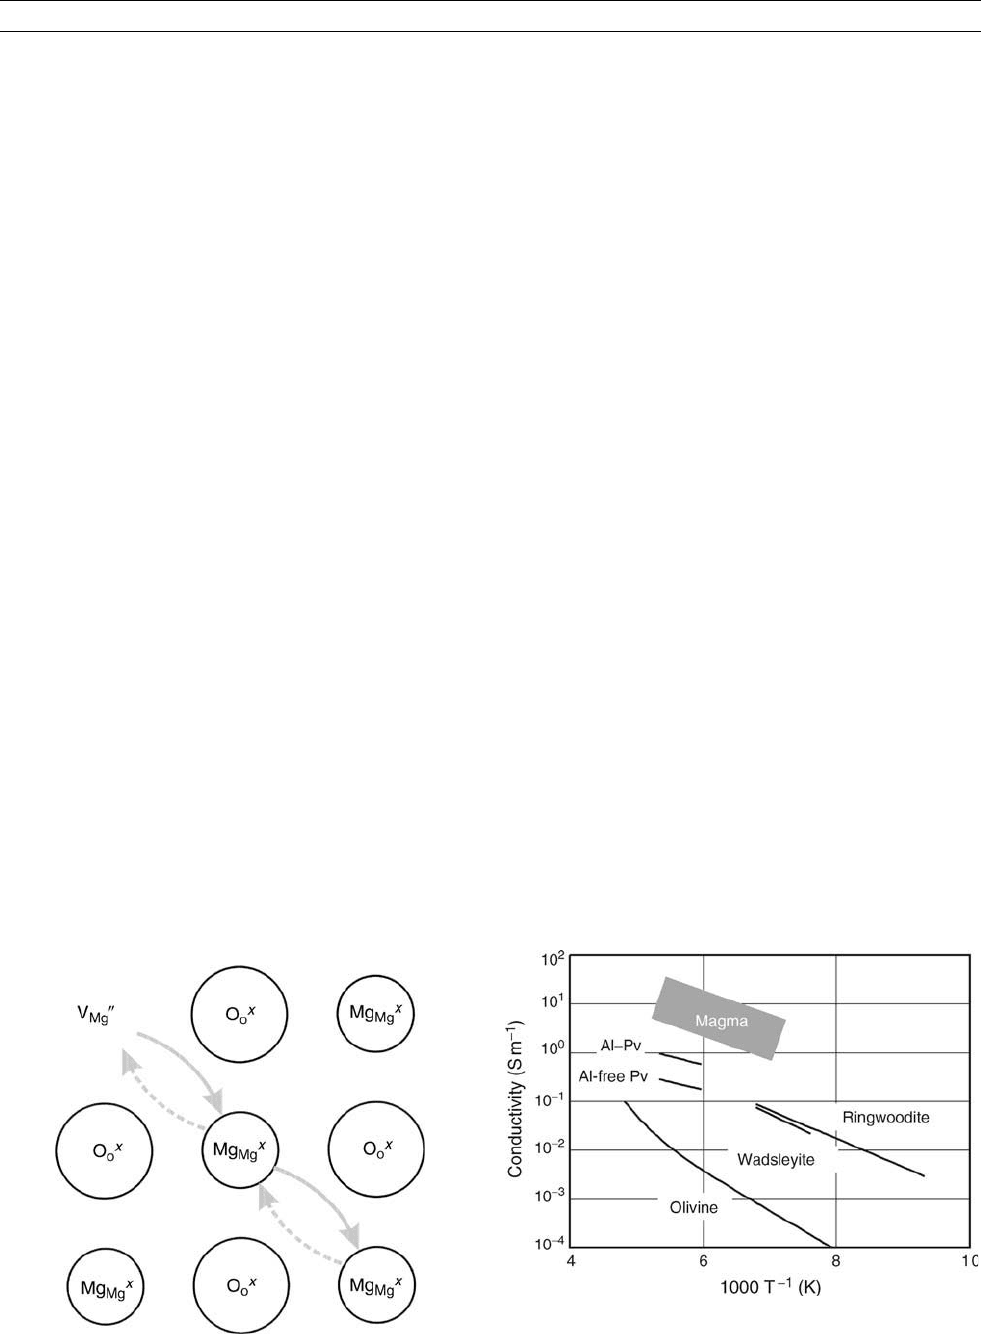
Electrical conductivity of mantle minerals
In this section, the electrical conductivities of the major mantle miner-
als are explained, which are summarized in Figure M185.
Olivine
The electrical conductivity of olivine has been extensively studied.
The measurement of thermoelectric effects has shown that the charge
of the dominant carrier of olivine is positive at temperatures below
1600 K, whereas it becomes negative above 1700 K. This suggests that
there should be two electrical conduction mechanisms. The mechanism
dominant at lower temperatures is considered to be the small polaron
conduction by Fe
Mg
.
. The mechanism dominant at higher temperatures
is considered to be the migration of V
Mg
00
(ionic conduction).
Figure M184 Ionic conduction. Mg
Mg
X
diffuses through V
Mg
00
,
which causes the migration of V
Mg
00
.
Figure M185 Electrical conductivity of olivine, wadsleyite,
ringwoodite, Al-free perovskite, and Al-bearing perovskite against
reciprocal temperature. The shaded area denotes the conductivity
of various kinds of silicate magmas.
686 MANTLE, ELECTRICAL CONDUCTIVITY, MINERALOGY

It is reported that the electrical conductivity of natural olivine with
Mg/(Mg þ Fe) ¼ 0.91 at temperatures of 1000–1770 K under an oxy-
gen partial pressure of 10
4
Pa can be expressed as the sum of two
exponential functions:
s ¼ 10
2:4
ðSm
1
Þexp½1:6ðeVÞ=kT þ10
9:2
ðSm
1
Þ
exp½4:2ðeVÞ=kT: (Eq: 9Þ
The activation energy of ionic conduction (4.2 eV) is much larger than
that of small polaron conductivity (1.6 eV). The conductivity increases
by a power of 1.8 of the Fe/(Mg þ Fe) ratio. Conductivity also
increases by one-seventh power of the oxygen partial pressure. The
pressure dependence is small. It is reported that the activation volume
is þ0.6 cm
3
mol
1
. The plus sign of the activation volume is not
consistent with the small polaron model.
Olivine has an orthorhombic crystal structure, resulting in aniso-
tropy of the electrical conductivity. Conductivity in the [001] crystallo-
graphic direction is about twice those in the [100] and [010] directions.
Anisotropy of electrical conductivity in the upper mantle could be
observed in the future.
Olivine has an M
2
SiO
4
stoichiometry, where M ¼ Mg, Fe, Ni,
Ca..., and does not contain H
þ
as a first approximation. However, a
small amount of H
þ
up to the order 1000 ppm can be contained in oli-
vine at high pressures. Diffusion of H
þ
in olivine is very fast so that
even a small amount of H
þ
cause high-electrical conductivity.
Wadsleyite and Ringwoodite
Ringwoodite has a spinel structure, in which structural units A and B are
arranged alternatively. Unit A consists of a SiO
4
tetrahedron, and unit B
consists of MgO
6
octahedra. Wadsleyite has a modified spinel structure.
The structural units of wadsleyite are the doubles of those of ring-
woodite. Unit AA is a Si
2
O
7
unit, and unit BB consists of MgO
6
octa-
hedra. Thus, although wadsleyite has a more complex structure than
ringwoodite, the structures of these two minerals are fairly similar.
The electrical conductivities of these two minerals also have similar
values, which may reflect their structural similarity. The conductivities
of these minerals are about two orders of magnitude higher than oli-
vine. The conduction mechanisms of these minerals have not been
clarified. They could be a small polaron of Fe
Mg
.
, because the carrier
charge is plus. Their activation enthalpies are about 1 eV, which are
considerably smaller than that of olivine (1.7 eV). That is, the tempera-
ture dependences of the electrical conductivities of these two minerals
are much smaller than that of olivine. The conductivities of these two
minerals were measured over only a reasonably small temperature
range, that is, 1173–1473 K. The preexponential terms are 100–1000
Sm
1
, which are indistinguishable from that of olivine.
The electrical conductivity of wadsleyite is about two orders of
magnitude higher than that of olivine. Hence the olivine-wadsleyite
transition causes a significant conductivity jump. In contrast, because
conductivities of wadsleyite and ringwoodite are quite similar, the
wadsleyite-ringwoodite transition does not cause a conductivity jump.
A certain amount of water (up to 3%) can be contained in wad-
sleyite and ringwoodite through substituting silicon. However, the con-
tribution of proton conduction to the electrical conductivity of
wadsleyite and ringwoodite has not yet been clarified.
Perovskite
The composition of mantle perovskite is primarily (Mg,Fe)SiO
3
.Inaddi-
tion to these components, perovskite can also contain up to 25% Al
2
O
3
.In
the lower mantle, perovskite would contain up to 6% Al
2
O
3
. The Mg site
is probably too large for Al. Hence, Al should predominantly substitute
the Si site (Al
Si
`). To keep the charge valance, the Fe in the Mg site tends
to be trivalent (Fe
Mg
.
) if perovskite contains an Al
2
O
3
component.
The electrical conductivity of Al-free (Mg
0.9
Fe
0.1
)SiO
3
perovskite is
10
0.8
–10
0.5
Sm
1
at 1700–1900 K. The conductivity of (Mg
0.9
Fe
0.1
)
SiO
3
perovskite with 3% Al
2
O
3
is about half an order of magnitude
higher than that of Al-free perovskite; that is, 10
0.3
–10
0
Sm
1
in
the same temperature range. The higher electrical conductivity of
the Al-bearing perovskite implies that the dominant conduction
mechanism is the small polaron of Fe
Mg
.
. The activation enthalpies of
Al-free and Al-bearing perovskites have similar values, 0.6–1.0 eV,
even smaller than those of wadsleyite and ringwoodite.
The electrical conductivity of perovskite at the top of the lower
mantle is 10
0
Sm
1
, and is about half order of magnitude higher than
that of ringwoodite. Therefore, the postspinel transition should cause a
conductivity jump by half an order of magnitude.
The electrical conductivity of perovskite has very little pressure
dependence. Activation volume is about 0.1 cm
3
mole
1
. The nega-
tive sign of the activation volume (i.e., conductivity increases with
increasing pressure) is consistent with the small polaron model.
Activation energy is relatively small, and the temperature gradient in
the mantle is small (0.2–0.5 K km
1
). Therefore, the electrical con-
ductivity of perovskite should be nearly constant and of the order of
10
0
Sm
1
throughout the lower mantle.
Magma
Silicate melts (magma) generally have higher conductivity than solid
minerals. Their conductivity is 10
0
–10
2
Sm
1
at temperatures above
1500 K. The high conductivity of silicate melts is probably because
of the high mobility of atoms in silicate melts. Hence the dominant
conduction mechanism is considered to be ionic conduction.
Under the conditions found in the mantle, the wetting angle of sili-
cate melts is significantly small. Hence, silicate melts easily form a
network structure in mantle rocks even though their fraction is very
low. The network of the melts works as a conduction path and there-
fore the presence of a small amount of silicate melts should drastically
increase electrical conductivity. The conductivity anomalies observed
in the mantle could be attributable to a certain degree of melting of
mantle rocks.
Explanation of the elect rical conductivity
of the mantle
A laboratory electrical conductivity model is shown with observations
in Figure M181. Generally, mantle minerals with a higher-pressure sta-
bility field have higher electrical conductivity. This fact is primarily
responsible for the increase of the electrical conductivity in the upper
mantle. The activation enthalpy of mantle minerals with a higher-
pressure stability field is lower, which means they have smaller
temperature dependence. This is one of the reason why the uniform
electrical conductivity is more in the deeper mantle.
Conductivity increases by two orders of magnitude with the olivine-
wadsleyite transition, whereas it increases by half an order of magni-
tude with the postspinel transition. The seismic velocity jumps asso-
ciated with the 410- and 660-km zone are both significant. By
contrast, the conductivity jump associated with the olivine-wadsleyite
transition is four times larger than that of the postspinel transition.
Therefore, the conductivity jump associated with the 410-km disconti-
nuity should be much larger than that of the 660-km discontinuity, if
indeed the latter is observed at all.
The conductivity of the HCL at the top of the upper mantle is too
high to be explained by the conductivity of normal mantle olivine.
Some additional contribution is required. One possibility is that partial
melting occurs in the region and the melt forms an electrically conduc-
tive path in the mantle rock. Another possibility is that olivine in the
region contains considerable amounts of hydrogen and hence the elec-
trical conductivity is significantly raised by proton conduction. For
now, the lack of sufficient experimental evidence means we cannot
posit an explanation for this situation.
Tomoo Katsura
MANTLE, ELECTRICAL CONDUCTIVITY, MINERALOGY 687

Bibliography
Poirier, J.-P., 2000. Introduction to the physics of the Earth’s interior,
2nd edn. Cambridge: Cambridge University Press.
Utada, H., Koyama, T., Shimizu, H., and Chave, A.D., 2003. A semi-
global reference model for electrical conductivity in the mid-
mantle beneath the north Pacific region. Geophysical Research
Letters, 30: 1194, doi:10.1029/2002GL016092.
Xu, Y., Shankland, T.J., and Poe, B.T., 2000. Laboratory-based electri-
cal conductivity in the Earth’s mantle. Journal of Geophysical
Research, 105: 27865–27875.
Cross-references
Earth Structure, Major Divisions
Electrical Conductivity of the Core
Electromagnetic Induction
Geomagnetic Deep Soundings
Magnetotellurics
MANTLE, THERMAL CONDUCTIVITY
The thermal conductivities of familiar igneous rocks, such as basalt,
at laboratory pressure, are typically k 2:5Wm
1
K
1
. Taking
a high-temperature specific heat, C
P
¼ 1200 J K
1
kg
1
and
r ¼ 2800 kg m
3
as the basalt density, the corresponding thermal
diffusivity is ¼ k
=
rC
P
7:4 10
7
m
2
s
1
. For mantle minerals
we find k 4.0 W m
1
K
1
, 1.0 10
6
m
2
s
1
. Thermal con-
ductivity of the crust and uppermost mantle (the lithosphere) can differ
little from the conductivities of laboratory samples, but for the deep
mantle, the effects of high pressure as well as high temperature must
be considered. If we nevertheless assume that there is no dramatic
variation in diffusivity, then thermal diffusion is too slow to influence
the deep structure or thermal history. Heat transport in the mantle is
by convection and conduction is important only in boundary layers with
steep temperature gradients. In the context of geomagnetism this means
especially the D
00
layer at the bottom of the mantle, adjacent to the core.
Lattice conductivity and the effect of pressure
We have only a crude theory of thermal conductivity for complex
materials, such as rocks. While we know that lattice conductivity is
due to phonons, the quanta of thermal vibration, a calculation of con-
ductivity requires an estimate of the mean free path of phonons, the
average distance traveled between the scattering events that randomize
them, and there are several scattering mechanisms, some of which
are difficult to quantify. In a hypothetical, perfect single crystal, scat-
tering would arise only from interactions between phonons. This is
the best understood of the scattering processes and so has received
most attention in discussions of mantle conductivity. It is a conse-
quence of anharmonicity, or nonlinearity in atomic bond forces. If
these forces were perfectly linear, that is, if the forces on displaced
atoms were simply proportional to their displacements, then their
oscillations would be harmonic or sinusoidal, with no interaction
between superimposed oscillations (phonons would not scatter one
another). The anharmonicity of real materials is apparent as positive
thermal expansion coefficients and is described theoretically in terms
of the Grüneisen parameter, g (q,v.). The fundamental physics of the
process is discussed by Kittel (1971); Poirier (1991) summarized its
application to geophysics, emphasizing an expression, due originally
to A.W. Lawson, representing the variation of conductivity with
temperature and pressure.
Phonon-phonon scattering, which leads to Lawson’s formula, is
observable only under highly idealized conditions. For common rocks
Lawson’s formula overestimates conductivity by a factor of order 10.
In these materials, phonon scattering is due to their interactions with
crystal imperfections and the random distribution of different ele-
ments, even including different isotopes of the same element. The tem-
perature and pressure dependences of “impurity scattering” are not
represented by the theory of phonon-phonon scattering. The extreme
case of an “imperfect crystal” is a glass, in which the atomic
arrangement resembles that of a liquid. Glasses have much lower ther-
mal conductivities than the corresponding crystalline solids and both
the temperature and pressure dependences are opposite to those of
pure, simple solids. The result is a very confused picture of phonon
scattering in chemically and crystallographically complicated materi-
als, such as rocks, making it impossible to extrapolate reliably to the
base of the mantle. It appears safest to assume that there is no dramatic
variation in conductivity with depth in the mantle and to verify that
this leads to no conflict with what we understand about the properties
of D
00
(see below).
Radiative heat transfer
Materials that are transparent at infrared wavelengths may transmit heat
radiatively, giving an additional component of thermal conductivity at
high temperature. This is an important heat transport mechanism in
the interiors of stars and was introduced to geophysics by S.P. Clark.
In the simple case of a “gray body,” a generalization of the ideal black
body of radiation laws, in which the absorption of radiation with
depth of penetration is the same for all wavelengths, the radiative
conductivity is
k
R
¼
16
3
n
2
2
sT
3
where n is refractive index, s ¼ 5:67 10
8
Wm
2
K
4
is the Stefan-
Boltzmann constant and 2 is the opacity, the reciprocal of the aver-
age distance traveled by a photon before absorption. For an idea of
how significant this may be we can calculate the value of 2 required
to give a radiative conductivity equal to a plausible lattice conductivity
at a temperature of 2500 K (near to the base of the mantle). We find
e 2500 m
1
, corresponding to a penetration depth of 0.4 mm. Thus,
a quite modest transparency would suffice to make this an important
consideration.
The opacities of mantle minerals are controlled primarily by their
iron contents, especially if the iron occurs as both Fe
2þ
and Fe
3þ
ions,
providing an absorption mechanism by charge transfer. Electron
energy bands are broadened by pressure, making this process easier
by spreading the wavelength range of absorption. Lower mantle miner-
als are believed to be primarily (Mg,Fe)SiO
3
perovskite and (Mg,Fe)O
magnesiowustite, both with substantial iron contents, so that, although
the question is not conclusively resolved, it appears unlikely that
radiative transfer is important in the lower mantle.
Conduction of core heat into the D
00
layer
The structure of D
00
is complicated by compositional heterogeneity, mak-
ing a direct interpretation of seismological observations in terms of tem-
perature difficult, at best. However, we have a reasonable idea of the
thickness of the D
00
zone and if this is accepted as representative of the
thickness of the thermal boundary layer (see D
00
as a boundary layer)
then we can use it to estimate the diffusivity and hence conductivity.
D
00
is modelled as a 150 km thick layer in PREM (Dziewonski and
Anderson, 1981) and this value is assumed here. An uncertainty of 50 km
or so is of no consequence as we can only make a rough calculation.
The temperature at the core-mantle boundary, estimated as 3740 K
from core properties (see Core, thermal conduction), is almost 1000
K higher than the lower mantle temperature estimated by extrapolating
adiabatically from the 670 km deep phase transition zone (2760 K).
We must, therefore, consider a 1000 K temperature increment across
the boundary layer. This means that the mantle material in contact with
688 MANTLE, THERMAL CONDUCTIVITY

the core has a viscosity that is lower by a factor of at least 10
4
than that
of the mantle a few hundred kilometers higher, concentrating convec-
tive flow in a very thin layer at the bottom. A theory of the mechanism
by which this flow feeds narrow hot plumes is given by Stacey and
Loper (1983), but a simple analog represents the essential features.
As the hot material is skimmed off into narrow buoyant plumes,
there is a general collapse of the mantle on to the core to replace it.
The analog is the ablation of materials from the surfaces of meteorites
and spacecraft entering the atmosphere. A steady, exponential profile
of temperature, T, is established, moving inward as surface material
is removed, so that
T T
0
¼ðT
S
T
0
Þexpðh=HÞ
where h is the distance from the heated surface, at temperature T
S
,
and T
0
is the temperature well removed from the ablating surface.
Our interest is in the scale height, H, which we identify with the
thickness of D
00
H ¼
=
v
being thermal diffusivity and v is the speed of the collapse of the
mantle on to the core. If the core to mantle heat flux is
_
Q
A (per
square meter) then
_
Q
A ¼ vrC
P
T
S
T
0
ðÞ
and if we estimate this as 0:033 W m
2
(5 10
12
W over the
surface of the core-mantle boundary) then these relationships give
¼ 7:6 10
7
m
2
s
1
, in fortuitously close coincidence with the
value for basalt at zero pressure.
Although this calculation is simplified and approximate, it
encourages the view that thermal diffusivity does not vary greatly
through the mantle. With the higher density at the core-mantle bound-
ary the corresponding conductivity is k 5W m
1
K
1
, higher than
for laboratory samples, but not dramatically so.
A general conclusion
Thermal conductivity of the deep mantle is poorly constrained by either
observation or theory, in spite of repeated efforts to understand it, but we
have no evidence that it differs greatly from the conductivity of the
uppermost mantle or laboratory samples of basic or ultrabasic rock. In
this circumstance core heat is conducted into a boundary layer at the base
of the mantle, 100 to 200 km thick, softening it and allowing for its
removal in buoyant plumes. Convection, not conduction, is responsible
for heat transport up the several thousand kilometer depth of the mantle.
Frank D. Stacey
Bibliography
Dziewonski, A.M., and Anderson, D.L., 1981. Preliminary reference
Earth model. Physics of the Earth and Planetary Interiors, 25:
297–356.
Kittel, C., 1971. Introduction to Solid State Physics, 4th edn. New
York: Wiley.
Poirier, J.-P., 1991. Introduction to the Physics of the Earth’s Interior.
Cambridge: Cambridge University Press.
Stacey, F.D., and Loper, D.E., 1983. The thermal boundary layer inter-
pretation of D
00
and its role as a plume source. Physics of the Earth
and Planetary Interiors, 33:45–55.
Cross-references
Core, Thermal Conduction
D
00
as a Boundary Layer
Grüneisen’s Parameter for Iron and Earth’s Core
MATUYAMA, MOTONORI (1884–1958)
Born in Oita Prefecture, Japan, as a son of a Buddhist priest, he
graduated from the physics department, Kyoto University, 1911. He
became lecturer in 1913, associate professor in 1916, and then profes-
sor in the Department of Geology, Kyoto University, from 1922 to
1946. He studied at the University of Chicago between 1933 and
1935. After retirement from Kyoto University, he served as president
of the Yamaguchi University, from 1949 to his death. For his contribu-
tion to paleomagnetism and gravity, Matuyama was elected to Member
of Japan Academy in 1950.
In the 1920s, Matuyama conducted a systematic survey of the nat-
ural remanent magnetization (NRM) of Quaternary and late Tertiary
volcanic rocks in Japan, Korea, and Northeast China (Manchuria at
that time). The determination of the dipole moment was done by the
method of Gauss (spherical harmonic analysis). In the results, he noted
that the youngest rocks are always magnetized to directions similar to
the present day field, while many of the early Quaternary and Tertiary
rocks had NRMs almost oppositely directed. In all cases, there were
not many rocks with the NRMs in the intermediate directions. On
the basis of these observations, Matuyama concluded that the Earth’s
magnetic field was in the reversed state in the late Tertiary (Miocene)
and again in the early Quaternary (Matuyama, 1929). This early report
was later picked up by Allan Cox and Richard Doell, who named the
reversed interval just before the current normal period (Brunhes epoch)
after him (Matuyama epoch). “Matuyama” thus became one of the most
often referred personal names of Japanese origin. “Matuyama chron” is
often quoted in the studies such as magnetostratigraphy, seafloor
spreading, sedimentology, geomagnetic reversal timescale, and so on.
Earlier in his career, Matuyama performed gravity survey of a coral
reef in the Marshall Islands using an Eötvös deviatoric gravimeter.
This was one of the earliest application of gravity methods to the study
of the crustal structure, especially in the coral islands. Gravity contin-
ued to be one of his main research subjects and, inspired by the work
of Vening Meinesz in the Indonesian Archipelago, he also measured
the gravity near the Japan Trench in a submarine of the Japanese Navy
(Matuyama, 1934). This led to the discovery of the westward offset of
the center of the negative gravity belt from the trench axis, which later
became an important factor for considering the origin of the great
earthquakes in the Sanriku region. Other subjects he studied include
the rheological properties of the ice, which was undertaken in colla-
boration with T.C. Chamberlin of the University of Chicago when he
stayed in the United States
Masaru Kono
Bibliography
Matuyama, M., 1929. On the direction of magnetization of basalt in
Japan, Tyosen, and Manchuria. Proceedings of the Imperial Acad-
emy (Tokyo), 5: 203–205.
Matuyama, M., 1934. Measurement of gravity over the Nippon Trench
on board the I.J. submarine Ro–57, Preliminary report. Proceed-
ings of the Imperial Academy (Tokyo), 10: 626–628.
MELTING TEMPERATURE OF IRON IN THE
CORE, EXPERIMENTAL
Introduction
There are two major techniques commonly used for ultrahigh pressure
melting studies: shock wave experiments and the internally heated dia-
mond anvil cell (DAC). In shock compression experiments, the sample
is subjected to high pressures and high temperatures by dynamic pro-
cesses (see Shock wave experiments). In DAC experiments, pressure is
MATUYAMA, MOTONORI (1884–1958) 689
generated by pressing two opposing diamond anvils, while heating is
applied resistively and/or using laser heating. Both techniques have
been extensively applied to study high pressure melting of iron. How-
ever, accurate determination of melting is exceedingly difficult at
extremely high pressure and temperature conditions. The associated
weaknesses—the short timescale in shock compression and the small
sample size in DAC—are reflected by the large uncertainties and the
discrepancy among literature values on melting temperature of iron
in the core.
In this section, we begin with a brief description of the generation of
simultaneous high pressures and temperatures in the DAC, followed
by a discussion on the observation of the onset of the melting transi-
tion and the determination of pressure-temperature conditions asso-
ciated with the observation. A brief review is given on DAC
experiments in studying the melting temperature of iron at high
pressures. The effect of light elements on the melting temperature is
discussed in the end.
For more details on this topic, the following review articles are sug-
gested. See Melting temperature of iron in the core, theory for theore-
tical approaches in this area.
1. Jephcoat, A.P., and Besedin, S.P., 1996. Temperature measurement
and melting determination in the laser-heated diamond-anvil cell.
Philosophical Transactions of the Royal Society of London, Series
A, 354(1711): 1333–1360.
2. Shen, G., and Heinz, D.L., 1998. High pressure melting of deep
mantle and core materials. In Hemley, R.J. (ed.), Ultrahigh Pressure
Mineralogy: Physics and Chemistry of the Earth’s Deep Interior.
Washington, DC: Mineralogical Society of America, pp. 369–396
3. Boehler, R., 2000. High pressure experiments and the phase dia-
gram of lower mantle and core materials. Reviews of Geophysics,
38: 221–245.
Diamond cell technique
Diamond as anvil and window
Diamond is a premier anvil material because it is the hardest material
known, and it is transparent from infrared to hard X-rays, thus provid-
ing a window for probing samples by various methods and for heating
samples by lasers. With the DAC technique, pressures beyond that at
the center of the Earth have been reported (Xu et al., 1986). The prin-
cipal components of a DAC are two opposing diamond anvils with a
gasket in between. A drilled hole in the center of the gasket serves
as sample chamber. For melting experiments at very high pressures,
typical dimensions of a sample chamber are 10–20 mm thick and
50 mm in diameter.
Heating diamond anvil cells
An easy way to provide heating is to heat the entire DAC externally.
However, there is a temperature limit of 1500 K with this method.
To generate extreme high temperatures to melt iron at high pressures,
internal heating methods are generally employed. One is the resistive
wire heating, in which iron is used as a conductor wire and heating
is applied electrically (Boehler, 1986; Mao et al., 1987). With this
method, temperatures can go as high as its melting point, but pressures
are limited because of deformation of the electrical leads as pressure
increases. The other is the laser-heating technique, in which near- or
mid-infrared lasers (Nd:YAG, Nd:YLF, CO
2
) are used for heating sam-
ples in DAC. There are, in principle, no pressure and temperature lim-
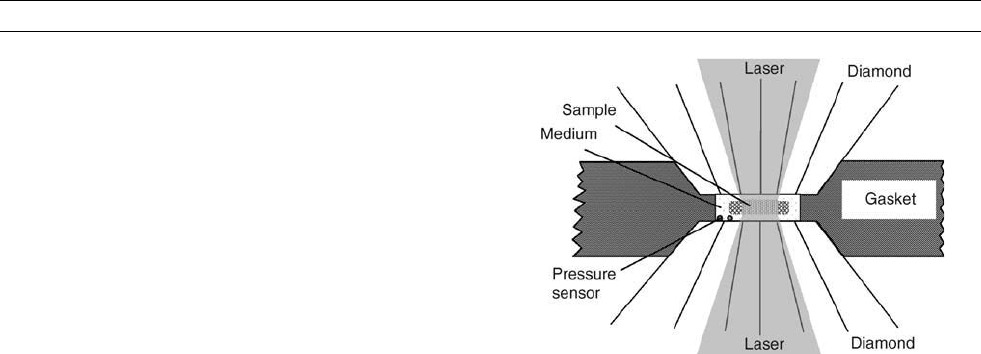
itations associated with this technique. The challenge is to control
pressure and temperature conditions, to measure them accurately, and
to characterize the sample at defined conditions. A typical sample con-
figuration is shown in Figure M186.
Pressure measurement
Pressures in the laser-heated DAC are often measured by the ruby fluor-
escence method (Mao et al., 1986) before and after laser heating or
during heating from unheated ruby chips away from the heating
area. When the laser-heating experiment is coupled with synchro-
tron radiation, pressures are estimated by measuring unit cell
volumes of samples whose pressure-temperature-volume equations
of state are known. For pressures measured before and after laser
heating, thermal pressure (caused by the material’s thermal expan-
sion) has to be considered in estimating pressures at high tempera-
ture. Thermal pressure may be minimized by choosing a hydrostatic
pressure medium and a small sample-to-medium ratio, and/or char-
acterized with the use of highly collimated synchrotron radiation.
Temperature measurement
Temperature measurement is based on the collected radiation from
thermal emission through the Planck radiation law: I
l
¼ c
1
e(l)l
–5
/
[exp(c
2
/lT)1], where I
l
is spectral intensity, l is wavelength, T
is temperature, c
1
¼ 2 phc
2
¼ 3.7418 10
–16
Wm
2
, c
2
¼ hc/k ¼
0.014388 mK, and e(l) is emissivity with e(l) ¼ 1 for a black body.
This method covering a range of wavelengths is often called spectral
radiometry, as compared to the general pyrometry in which thermal
radiation at only one wavelength is measured. One major advantage
of spectral radiometry is that, assuming wavelength-independent emis-
sivity, temperatures can be measured independently from the absolute
emissivity. However, emissivity is often found to be wavelength
dependent. Use of the available data on the wavelength-dependent
emissivity at ambient pressure (de Vos, 1954) gives about a 5% tem-
perature correction downward at 3000 K and about 12% downward
at 5000 K when compared with the results from the assumption of
wavelength-independent emissivity. Unfortunately, such a correction
cannot be accurately made because the wavelength dependence of
emissivity is not currently known at high pressures and high tempera-
tures, and it can be strongly dependent on the surface finish of a DAC
sample. This is the main limitation in the absolute accuracy of tem-
perature measurement by the spectral radiometry method.
Melting criteria
Melting is thermodynamically defined as equilibrium between a solid
and a liquid. When materials melt, their physical properties, such as
density, viscosity, absorption properties, and electrical resistance,
undergo a sudden change. Such property changes are characteristic
for a first-order phase transition and are often used for recognition of
Figure M186 A typical sample configuration in laser-heated
diamond anvil cell experiment.
690 MELTING TEMPERATURE OF IRON IN THE CORE, EXPERIMENTAL
melting. Unlike other first-order phase transitions, melting is character-
ized by the loss of long-range order and resistance to shear. To defini-
tively identify melting, both of these two characteristics should be
documented. Visual optical observation is a common way to determine
whether melting has taken place. It is obvious that fluid flow observa-
tion is a good measure of the loss of resistance to shear. Therefore it
has been widely used by almost all groups in the world (Saxena
et al., 1994; Jeanloz and Kavner, 1996; Jephcoat and Besedin, 1996;
Boehler, 2000). However, visual observation (fluid flow) is less obvious
as pressure increases, making it difficult to unambiguously define the
onset of melting. Synchrotron X-ray diffraction has been combined with
laser-heated DAC and used for melting studies to document the loss
of long-range order upon melting. Melting at high pressure was iden-
tified by the appearance of diffuse scattering from the melt with the
simultaneous loss of crystalline diffraction signals (Shen et al., 2004).
Synchrotron Mössbauer spectroscopy (SMS) provides another pro-
mising method to identify melting. SMS measures the atomic thermal
displacement that can be used for documenting rigidity of a material.
Upon melting the strong elastic resonance signal diminishes in SMS.
The mean-square thermal displacement of atoms (Lamb-Mössbauer
factor) can be measured as a function of temperature, providing a plot
for determining the onset of melting. Since measurement of SMS takes
only a few seconds to minutes, it holds a great potential for high
pressure melting studies.
Melting of core material at high pressures
Iron
Iron is the major component of the core. Knowledge of the melting
curve of iron can constrain the temperature of the inner core boundary
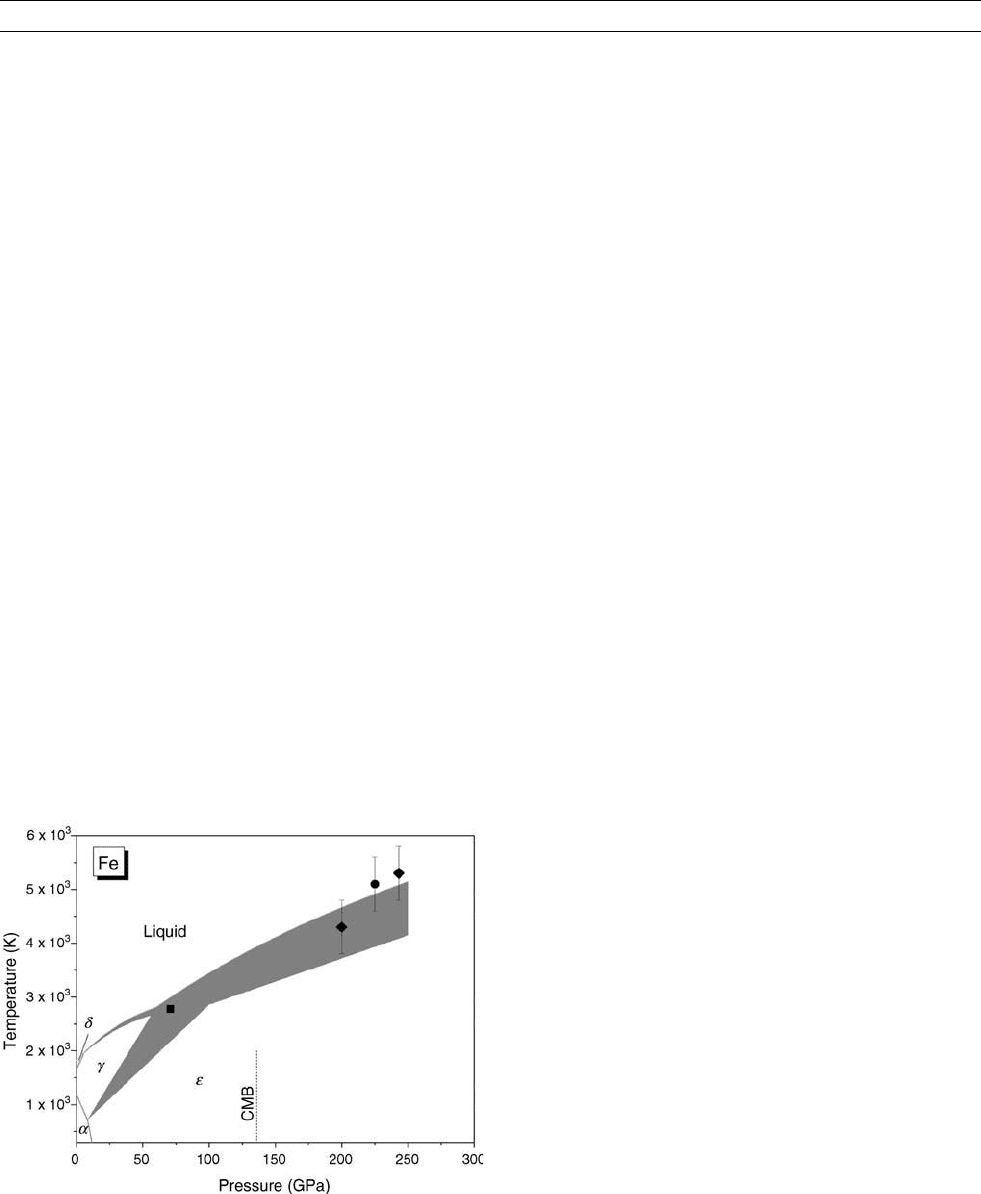
and anchor the Earth’s temperature profiles (see Core temperature). At
pressures below 50 GPa, the phase diagram of iron is reasonably well
known (Figure M187). At ambient pressure, the stable phase is a-Fe
with a body-centered-cubic (bcc) structure. At high pressure it trans-
forms to e-Fe with hexagonal-close-packed (hcp) structure. At high
temperature there is a large stability field for g-Fe with face-cen-
tered-cubic (fcc) structure. Although a controversial new solid phase
(called b-Fe) was reported (Saxena et al., 1995; Andrault et al.,
1997; Dubrovinsky et al., 1998), the existence of this phase was not
confirmed in later experiments (Shen et al., 1998; Kubo et al., 2003;
Ma et al., 2004). For the melting curve, there is a converging consen-
sus at pressures below 60 GPa, reflected by a narrow uncertainty range
in Figure M187. As pressure increases, uncertainties in phase bound-
aries, including the melting curve, become large as shown by wide
bands in Figure M187. The width of the bands represents the scatter
in literature data from recent years. Factors causing these uncertainties
include those in pressure determinations (neglecting thermal pressure,
different equations of state, and/or different standard materials), in
temperature determinations (large temperature gradient and temporal
variation, chromatic aberration in optics), and in sample characteriza-
tions (different melting criteria, transition kinetics).
Uncertainties in the melting curve and the g-e transition lead to sig-
nificant variations in the location of g-e-liquid triple point. Knowledge
of its location is important because it is the starting point used for
extrapolating the melting curve of e-Fe to core pressures. As shown
in Figure M187, the slope of g-e transition ranges from 25 to 40 K
GPa
1
, placing the triple point between 60 and 100 GPa. Such large
uncertainties in the slope of the g-e transition mainly arise from the
coexisting nature of these two phases in the pressure-temperature
range, causing difficulties in identifying the boundary. The uncertain-
ties are also contributed by the pressure-temperature determination
associated with the use of different standard materials and/or different
equations of state.
The melting data for iron above the triple point are scarce and scat-
tered, reflecting the difficulty level of such experiment. It appears that
the early DAC data (Boehler, 1993; Saxena et al., 1994) represent a
lower bound of the melting curve in this region. The later experimental
data falls at higher melting temperatures (Shen et al., 1998; Ma et al.,
2004). The shock wave data (Brown and McQueen, 1986; Nguyen and
Holmes, 2004) lie close to the upper bound. Extrapolating the data to
the inner core boundary, the melting temperature of iron is between
4800 and 6000 K at 330 GPa (see e.g., Grüneisen’s parameter for iron
and Earth’s core).
Effects of light elements
As shown by Birch (1952), the density of the Earth’s outer core is about
10% too low to be pure iron, so the core must also contain some light
elements. At present, there is no consensus on the dominant light ele-
ment in the core (see Core composition and Inner core composition).
At ambient pressure, the addition of a small amount of light elements
decreases the melting temperature of iron by up to a few hundred
degrees. Data at high pressure are scarce and limited in the Fe-
FeO-FeS system (Usselmann, 1975; Urakawa et al., 1987; Ringwood
and Hibberson, 1990; Knittle and Jeanloz, 1991; Williams et al.,
1991; Boehler, 1992; Fei et al., 1997). Eutectic melting was found in
the Fe-FeS system, while a solid solution mechanism was suggested
for Fe-FeO system (Knittle and Jeanloz, 1991; Boehler, 1992). Boehler
(1996) pointed out that the melting curves in the Fe-FeS-FeO system
converge instead of diverge with increasing pressure to that of pure iron.
However, several difficulties need to be addressed and overcome in
melting experiments of multicomponent systems using DAC. The
laser-heating spot could be on a scale similar to nonuniform samples,
which could cause large experimental errors. Large temperature gradi-
ents in radial and axial directions could lead to compositional gradients
(e.g., Soret diffusion), causing incomplete mixing during heating and
melting. Significant developments are thus needed for constraints of
light element effects on the melting temperature of iron.
Guoyin Shen
Figure M187 Iron phase diagram. Shaded areas represent the
range of literature values in recent years with static diamond anvil
cell experiments. Symbols are shock-wave data: square, Ahrens
et al. (2002); diamonds, Brown and McQueen (1986); circle,
Nyuyen and Holmes (2004). Brown and McQueen’s point at
200 GPa was interpreted as a solid-solid transition. All other
points are referred as melting.
MELTING TEMPERATURE OF IRON IN THE CORE, EXPERIMENTAL 691

Bibliography
Ahrens, T.J., Holland, K.G., and Chen, G.Q., 2002. Phase diagram of
iron, revised-core temperatures. Geophysical Research Letters, 29:
doi:10.1029/2001GL014350.
Andrault, D., Fiquet, G., Kunz, M., Visocekas, F., and Hausermann,
D., 1997. The orthorhombic structure of iron: an in situ study at
high-temperature and high-pressure. Science , 278: 831–834.
Birch, F., 1952. Elasticity and composition of Earth’s interior. Journal
of Geophysical Research, 57: 227–286.
Boehler, R., 1986. The phase diagram of iron to 430 kbar. Geophysical
Research Letters, 13: 1153–1156.
Boehler, R., 1992. Melting of Fe-FeO and Fe-FeS systems at high
pressures: constraints on core temperatures. Earth and Planetaty
Science Letters, 111: 217–227.
Boehler, R., 1993. Temperatures in the Earth’s core from melting-point
measurements of iron at high static pressures. Nature, 363:
534–536.
Boehler, R., 1996. Melting of mantle and core materials at very high
pressures. Philosophical Transactions of the Royal Society of
London, Series A, 354: 1265–1278.
Boehler, R., 2000. High pressure experiments and the phase diagram
of lower mantle and core materials. Reviews of Geophysics, 38:
221–245.
Brown, J.M., and McQueen, R.G., 1986. Phase transitions, Grüneisen
parameter, and elasticity for shocked iron between 77 GPa and 400
GPa. Journal of Geophysical Research, 91: 7485–7494.
de Vos, J.C., 1954. A new determination of the emissivity of tungsten
ribbon. Physica, 20: 690–714.
Dubrovinsky, L.S., Saxena, S.K., and Lazor, P., 1998. Stability of
b-phase: a new synchrotron x-ray study of heated iron at high
pressure. European Journal of Mineralogy, 10:43–47.
Fei, Y., Bertka, C.M., and Finger, L.W., 1997. High pressure iron sul-
fur compound, Fe
3
O
2
, and melting relations in the Fe-FeS system.
Science, 275: 1621–1623.
Jeanloz, R., and Kavner, A., 1996. Melting criteria and imaging
spectroradiometry in laser-heated diamond-cell experiments.
Philosophical Transactions of the Royal Society of London, Series
A, 354: 1279–1305.
Jephcoat, A.P., and Besedin, S.P., 1996. Temperature measurement and
melting determination in the laser-heated diamond-anvil cell. Phi-
losophical Transactions of the Royal Society of London, Series A,
354: 1333–1360.
Knittle, E., and Jeanloz, R., 1991. The high pressure phase diagram
of Fe
0.94
O: a possible constituent of the Earth’s core. Journal of
Geophysical Research, 96: 16169–16180.
Kubo, A., Ito, E., Katsura, T., Shinmei, T., Yamada, H., Nishikawa, O.,
Song, M., and Funakoshi, K., 2003. Phase equilibrium study of
iron using sintered diamond (SD) anvils: absence of beta phase.
PEPI, 30: 1126.
Ma, Y.Z., Somayazulu, M., Mao, H.K., Shu, J.F., Hemley, R.J., and
Shen, G., 2004. In situ x-ray diffraction studies of iron to the Earth
core conditions. Physics of the Earth and Planetary Interiors, 144:
455–467.
Mao, H.K., Xu, J., and Bell, P.M., 1986. Calibration of the ruby pres-
sure gauge to 800 kbar under quasi-hydrostatic conditions. Journal
of Geophysical Research, 91: 4673–4676.
Mao, H.K., Bell, P.M., and Hadidiacos, C., 1987. Experimental phase
relations of iron to 360 kbar and 1400 C, determined in an intern-
ally heated diamond anvil apparatus. In Manghnani, M.H., and
Syono, Y. (eds.), High Pressure Research in Mineral Physics.
Tokyo: Terra Scientific Publishing Company/American Geophysi-
cal Union, pp. 135–138.
Nguyen, J.H., and Holmes, N.C., 2004. Melting of iron at the physical
conditions of the Earth’s core. Nature, 427: 339–342.
Ringwood, A.E., and Hibberson, W., 1990. The system Fe-FeO revis-
ited. Physics and Chemistry of Minerals, 17: 313–319.
Saxena, S.K., Shen, G., and Lazor, P., 1994. Temperatures in Earth ’s
core based on melting and phase transformation experiments on
iron. Science, 264: 405–407.
Saxena, S.K., Dubrovinsky, L.S., and Haggkvist, P., 1995. X-ray
evidence for the new phase b-iron at high pressure and high tem-
perature. Geophysical Research Letters, 23: 2441–2444.
Shen, G., Mao, H.K., Hemley, R.J., Duffy, T.S., and Rivers, M.L.,
1998. Melting and crystal structure of iron at high pressures. Geo-
physical Research Letters, 25: 373–376.
Shen, G., Prakapenka, V.B., Rivers, M.L., and Sutton, S.R., 2004.
Structure of liquid iron at pressures up to 58 GPa. Physical Review
Letters, 92: 185701.
Urakawa, S., Kato, M., and Kumazawa, M., 1987. Experimental study
of the phase relation in the system Fe-Ni-O-S up to 15 GPa. In
Manghnani, M.H., and Syono, Y. (eds.), High Pressure Research
in Mineral Physics. Tokyo: Terra Scientific Publish ing Company,
pp. 95–111.
Usselmann, T.M., 1975. Experimental approach to the state of
the core. I. The liquidus relations of the Fe-rich portion of the
Fe-Ni-S system from 30 to 100 kb. American Journal of Science,
275: 278–290.
Williams, Q., Knittle, E., and Jeanloz, R., 1991. The high pressure
melting curve of iron: a technical discussion. Journal of Geophysi-
cal Research, 96: 2171–2184.
Xu, J., Mao, H.K., and Bell, P.M., 1986. High pressure ruby and dia-
mond fluorescence: observations at 0.21 to 0.55 TPa. Science, 232:
1404–1406.
Cross-references
Core Composition
Core Temperature
Grüneisen’s Parameter for Iron and Earth’s Core
Inner Core Composition
Melting Temperature of Iron in The Core, Theory
Shock Wave Experiments
MELTING TEMPERATURE OF IRON IN THE
CORE, THEORY
An accurate knowledge of the melting properties of Fe is particularly
important, as the temperature distribution in the core is relatively
uncertain and a reliable estimate of the melting temperature of Fe at
the pressure of the inner-core boundary (ICB) puts a constraint on core
temperatures. However, there is much controversy over its high pressure
melting behavior (e.g., see Shen and Heinz, 1998). Static compression
measurements of the melting temperature (T
m
) with the diamond anvil
cell (DAC) have been made up to 200 GPa, but even at lower pressures
results for T
m
disagree by several hundred kelvins. Shock experiments
are at present the only available method to determine melting at higher
pressures, but their interpretation is not simple, and there is a scatter of
at least 2000 K in the reported T
m
of Fe at ICB pressures.
Since both quantum mechanics and experiments suggest that Fe
melts from the hexagonal close-packed (hcp) structured phase in the
pressure range immediately above 60 GPa, this entry will focus on
the equilibrium between hcp Fe and liquid phases. Several approaches
for determining T
m
from theory have been adopted, including quantum
mechanically based methods (e.g., Alfè et al., 2002a,b), and more
empirical methods such as dislocation melting models (Poirier and
Shankland, 1993), or those based on thermal physics (Stacey and Irvine,
1977).
The condition for two phases to be in thermal equilibrium at a given
temperature, T, and pressure, P, is that their Gibbs free energies, G(P, T ),
are equal. To determine T
m
at any pressure from theory, it desirable to
692 MELTING TEMPERATURE OF IRON IN THE CORE, THEORY
calculate G for the solid and liquid phases as a function of T and deter-
mine where they are equal. In fact, it is usual to calculate the Helm-
holtz free energy, F(V, T ), as a function of volume, V, and hence
obtain the pressure through the relation P ¼ –(@F/@V )
T
and G through
its definition G ¼ F þ PV.
To obtain melting properties with useful accuracy, free energies
must be calculated with high precision, because the free energy curves
for liquid and solid cross at a shallow angle. It can readily be shown
that to obtain T
m
with a technical precision of 100 K, noncanceling
errors in G must be reduced below 10 meV. It has been shown that
ab initio molecular dynamics can be used to determine the free ener-
gies of liquid and solid of Al and Cu with sufficient accuracy as
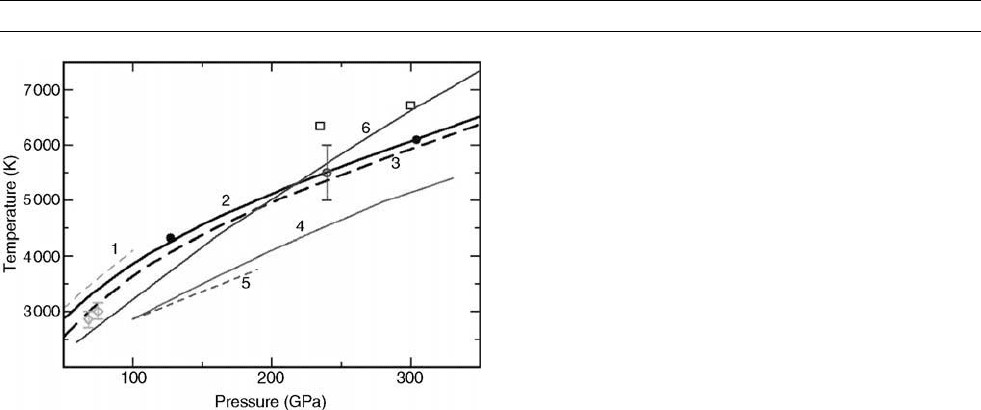
to reproduce the known melting temperature to within 100 K. Alfè
et al. (1999, 2002a) used this method to calculate the melting curve
of Fe up to core pressures, and their results, shown in Figure M188,
give the melting temperature of Fe at ICB pressures to be 6200 K,
with an error of 300 K. For pressures P < 200 GPa (the range cov-
ered by DAC experiments) their curve lies 900 K above the values
of Boehler (1993) and 200 K above the more recent values of Shen
et al. (1998). Their curve falls significantly below the shock-based
estimates for the T
m
of Yoo et al. (1993), in whose experiments tem-
perature was deduced by measuring optical emission (however, the
difficulties of obtaining temperature by this method in shock experi-
ments are well known), but accords almost exactly with the shock data
value of Brown and McQueen (1986) and the new data of Nguyen and
Holmes (1999). For melting at ICB pressure, Alfè et al. (1999, 2002a)
calculate DV
m
/V ¼ 1.8%, DS
m
¼ 1.05R JK
1
mol
1
, and so obtain a
latent heat of fusion of 55 kJmol
1
.
There are other ways of determining the melting temperature of a
system by ab initio methods, including performing simulations that
model coexisting liquid and crystal phases. The melting temperature
of such a system can then be inferred by seeing which of the two
phases grows during the course of a series of simulations at different
temperatures. This approach has been used by Laio et al. (2000) and
by Belonosko et al. (2000) to study the melting of Fe. In their studies
they modeled Fe melting using interatomic potentials fitted to ab initio
surfaces. Alfè et al. (2002b) discovered, however, that these fitted
potentials did not simultaneously describe the energy of the liquid
and crystalline phases with the same precision, and so these simula-
tions do not represent the true melting behavior of Fe, but rather that
of the fitted potential. Alfè et al. (2002b) found a way to correct for
these shortcomings, by calculating the free energy differences between
the model and the ab initio system for both the liquid and solid phases.
This difference in free energy between liquid and solid can then be trans-
formed into an effective temperature correction. When this was done to
Belonosko’s data, there was excellent agreement (see Figure M188)with
previously determined melting curve for Fe determined by Alfè et al.
(2002a) using the technique based on direct determination of free energies.
Other more approximate theoretical approaches are also in accord
with the inferences from more accur ate quantum mechanical studies.
Poirier and Shankland (1993) obtained a value of T
m
for Fe at 330
GPa of 6100 100 K by using a dislocation melting model, Stacey
and Irvine (1977) estimated T
m
¼ 6 050 K from a Lindemann’s law-
based analysis, Stixrude et al. (1997) estimated T
m
to be 6150 K,
and Anderson (2003) found a T
m
of 5900 300 K on the basis of
thermodynamic analysis. Thus with ab initio calculations having been
shown to be robust, there now seems to be an emerging consensus on
the melting temperature Fe at ICB pressure to be between 6 000 and
6400 K. There is still scope for further work on the difficult problem
of the modeling of melting, but for the high pressure melting of Fe
at least, it now appears that there may be as many problems with
reconciling divergent experimental data than there are in obtaining
accurate predictions of T
m
from ab initio studies.
David Price
Bibliography
Alfè, D., Gillan, M.J., and Price, G.D., 1999. The melting curve of
iron at the pressures of the Earth’s core from ab initio calculations.
Nature, 401: 462–464.
Alfè, D., Price, G.D., and Gillan, M.J., 2002a. Iron under Earth’s
core conditions: liquid-state thermodynamics and high-pressure
melting curve from ab initio calculations. Physics Review, B65:
165118, 1–11.
Alfè, D., Gillan, M.J., and Price, G.D., 2002b. Complementary
approaches to the ab initio calculation of melting properties. Jour-
nal of Chemical Physics, 116: 6170–6177.
Anderson, O.L., 2003. The three-dimensional phase diagram of iron.
In Dehant, V., Creager, K.C., Karato, S-I., and Zatman, S. (eds.),
Earth’s Core. AGU, Geodynamics Series, 31:83–104.
Belonosko, A.B., Ahuja, R., and Johansson, B., 2000. Quasi-ab initio
molecular dynamic study of Fe melting. Physics Review Letters,
84: 3638–3641.
Boehler, R., 1993. Temperature in the Earth’s core from the melting point
measurements of iron at high static pressures. Nature, 363:534–536.
Brown, J.M., and McQueen, R.G., 1986. Phase transitions, Grüneisen
parameter and elasticity for shocked iron between 77 GPa and
400 GPa. Journal of Geophysical Research, 91: 7485–7494.
Laio, A., Bernard, S., Chiarotti, G.L., Scandolo, S., and Tosatti, E., 2000.
Physics of iron at Earth’s core conditions. Science, 287: 1027–1030.
Nguyen, J.H., and Holmes, N.C., 1999. Iron sound velocities in shock
wave experiments. In Furnish, M.D., Chhabildas, L.C., and
Hixson, R.S. (eds.) Shock Compression of Condensed Matter—
1999. Melville, NY: American Institute of Physics, pp. 81–84.
Poirier, J.P., and Shankland, T.J., 1993. Dislocation melting of iron and
the temperature of the inner-core boundary, revisited. Geophysical
Journal International, 115: 147–151.
Shen, G.Y., and Heinze, D.L., 1998. High pressure melting of deep
mantle and core materials. In Hemley, R.J. (ed.), Ultrahigh-pressure
Mineralogy. Reviews in Mineralogy, 37
:369–398.
Stacey, F.D., and Irvine, R.D., 1977. Theory of melting: the thermo-
dynamic basis of Lindemann’s Law. Australian Journals of
Physics, 30: 631–640.
Figure M188 The calculated high pressure melting curve of
Fe of Alfe
`
et al. (line 2) passes through the shock wave datum
(open circle) of Brown and McQueen. Other data shown includes:
The melting curve of Alfe
`
et al., corrected for the GGA pressure
error (line 3), Belonoshko’s melting curve (line 6), Belonoshko’s
melting data corrected for errors in potential fitting (black dots),
Laio et al.’s melting curve (line 4), Boehler’s DAC curve (line 5),
Shen’s data (diamonds), Yoo’s shock data (open squares),
William’s melting curve (line 1).
MELTING TEMPERATURE OF IRON IN THE CORE, THEORY 693
Stixrude, L., Wasserman, E., and Cohen, R.E., 1997. Composition and
temperature of the Earth’s inner core. Journal of Geophysical
Research, 102: 24729–24739.
Williams, Q., Jeanloz, R., Bass, J., Svendsen, B., and Ahrens, T.J.,
1987. The melting curve of iron to 250 GPa—a constraint on the
temperature at Earth’s center. Science, 236: 181–182.
Yoo, C.S., Holmes, N.C., Ross, M., Webb, D.J., and Pike, C., 1993.
Shock temperatures and melting of iron at Earth core conditions.
Physics Review Letters, 70: 3931–3934.
Cross-references
Core Properties, Physical
Core Properties, Theoretical Determination
Core Temperature
Core, Adiabatic Gradient
Inner Core
Melting Temperature of Iron in the Core, Experimental
Shock Wave Experiments
MICROWAVE PALEOMAGNETIC TECHNIQUE
The microwave technique is used to determine the strength of the
Earth’s magnetic field in the past. It is usually applied to igneous rock
such as lava and dike or the surrounding material that has been heated
by them (baked contact), as well as heated archaeological material
(ceramics, fireplaces, etc.). Samples are placed inside a resonant cavity
and exposed to microwaves for a few seconds (typically 10 s). The
microwave exposure is directly analogous to raising the temperature
of the sample in the conventional Thellier technique, the main differ-
ence being that when the sample is exposed to microwaves most of
the energy is absorbed by the magnetic system whereas in direct heat-
ing the entire sample absorbs energy.
By concentrating the energy in the magnetic system the bulk sample
is not heated significantly. This reduces the probability of laboratory
thermal alteration and provides a more accurate determination of the
ancient magnetic field strength.
Microwaves magnons and temperature
A simple model for ferromagnetic minerals is a large number of spin-
ning electrons, one for each ion. Each spin has a magnetic moment
M ¼ gm
b
S, where g is the spectroscopic splitting factor, m
b
is the
Bohr magnetron, and S is the spin (Kittel, 1966).
In a ferromagnetic mineral there is a very strong force between
neighboring spinning electrons that tries to align all of the spins
(exchange coupling). At very low temperatures when the thermal energy
is near to zero the spins align and the total magnetization of the mineral
is greatest. This total magnetization is expressed as a strong internal field
in the mineral. As the temperature increases the energy increases and
the individual spin magnetic moments move away from perfect align-
ment. As the spin magnetic moments move away from perfect alignment
they precess around the internal field of the mineral so that only a com-
ponent (M
z
) remains aligned and the total magnetization of the mineral
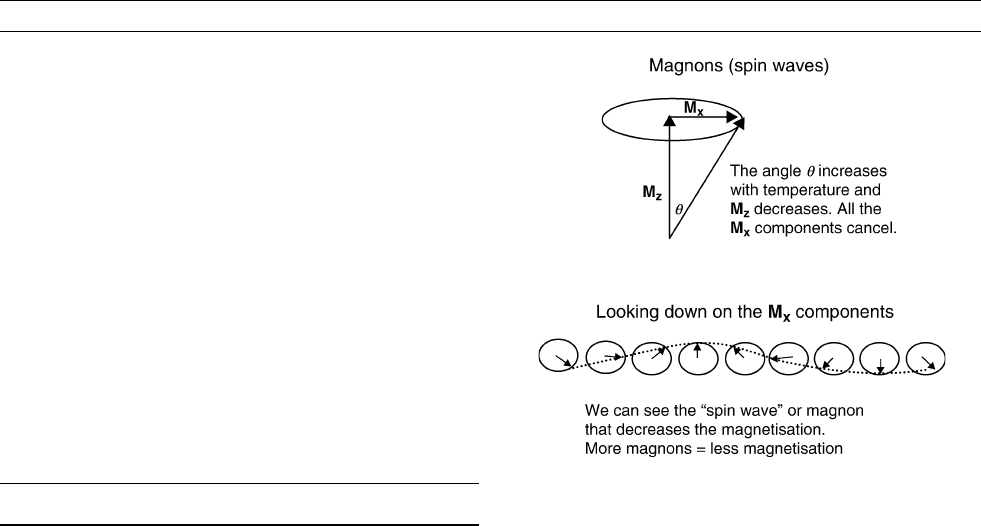
reduces (Figure M189).
All of the spins precess at the same frequency (H where is the gyro-
magnetic ratio and H is the magnetic field) but each is slightly out of
phase with its neighbor. Looking along the field direction (M
z
direc-
tion) the M
x
components form a “spin wave” that passes through the
mineral (Figure M189). The amplitude of the spin wave increases in
quantized jumps equivalent to the complete reversal of one spin mag-
netic moment and so the total magnetization of the mineral changes by
2M. A spin wave that is quantized in this way is called a magnon. For
each magnon that is excited the magnetic moment reduces by 2M.
This is a simplified picture of spin wave generation in ferromagnetic
minerals but it helps us to understand how the magnetic moment of
a sample is reduced by the generation of magnons.
In the case of conventional thermal demagnetization, ferromagnetic
magnetization decreases with increasing temperature until it is comple-
tely removed at the Curie temperature. Looking at this process in more
detail, the external thermal energy (the high temperature in an oven,
say) generates phonons (lattice vibrations) in order to equilibrate the
external energy with the internal energy. The phonons in turn generate
magnons in the magnetic system in order to equilibrate the energy in
the magnetic system. When sufficient magnons are generated the sam-
ple is demagnetized and the equivalent external temperature that
caused this is called the Curie temperature.
Using microwaves it is possible to excite the magnons directly by
ferromagnetic resonance without applying heat to the sample (Walton
et al., 1992, 1993). If this can be done quickly the high-energy mag-
netic system will not have time to pass energy into the sample, gener-
ate phonons and raise its temperature. In theory microwaves can
demagnetize a sample in the same way as heating a sample but without
raising its temperature. In practice it takes a few seconds of microwave
exposure to generate sufficient magnons to completely demagnetize a
sample, the normal exposure time is 10 s and this means that some
phonons are generated. Also, since most samples are good insulators,
there is some dielectric heating of the sample in the microwave field.
The combination of these two effects is to raise the temperature of
the sample slightly, usually less than 150
C (Hill et al., 2000).
Dielectric heating is frequency-dependent, the higher the frequency
the more heat is generated. Magnon generation is also frequency-
dependent, higher frequency generates more magnons. The sample
size is also frequency-dependent, higher frequency means a smaller
resonant cavity and therefore smaller samples. Experiments at 8
and 14 GHz show clearly that at 14 GHz samples are more easily
demagnetized and are heated less than at 8 GHz. Much above
14 GHz dielectric heating becomes dominant and the samples are
heated more. For microwave demagnetization without heating the
14–16 GHz range seems optimal (Figure M190).
Recent experiments demonstrate that high (low) microwave power
is equivalent to high (low) temperature (Hill et al., 2002) and
so microwave demagnetization may be used instead of thermal
Figure M189 Magnons.
694 MICROWAVE PALEOMAGNETIC TECHNIQUE
demagnetization to determine paleomagnetic directions. Microwave
demagnetization has the added advantage that it can be used on sam-
ples that undergo severe alteration on heating and are unsuitable for
thermal analysis (i.e., sulfide-bearing rocks).
John Shaw
Bibliography
Hill, M.J., and Shaw, J., 2000. Magnetic field intensity study of the
1960 Kilauea lava flow, Hawaii, using the microwave palaeointen-
sity technique. Geophysical Journal International, 142: 487–504.
Hill, M.J., Gratton, M.N., and Shaw, J., 2002. A comparison of thermal
and microwave palaeomagnetic techniques using lava containing
laboratory induced remanence. Geophysical Journal International,
151: 157–163.
Walton, D., Shaw, J., Share, J.A., and Hakes, J., 1992. Microwave
demagnetisation. Journal of Applied Physics, 71: 1549–1551.
Walton, D., Share, J.A., Rolph, T.C., and Shaw, J., 1993. Microwave
magnetisation. Geophysical Research Letters, 20: 109–111.
Cross-references
Demagnetization
Depth to Curie temperature
Magnetization, Thermoremanent (TRM)
Paleointensity
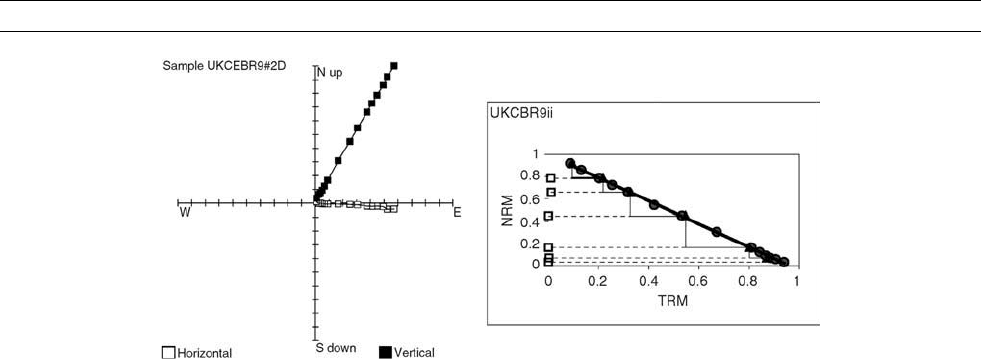
Figure M190 Orthogonal 18 GHz microwave demagnetization plot (left) and 18 GHz microwave Thellier paleointensity plot with
PTRM checks and multidomain tail checks (right). The maximum microwave power used was 40 W for 10 s. H
pal
¼ 51.9 0.4 mT,
q ¼ 140.4.
MICROWAVE PALEOMAGNETIC TECHNIQUE 695