Harris C.M., Piersol A.G. Harris Shock and vibration handbook
Подождите немного. Документ загружается.

VIBRATION MEASUREMENT INSTRUMENTATION 13.15
–f
c
(A)
f
c
–f
s/2
f
c
f
s
–f
s
(B)
(C)
f
c
f
s
f
s/2
f
s/2
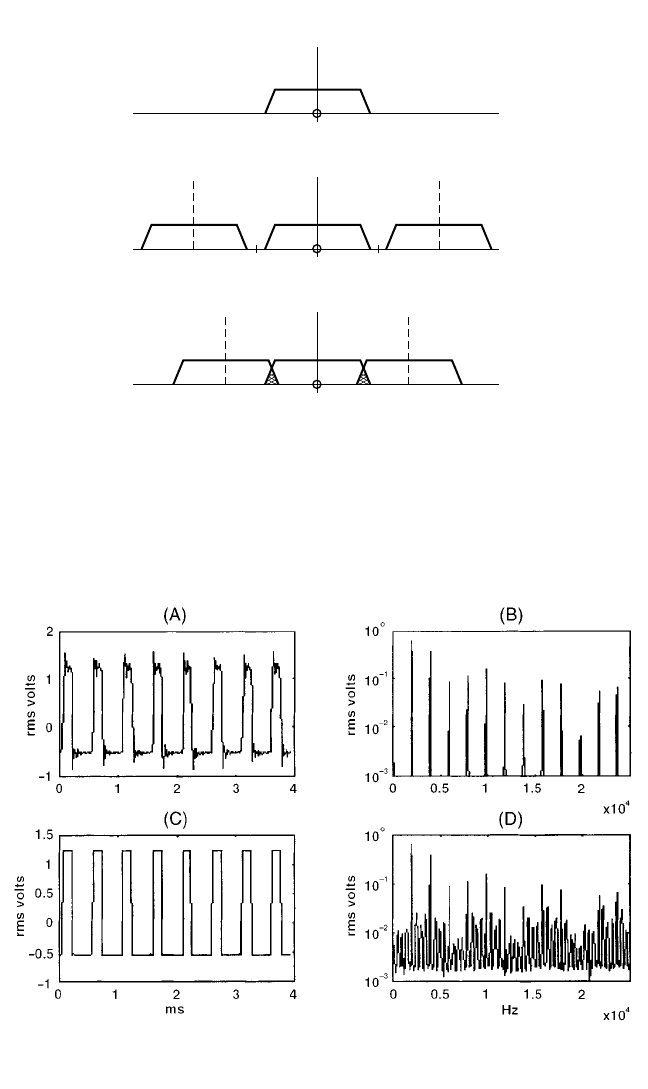
FIGURE 13.10 (A) Spectrum of a continuous band-
limited signal with maximum frequency f
c
.(B) Spectrum of
digitized signal with sampling frequency f
s
> 2f
c
.(C) Spec-
trum of digitized signal with sampling frequency f
s
< 2f
c
; the
hatched area indicates aliased components.
FIGURE 13.11 Effect time signals and spectra of antialiasing filters. (A) Time signal with filter.
(B) Spectrum with filter. (C) Time signal without filter. (D) Spectrum without filter.
8434_Harris_13_b.qxd 09/20/2001 11:14 AM Page 13.15
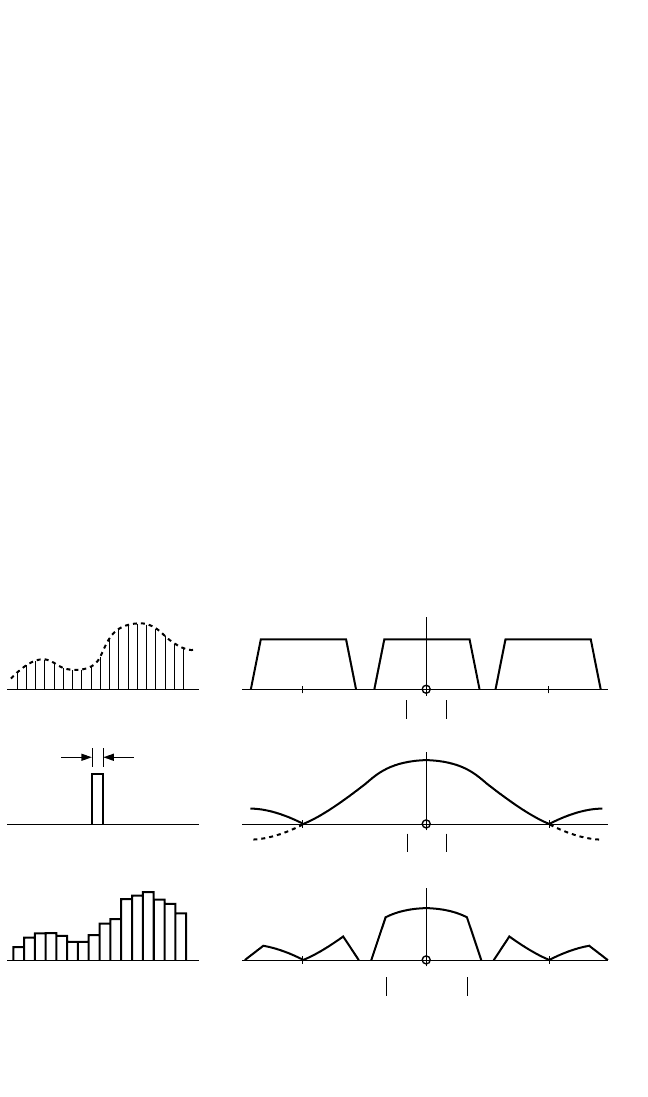
each level section. These can be interpreted either as the step-response of the low-
pass filters or as the removal of the high-frequency components (the so-called Gibbs
phenomenon). In Fig. 13.11C and D, no antialiasing filter has been used, and even
though the waveform appears more like a square wave, the spectrum is now incor-
rect and contains aliasing components. This leads to the conclusion that where the
sole purpose is to evaluate digitized waveforms, an antialiasing filter is not desirable,
but where any treatment of the digitized signal is carried out (such as frequency
analysis, digital filtering, or reconstruction of a signal by use of a D/A converter),
antialiasing filters are absolutely necessary.
DIGITAL-TO-ANALOG CONVERSION
It is evident from Fig. 13.10 that in removing high-frequency components of the peri-
odic spectrum of a sampled function, the low-pass filters which are used should be of
the same quality as the original antialiasing filter prior to digitization. Furthermore,
a D/A converter cannot produce true unit impulses, and it is usual that the converted
voltage corresponding to each sample is carried over as a constant value in the sam-
ple interval.This is the equivalent of a convolution with a rectangular pulse of length
∆t (equal to 1/f
s
), so that the spectrum is multiplied by a (sin x)/x function with its
first zero at f
s
, as illustrated in Fig. 13.12.The gain factor at 0.50 f
s
is 2/π (−3.9 dB), and
at 0.39 f
s
(the normal range of an FFT spectrum) it is −2.3 dB. The effect of this fac-
tor, and the need for a very steep low-pass filter, can be reduced considerably by
increasing the sampling rate (by digital interpolation) before D/A conversion, and
this is commonly done where sufficiently fast hardware is available.
13.16 CHAPTER THIRTEEN
–f
c
g
1
(t)
g
2
(t)
G
1
(f)
∆t = 1/f
s
AMPLITUDE SPECTRATIME SIGNALS
f
c
f
s
–f
s
• • •• • •
(A)
(B)
(C)
G
2
(f)
f
s
–f
s
g
1
(t)
*
g
2
(t)
G
1
(f), G
2
(f)
f
s
–f
s
–f
c
f
c
FIGURE 13.12 D/A conversion with constant voltage between samples. (A) Digitized time sig-
nal and its amplitude spectrum. (B) Rectangular pulse length ∆t (equal to 1/f
s
) and its amplitude
spectrum. (C) Convolution of (A) and (B) and the resulting amplitude spectrum.
8434_Harris_13_b.qxd 09/20/2001 11:14 AM Page 13.16

DIGITAL PROCESSING
Once the signal has been obtained in digital form using proper antialiasing filters,
many of the operations (described above and in Chaps. 14 and 27) can be carried out
digitally.
3
For example, acceleration signals can be integrated to obtain velocity using
numerical integration directly in the time domain or if so desired, jω operations in
the frequency domain (where it can be combined with bandpass filtering). Each
integration corresponds to a division by jω of the Fourier spectrum (this applies only
to ac-coupled signals).
REFERENCES
1. Wahrman, C. G.: Brüel & Kjaer Tech. Rev., (3) (1958).
2. Dyer, D., and R. M. Stewart: J. Mech. Des., 100:229 (1978).
3. Oppenheim,A.V., and R.W. Schafer:“Discrete Time Signal Processing,” Prentice-Hall, Inc.,
Englewood Cliffs, N.J., 1989.
4. Ho, D., and R. B. Randall: Mechanical Systems and Signal Processing, 14(5):763–788 (2000).
VIBRATION MEASUREMENT INSTRUMENTATION 13.17
8434_Harris_13_b.qxd 09/20/2001 11:14 AM Page 13.17

CHAPTER 14
VIBRATION ANALYZERS
AND THEIR USE
Robert B. Randall
INTRODUCTION
This chapter deals primarily with frequency analysis, but a number of related analy-
sis techniques—namely, synchronous averaging, cepstrum analysis, and Hilbert
transform techniques—are considered.
With the increase in availability of signal processing packages, virtually all of the
techniques discussed, and a large number of others, can now be directly pro-
grammed by the user on a general purpose computer (see Chap. 27), but dedicated
analyzers still have a number of advantages, as follows:
●
Dedicated hardware for preprocessing signals before they are actually stored in
the analyzer’s memory. This includes real-time zoom with decimation to a lower
sampling frequency (vastly reducing the amount of data to be stored), real-time
digital resampling for order analysis, and even something as trivial as real-time
triggering. If the data only has to be processed after the occurrence of some event
that can be used as a trigger, the latter can avoid the storage and postprocessing of
vast amounts of useless data.
●
Fractional octave digital filter analyzers decimate the sampling frequency of low-
frequency signal components as part of their operation. If the equivalent analysis
over three frequency decades were to be carried out by postprocessing of an already
digitized signal, approximately one million samples would be required to obtain a
single one-twelfth-octave spectrum with sufficient averaging for a random signal.
●
Dedicated analyzers are more likely to provide error-free results in terms of cor-
rect scaling as rms spectra, power spectra, power spectral density, or energy spec-
tral density, while compensating for the data windows used. They also often
indicate if insufficient averaging has been used for random signals, etc.
Most frequency analysis is now done digitally, using the FFT (fast Fourier trans-
form) for constant bandwidth analysis on a linear frequency scale, and recursive dig-
ital filters for constant percentage bandwidth (fractional octave) analysis on a
logarithmic frequency scale; since the latter behave essentially in the same way as
analog filters, the chapter starts with a general discussion of filters and their use for
14.1
8434_Harris_14_b.qxd 09/20/2001 11:11 AM Page 14.1

frequency analysis, and later covers FFT analysis.Although spectrum analysis can be
done in other ways, such as autoregressive (AR) analysis, moving average (MA)
analysis, and their combination (ARMA analysis), these methods are not yet incor-
porated in spectrum analyzers, and so have not been treated in this chapter.
ELECTRICAL FILTERS
An ideal bandpass filter is a circuit which transmits that part of the input signal
within its passband and completely attenuates components at all other frequencies.
Practical filters differ slightly from the ideal, as discussed below. An analysis may be
performed over a frequency range either by using a single filter with a tunable cen-
ter frequency which is swept over the entire frequency range or by using banks of
fixed filters having contiguous (or overlapping) passbands.
For general vibration analysis it used to be common to use tunable filters whose
center frequency was either tuned by hand or synchronized with the X position of
the pen on a graphic recorder so that the spectrum was plotted automatically by
sweeping the center frequency over the desired frequency range. Alternatively, the
center frequency could be synchronized with an external signal, e.g., a trigger pulse
once per revolution of a shaft, in which case the filter became a tracking filter which
could be used to filter out the component corresponding to a designated harmonic,
or multiple, of the synchronizing signal.
In the past, banks of filters with fixed center frequencies, each with its own detec-
tor, were widely used for parallel analysis of all frequency bands in real time. This
arrangement is costly, however, and has largely been superseded by digital filter ana-
lyzers (described in the following section). If real-time analysis is not required, a
less-expensive alternative is to switch the output of each filter in turn to a single
detector and record the outputs sequentially on paper or on a display.The individual
filters can then also share many components, which are selected in appropriate com-
binations by the switching process. Sequentially stepped fixed filters are typically
used for relatively broad-band analysis and are rarely used with less than one-third-
octave bandwidth. This type of analysis finds most application in acoustics and in
studies of the effects of vibration on humans (Chap. 42).
Digital Filters. Digital filters (in particular, recursive digital filters) are devices
which process a continuous digitized signal and provide another signal as an output
which is filtered in some way with respect to the original. The relationship between
the output and input samples can be expressed as a difference equation (in general,
involving previous output and input values) with properties similar to those of a dif-
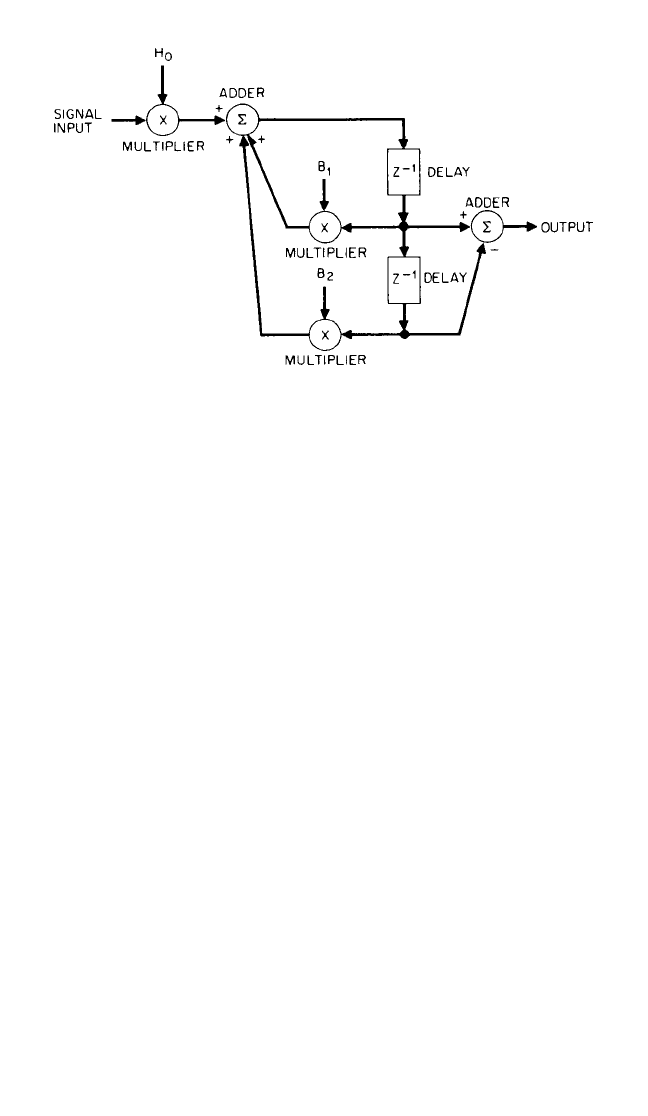
ferential equation which might describe an analog filter. Figure 14.1 shows a typical
two-pole section used in a one-third-octave digital filter analyzer (three of these are
cascaded to give six-pole filtration).
Two ways of changing the properties of a given digital filter circuit such as that
shown in Fig. 14.1 are:
1. For a given sampling frequency, the characteristics can be changed by changing
the coefficients of the difference equation. (In the circuit of Fig. 14.1 there are
three, effectively defining the resonance frequency, damping, and scaling.)
2. For given coefficients, the filter characteristic is defined only with respect to the
sampling frequency. Thus, halving the sampling frequency will halve the cutoff
frequencies, center frequencies, and bandwidths; consequently, the constant-
14.2 CHAPTER FOURTEEN
8434_Harris_14_b.qxd 09/20/2001 11:11 AM Page 14.2
percentage characteristics are maintained one octave lower in frequency. For this
reason, digital filters are well adapted to constant-percentage bandwidth analysis
on a logarithmic (i.e., octave-based) frequency scale.
Thus, the 3 one-third-octave characteristics within each octave are generated by
changing coefficients, while the various octaves are covered by repetitively halving
the sampling frequency. Every time the sampling frequency is halved, it means that
only half the number of samples must be processed in a given time; the total num-
ber of samples for all octaves lower than the highest is (
1
⁄2 +
1
⁄4 +
1
⁄8 + ⋅⋅⋅), which in the
limit is the same as the number in the highest octave. By being able to calculate
twice as fast as is necessary for the upper octave alone, it is possible to cover any
number of lower octaves in real time. This is the other reason why digital filters are
so well adapted to real-time constant-percentage bandwidth analysis over a wide
frequency range.
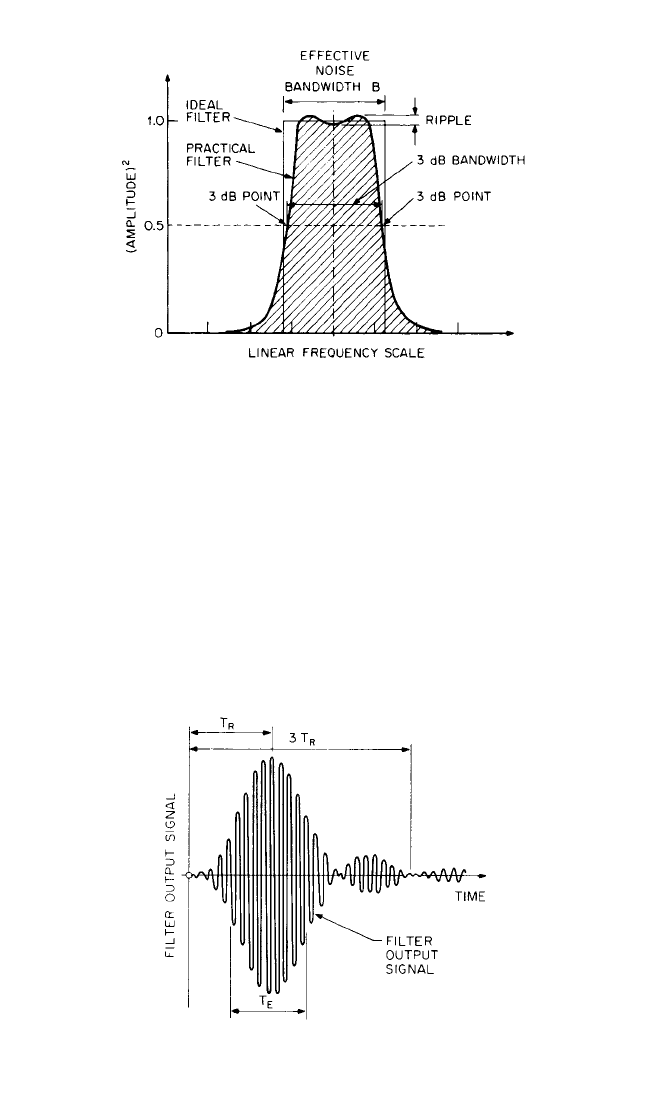
Filter Properties. Figure 14.2 illustrates what is meant by the 3-dB bandwidth and
the effective noise bandwidth, the first being most relevant when separating discrete
frequencies, and the second when dealing with random signals. For filters having
good selectivity (i.e., having steep filter flanks), there is not a great difference
between the two values, and so in the following discussion no distinction is made
between them.
The response time T
R
of a filter of bandwidth B is on the order of 1/B, as illus-
trated in Fig. 14.3, and thus the delay introduced by the filter is also on this order.
This relationship can be expressed in the form
BT
R
≈ 1 (14.1)
which is most applicable to constant-bandwidth filters, or in the form
bn
r
≈ 1 (14.2)
VIBRATION ANALYZERS AND THEIR USE 14.3
FIGURE 14.1 Block diagram of a typical two-pole digital filter section, consisting
of multipliers, adders, and delay units. H
0
, B
1
, and B
2
are constants by which the
appropriate signal sample is multiplied. Z
−1
indicates a delay of one sample interval
before the following operation.
8434_Harris_14_b.qxd 09/20/2001 11:11 AM Page 14.3
where b = B/f
0
= relative bandwidth
n
r
= f
0
T
R
= number of periods of frequency f
0
in time T
R
f
0
= center frequency of filter
This form is more applicable to constant-percentage bandwidth filters. Thus, the
response time of a 10-Hz bandwidth filter is approximately 100 milliseconds, while
the response time of a 1 percent bandwidth filter is approximately 100 periods. Fig-
ure 14.3 also illustrates that the effective length of the impulse T
E
is also approxi-
mately 1/B, while to integrate all of the energy contained in the filter impulse
response it is necessary to integrate over at least 3T
R
.
14.4 CHAPTER FOURTEEN
FIGURE 14.3 Typical filter impulse response.
T
R
= filter-response time (≈1/B); T
E
= effective
duration of the impulse (≈1/B); B = bandwidth.
FIGURE 14.2 Bandwidth definitions for a practical filter
characteristic. The 3-dB bandwidth is the width at the 3-dB
(half-power) points. The effective noise bandwidth is the width
of an ideal filter with the same area as the (hatched) area under
the practical filter characteristic on an amplitude squared
(power) scale.
8434_Harris_14_b.qxd 09/20/2001 11:11 AM Page 14.4
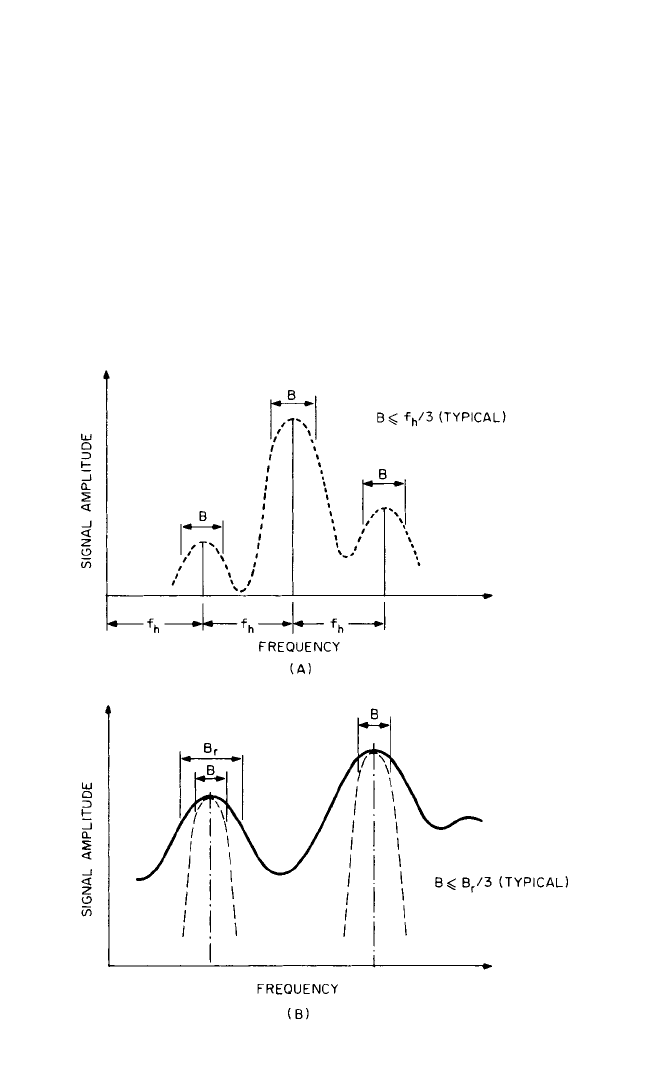
Choice of Bandwidth and Frequency Scale. In general it is found that analysis
time is governed by expressions of the type BT ≥ K, where K is a constant [see, for
example, Eq. (14.1)] and T is the time required for each measurement with band-
width B. Thus, it is important to choose the maximum bandwidth which is consistent
with obtaining an adequate resolution, because not only is the analysis time per
bandwidth proportional to 1/B but so is the number of bandwidths required to cover
a given frequency range—a squared effect.
It is difficult to give precise rules for the selection of filter bandwidth, but the fol-
lowing discussion provides some general guidelines: For stationary deterministic
and, in particular, periodic signals containing equally spaced discrete frequency
components, the aim is to separate adjacent components; this can best be done using
a constant bandwidth on a linear frequency scale. The bandwidth should, for exam-
ple, be chosen as one-fifth to one-third of the minimum expected spacing (e.g., the
lowest shaft speed, or its half-order if this is to be expected) (see Fig. 14.4A). For sta-
VIBRATION ANALYZERS AND THEIR USE 14.5
FIGURE 14.4 Choice of filter bandwidth B for different types of signals.
(A) Discrete frequency signals—harmonic spacing f
h
.(B) Stationary ran-
dom and impulsive signals.
8434_Harris_14_b.qxd 09/20/2001 11:11 AM Page 14.5

tionary random or transient signals, the shape of the spectrum will most likely be
determined by resonances in the transmission path between the source and the
pickup, and the bandwidth B should be chosen so that it is about one-third of the
bandwidth B
r
of the narrowest resonance peak (Fig. 14.4B). For constant damping
these tend to have a constant Q or constant-percentage bandwidth character, and
thus constant-percentage bandwidth on a logarithmic frequency scale often is most
appropriate.
A linear frequency scale is normally used together with a constant bandwidth,
while a logarithmic frequency scale is normally used together with a constant-
percentage bandwidth, as each combination gives uniform resolution along the
scale. A logarithmic scale may be selected in order to cover a wide frequency range,
and then a constant-percentage bandwidth is virtually obligatory. A logarithmic fre-
quency scale may, however, occasionally be chosen in conjunction with a constant
bandwidth (though over a limited frequency range) in order to demonstrate a rela-
tionship which is linear on log-log scales (e.g., conversions between acceleration,
velocity, and displacement).
Choice of Amplitude Scale. Externally measured vibrations, on a machine casing
for example, are almost always the result of internal forces acting on a structure whose
frequency response function modifies the result. Because the structural response func-
tions vary over a very wide dynamic range, it is almost always an advantage to depict
the vibration spectra on a logarithmic amplitude axis. This applies particularly when
the vibration measurements are used as an indicator of machine condition (and thus,
internal forces and stresses) since the largest vibration components by no means nec-
essarily represent the largest stresses. Even where the vibration is of direct interest
itself, in vibration measurements on humans, the amplitude axis should be logarithmic
because this is the way the body perceives the vibration level.
It is a matter of personal choice (though sometimes dictated by standards)
whether the logarithmic axes are scaled directly in linear units or in logarithmic units
expressed in decibels (dB) relative to a reference value. Another aspect to be con-
sidered is dynamic range. The signal from an accelerometer (plus preamplifier) can
very easily have a valid dynamic range of 120 dB (and more than 60 dB over three
frequency decades when integrated to velocity). The only way to utilize this wide
range of information is on a logarithmic amplitude axis. Figure 14.5 illustrates both
these considerations; it shows spectra measured at two different points on the same
gearbox (and representing the same internal condition) on both logarithmic and lin-
ear amplitude axes.The logarithmic representations of the two spectra are quite sim-
ilar, while the linear representations are not only different but hide a number of
components which could be important.
An exception where a linear amplitude scale usually is preferable to a logarith-
mic scale is in the analysis of relative displacement signals, measured using proxim-
ity probes, for the following reasons: (1) The parameter being measured is directly of
interest for comparison with the results of rotor dynamic and bearing hydrodynamic
calculations. (2) The dynamic range achievable with relative shaft vibration meas-
urements (as limited by mechanical and electrical runout) does not justify or neces-
sitate depiction on a logarithmic axis.
Analysis Speed. There are three basic elements in a filter analyzer which can give
rise to significant delays and thus influence the speed of analysis.
The filter introduces a delay on the same order as its response time T
R
(see Fig.
14.3). This is most likely to dominate in the analysis of stationary deterministic sig-
nals, where the filter contains only one discrete frequency component at a time and
only a short averaging time is required.
14.6 CHAPTER FOURTEEN
8434_Harris_14_b.qxd 09/20/2001 11:11 AM Page 14.6
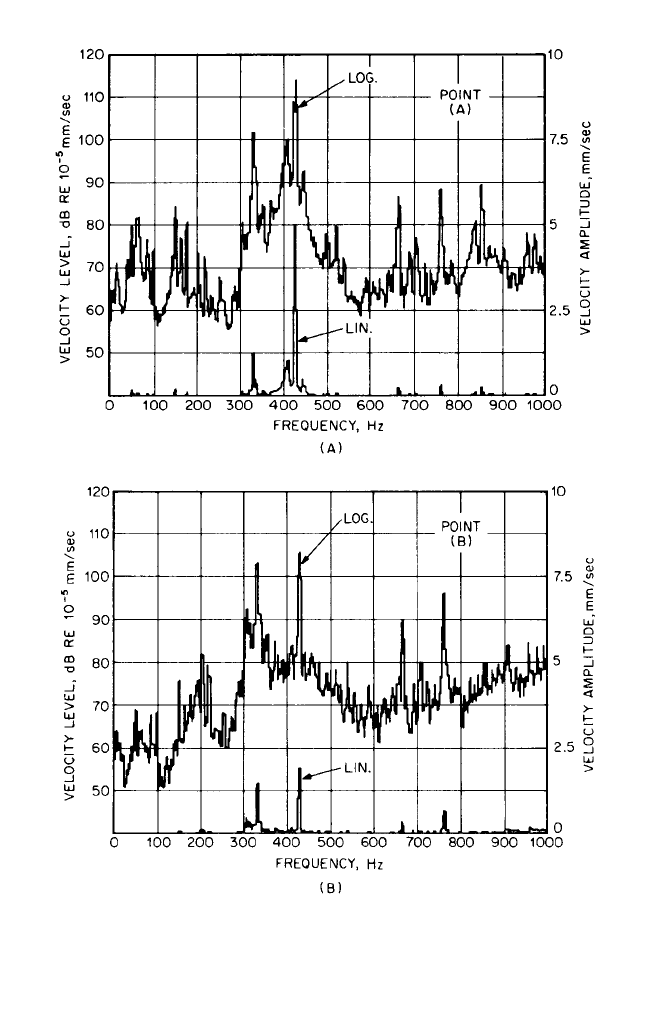
VIBRATION ANALYZERS AND THEIR USE 14.7
FIGURE 14.5 Comparison of rms logarithmic and rms linear amplitude scales for
the depiction of vibration velocity spectra from two measurement points [(A) and
(B)] on the same gearbox (thus representing the same internal condition). The log-
arithmic representations in terms of velocity level are similar and show all com-
ponents of interest. The linear spectra in terms of velocity amplitude are quite
different, and both hide many components which could be important.
8434_Harris_14_b.qxd 09/20/2001 11:11 AM Page 14.7