Harris C.M., Piersol A.G. Harris Shock and vibration handbook
Подождите немного. Документ загружается.

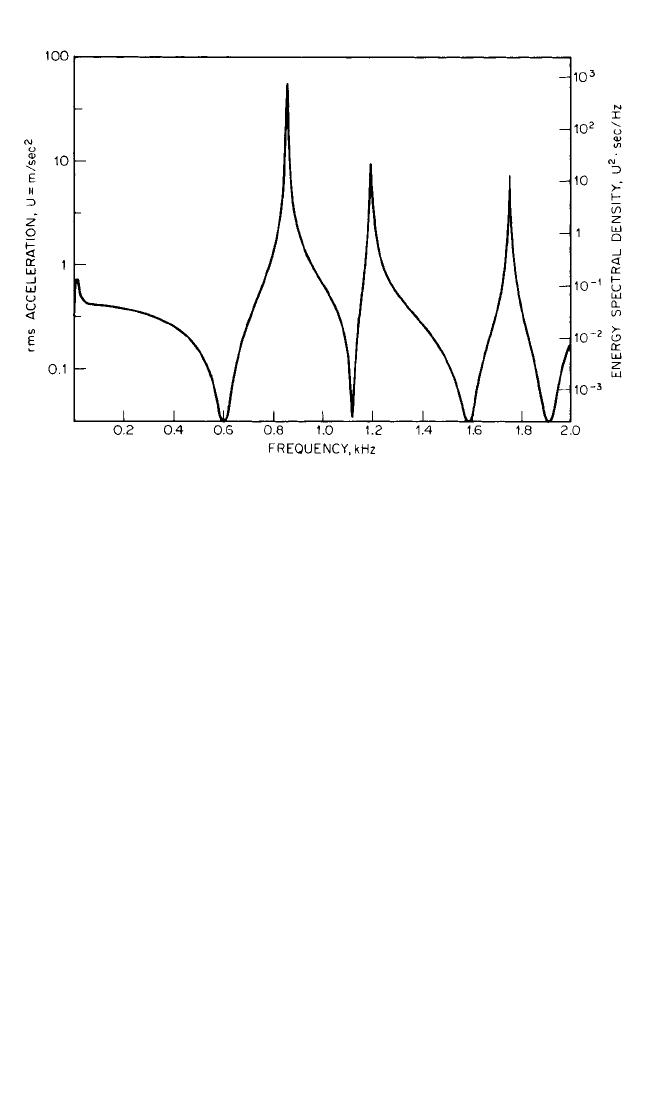
FIGURE 14.24 Analysis of a long transient by scan averaging (same signal as Fig. 14.22).
The energy spectral density (ESD) scaling on the right can be compared with that in Fig.14.22,
although the peaks are not valid because of insufficient resolution.
level of peaks does not differ by this amount; this confirms that their resolution is
not sufficient to allow scaling in terms of energy spectral density.
To obtain Fig. 14.24, scan averaging with a step length of T/4 was used (an over-
lap of successive records of 75 percent). Even though a step length of T/3 (overlap of
66.7 percent) is theoretically more efficient, T/4 is usually more convenient because
the number of samples in T generally is a power of 2.
ANALYSIS OF NONSTATIONARY SIGNALS
A typical nonstationary signal results from measurements made during a machine
run-up or coast-down (here, the primary cause of the nonstationary signal is a change
in shaft speed). The signal can be analyzed by dividing it up into a series of short
quasi-stationary time periods (often overlapping), in each of which the speed is
roughly constant. The length of the time window used to select a portion of the con-
tinuous signal may have to be chosen so as to ensure this.The simplest way to analyze
a nonstationary signal of this type is to use a tracking filter tuned to a specific har-
monic of shaft speed and to record the results vs. rpm of the machine. If a phase meter
is inserted between the filtered signal and the tracking signal, it is possible to record
phase as well as amplitude against rpm to give what is called a Bode plot.
8
Using an FFT analyzer, the behavior of several harmonics may be studied simul-
taneously. One way to do this, using an FFT analyzer having a long memory, is with
a simple scan analysis; a short Hanning window is scanned through the record (as for
a scan average), and successive instantaneous spectra (from each window position)
are viewed on the display screen. The speed of the scan may be changed by varying
the step length; this is one situation (in contrast to scan averaging) where very short
14.28 CHAPTER FOURTEEN
8434_Harris_14_b.qxd 09/20/2001 11:12 AM Page 14.28
step lengths may be of advantage, for example, in slowing down the passage through
a resonance.
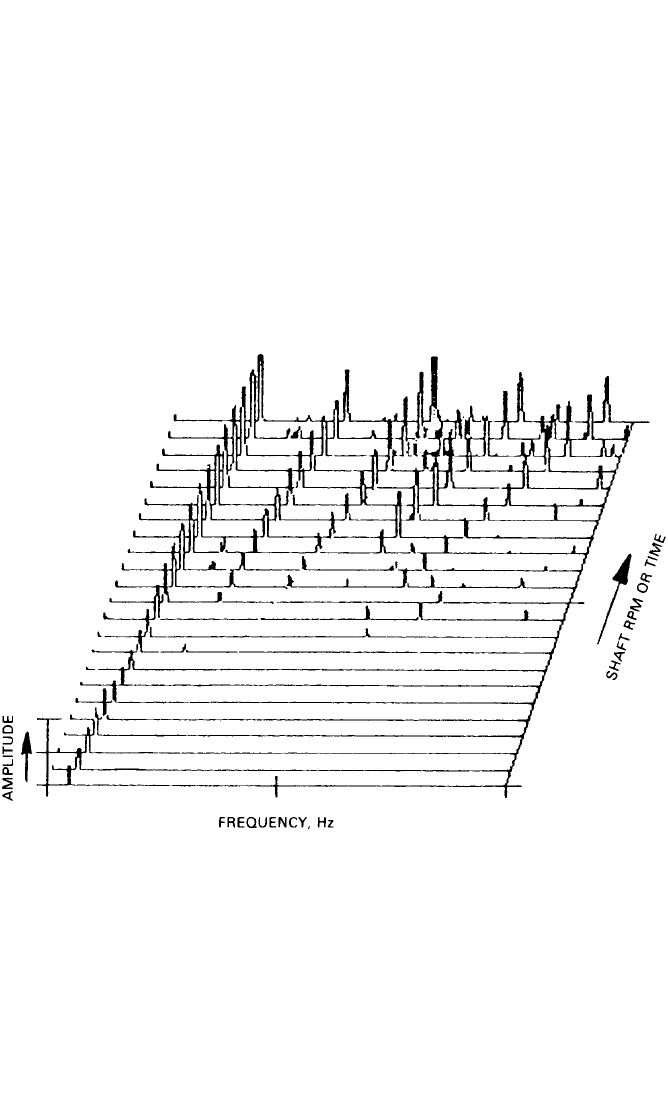
A highly effective method of representing such a scan analysis is by a “water-
fall,” or “cascade,” plot as shown in Fig. 14.25 (which represents a typical machine
run-up). As indicated, the third dimension of such a three-dimensional plot can be
either time or rpm; for a simple scan analysis it usually is time, but if the spectra are
spaced at equal intervals of rpm, a number of advantages result. Harmonically
related components (whose bases follow radial lines) then can be separated easily
from constant-frequency components (e.g., related to line frequency or resonances)
whose bases follow lines parallel with the rpm axis. Such a cascade plot, with rpm as
the third axis, is sometimes referred to as a Campbell diagram, although strictly
speaking a Campbell diagram has a vertical frequency axis, a horizontal rpm axis,
and a signal amplitude represented as the diameter of a circle (or square) centered
on the appropriate point in the diagram.
VIBRATION ANALYZERS AND THEIR USE 14.29
FIGURE 14.25 Three-dimensional spectral map or waterfall plot, showing how spectra change with
shaft rpm or time.
Ideally, each of the spectra in a cascade plot such as Fig. 14.25 should be obtained
with constant shaft speed at the respective rpm. This is sometimes possible, for
example, during the very slow start-up of a large steam turbine, but usually each
spectrum is a windowed section of a continuously varying signal with a small speed
change within the window length. Consequently, the peak corresponding to each
harmonic is not always localized in one analysis line; in particular, the higher har-
monics are likely to be spread over progressively more lines.Thus, the height of each
peak cannot be used directly as a measure of the strength of each component; it
8434_Harris_14_b.qxd 09/20/2001 11:12 AM Page 14.29
would be necessary to integrate over the whole of a distributed peak to measure the
total power contained in it.
A way of overcoming this problem is to use tracking analysis, where the sampling
rate of the FFT analyzer is related directly to shaft speed. A frequency multiplier
may be used to produce a sampling frequency signal (controlling the A/D converter
of the analyzer) which is a specified multiple of the shaft speed.
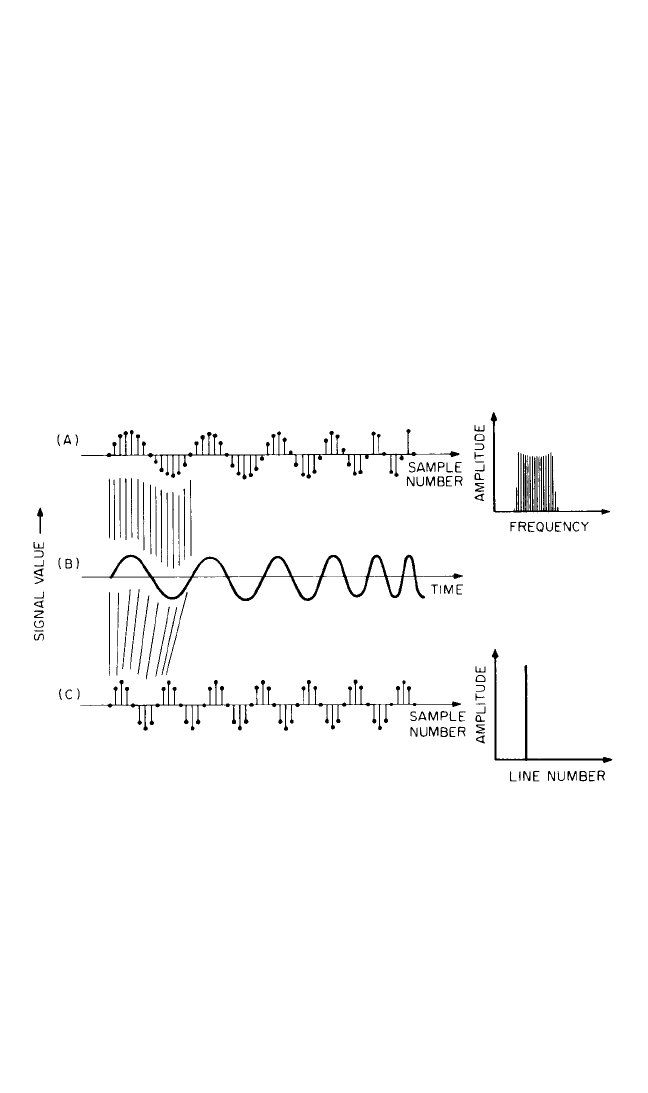
Figure 14.26 illustrates the basic principles. Figure 14.26B shows a hypothetical
signal produced by a rotating shaft during a run-up (in practice, the amplitude nor-
mally also would vary with shaft speed). Figure 14.26A shows the samples obtained
by sampling the signal value at a constant sampling frequency (as for normal fre-
quency analysis) and the spectrum resulting from FFT analysis of these samples. The
spectral peak is seen to spread over a number of lines corresponding to the speed
change along the time record. Figure 14.26C shows the samples obtained by sampling
the signal a fixed number of times per shaft revolution (in this case, eight). The sam-
ples are indistinguishable from those obtained from normal analysis of a constant-
frequency component, and thus the frequency spectrum is concentrated in one line.
14.30 CHAPTER FOURTEEN
FIGURE 14.26 Analysis of a fundamental component which is increasing in frequency.
(A) Data record resulting from a uniform sampling rate, and its spectrum, which spreads
over a frequency band corresponding to the speed change. (B) The original time signal. (C)
Data record resulting from sampling eight times per fundamental cycle, and its spectrum,
which is concentrated in one analysis line.
A frequency multiplier, based on a phase-locked loop, suffers from the disadvan-
tage of a finite response time, so that it cannot keep up if the speed is changing rap-
idly. A better alternative, offered by some analyzers, is based on digital resampling
(interpolation) of each record in line with the simultaneously measured tachometer
signal.
When the sampling frequency varies with shaft speed, however, special pre-
cautions must be taken to avoid problems with aliasing. One possibility is to use a
tracking low-pass filter with a cutoff frequency suitably less than half the sampling
8434_Harris_14_b.qxd 09/20/2001 11:12 AM Page 14.30
frequency. Because of the difficulty of obtaining a tracking filter having a very steep
roll-off (e.g., 120 dB/octave), it is often simpler to choose one of a series of filters
with a fixed cutoff frequency, depending on the current shaft speed. Such a series of
filters (in, for example, a 2, 5, 10 sequence) often is available in the analyzer to
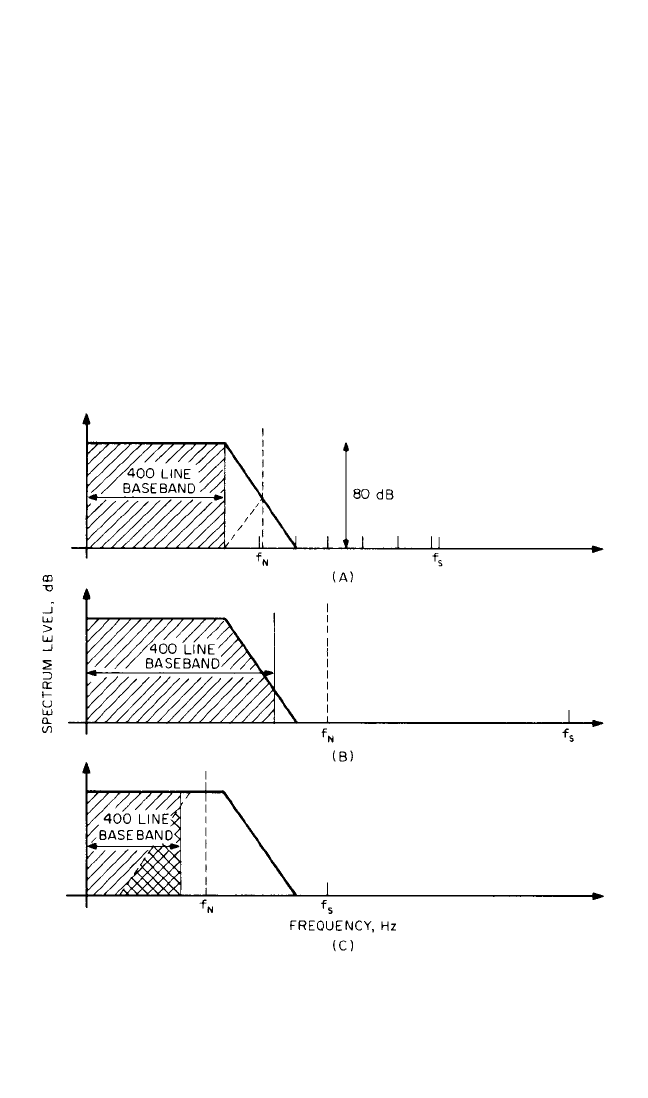
determine the normal frequency ranges. Taking the case of a 400-line analyzer, for
example, all 400 lines in the measured spectrum are valid when the sampling fre-
quency is appropriate to the selected filter (Fig. 14.27A). If the sampling frequency
is higher than the ideal for a given filter, the upper part of the spectrum is affected
by the filter (Fig. 14.27B). If it is lower, the upper part of the spectrum may be con-
taminated by aliasing components (Fig. 14.27C). Nevertheless, by arranging for the
selection of the optimum filter at all times (either manually or automatically), at
least 60 percent of the measured spectrum (i.e., in this case 240 lines) is always
valid. The analysis parameters can be selected so that the desired number of har-
monics is contained within this range, based on the fact that the line number in the
spectrum of a given component is equal to the number of periods it represents in
the data record of length N samples. If, for example, the 30th harmonic is to be
VIBRATION ANALYZERS AND THEIR USE 14.31
FIGURE 14.27 Effect of sampling frequency on the validity of spectral components,
assuming an FFT analyzer with 400 lines and 80-dB dynamic range. f
s
= sampling fre-
quency. f
N
= Nyquist folding frequency = f
s
/2. (A) Normal situation with optimum choice
of sampling frequency for the low-pass filter. (B) Situation with increased sampling fre-
quency. The upper lines in the spectrum are influenced by the low-pass filter. (C) Situa-
tion with decreased sampling frequency. The upper lines in the spectrum are influenced
by aliasing components folded around f
N
(double cross-hatched area).
8434_Harris_14_b.qxd 09/20/2001 11:12 AM Page 14.31
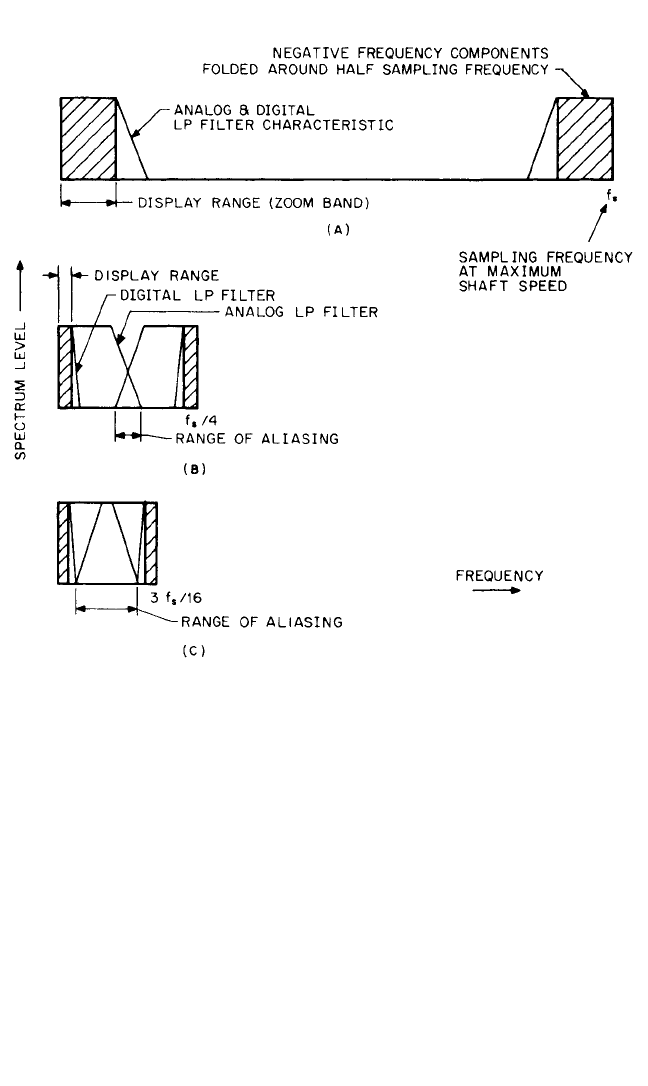
FIGURE 14.28 Use of a fixed low-pass filter to prevent aliasing when tracking with an FFT
analyzer employing zoom to analyze in a lower-frequency band. For illustration purposes, the
sampling frequency at maximum shaft speed has been made four times greater than that appro-
priate to the analog LP filter. The shaft speed range could be made proportionally greater by
increasing this factor. (A) Situation at maximum shaft speed. All harmonics of interest must be
contained in the display range. (B) Situation at one-fourth maximum shaft speed.The analog fil-
ter characteristics overlap, but are well separated from the display range. (C) Situation at three-
sixteenths maximum shaft speed. The aliasing range almost intrudes on the display range.
located in line no. 240, the fundamental must be in line no. 8; there must be eight
periods of the fundamental component along the data record. Where the data
record contains 1024 samples (i.e., N = 1024), the sampling frequency must then be
128 times the shaft speed; thus a frequency multiplier with a multiplication factor of
128 should be used in this specific case.
For FFT analyzers with zoom, a simpler approach can be used, as illustrated in
Fig. 14.28. An analog low-pass filter is applied to the signal with a cutoff frequency
corresponding to the highest required harmonic at maximum shaft speed. However,
a frequency multiplying factor is chosen so as to make the sampling frequency, say,
10 or 20 times this cutoff frequency (instead of the normal 2.56).The spectrum then
14.32 CHAPTER FOURTEEN
8434_Harris_14_b.qxd 09/20/2001 11:12 AM Page 14.32
is obtained by zooming in a range corresponding to the highest required harmonic.
As shown in Fig. 14.28, the shaft speed (and thus the sampling frequency) can then
be varied over a wide range, without aliasing components affecting the measure-
ment results. A somewhat similar procedure is used in conjunction with the digital
resampling technique mentioned above. By using four times oversampling, a maxi-
mum speed range of 5.92:1 can be accommodated without changing the decimation
rate (i.e., the proportion of samples retained after digital filtration), but an even
wider range can be covered, at the expense of small “glitches” at the junctions, if the
decimation rate is allowed to change.
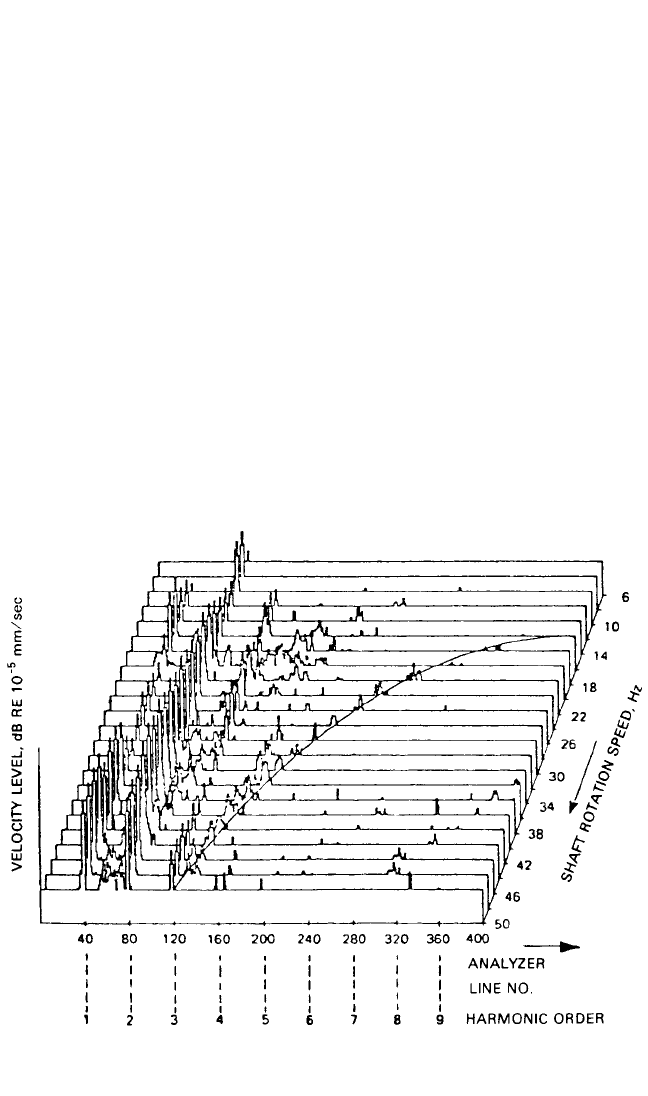
Figure 14.29 shows the results of tracking FFT analysis on a large turbogenerator.
It was made using nondestructive zoom with zoom factor 10. A frequency multiply-
ing factor of 256 was used, giving 40 periods of the fundamental component in the
10K (10,240-point) memory of the FFT analyzer.The fundamental is thus located in
line no. 40 of the 400-line zoom spectrum. Because the harmonics coincide exactly
with analysis lines, rectangular weighting could have been used in place of the Han-
ning weighting actually used (all harmonics have exact integer numbers of periods
along the record length); Hanning weighting can, however, be advantageous for non-
synchronous components such as constant-frequency components. Such a compo-
nent at 150 Hz (initially coinciding with the third harmonic of shaft speed) is shown
in Fig. 14.29. Constant-frequency components follow a hyperbolic locus in cascade
plots employing order tracking.
VIBRATION ANALYZERS AND THEIR USE 14.33
FIGURE 14.29 Tracking FFT analysis of the rundown of a large turbogenerator. The superim-
posed hyperbolic curve represents a fixed-frequency component at 150 Hz.
8434_Harris_14_b.qxd 09/20/2001 11:12 AM Page 14.33

RELATED ANALYSIS TECHNIQUES
Signal analysis techniques other than those described above, which are useful as an
adjunct to frequency analysis, include synchronous averaging, cepstrum analysis, and
Hilbert transform techniques.
Synchronous Averaging (Signal Enhancement). Synchronous averaging is an
averaging of digitized time records, the start of which is defined by a repetitive trig-
ger signal. One example of such a trigger signal is a once-per-revolution synchroniz-
ing pulse from a rotating shaft. This process serves to enhance the repetitive part of
the signal (whose period coincides with that of the trigger signal) with respect to
nonsynchronous effects. That part of the signal which repeats each time adds
directly, in proportion to the number of averages, n. The nonsynchronous compo-
nents, both random noise and periodic signals with a different period, add like noise,
with random phase; the amplitude increase is in proportion to
––
n. The overall
improvement in the signal-to-noise rms ratio is thus
––
n,resulting in an improve-
ment of 10 log
10
n dB, i.e., 10 dB for 10 averages, 20 dB for 100, 30 dB for 1000.
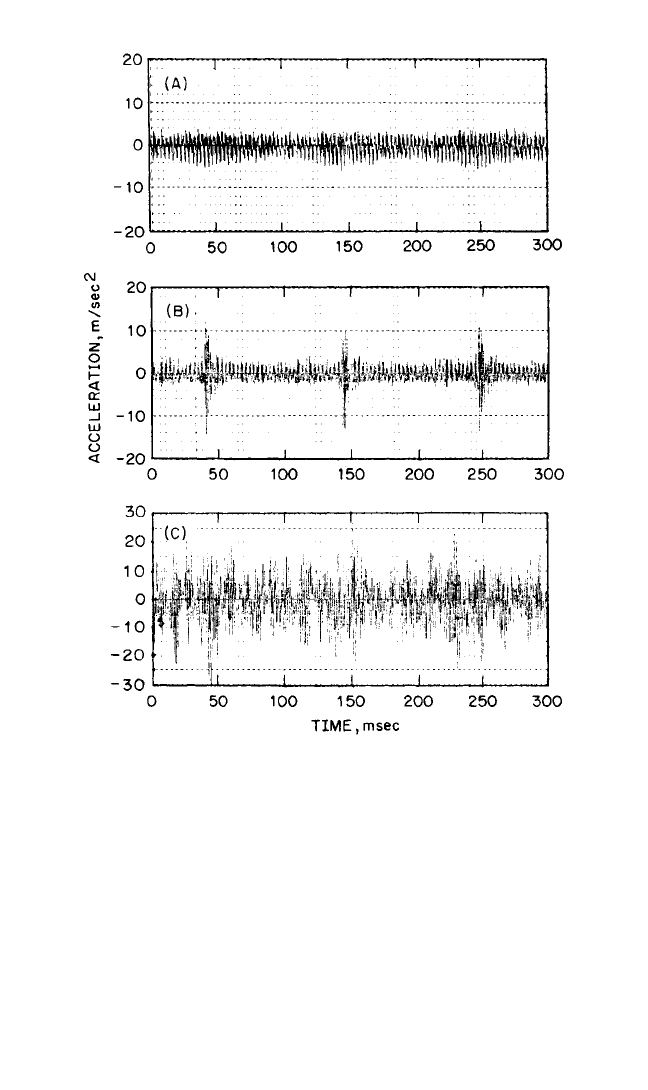
Figure 14.30 shows the application of synchronous averaging to vibration signals
from similar gearboxes in good and faulty condition. Figure 14.30A shows the
enhanced time signal (120 averages) for the gear on the output shaft. The signal is
fairly uniform and gives evidence of periodicity corresponding to the tooth-meshing.
Figure 14.30B is a similarly enhanced time signal for a faulty gear; a localized defect
on the gear is revealed. By way of comparison, Fig. 14.30C shows a single time
record, without enhancement, for the same signal as in Fig. 14.30B; neither the
tooth-meshing effect nor the fault is readily seen.
For best results, synchronous averaging should be combined with tracking. Where
there is no synchronization between the digital sampling and the (analog) trigger sig-
nal, an uncertainty of up to one sample spacing can occur between successive digitized
records.This represents a phase change of 360° at the sampling frequency, and approx-
imately 140° at the highest valid frequency component in the signal, even with per-
fectly stable speed. Where speed varies, an additional phase shift occurs; for example,
a speed fluctuation of 0.1 percent would cause a shift of one sample spacing at the end
of a typical 1024-sample record. The use of tracking analysis (generating the sampling
frequency from the synchronizing signal) reduces both effects to a minimum.
Cepstrum Analysis. Originally the cepstrum was defined as the power spectrum of
the logarithmic power spectrum.
9
A number of other terms commonly found in the
cepstrum literature (and with an equivalent meaning in the cepstrum domain) are
derived in an analogous way, e.g., cepstrum from spectrum, quefrency from frequency,
rahmonic from harmonic.The distinguishing feature of the cepstrum is not just that it
is a spectrum of a spectrum, but rather that it is the spectrum of a spectrum on a loga-
rithmic amplitude axis; by comparison, the autocorrelation function [see Eq. (22.21)] is
the inverse Fourier transform of the power spectrum without logarithmic conversion.
Most commonly, the power cepstrum is defined as the inverse Fourier transform
of the logarithmic power spectrum,
10
which differs primarily from the original defi-
nition in that the result of the second Fourier transformation is not modified by
obtaining the amplitude squared at each quefrency; it is thus reversible back to the
logarithmic spectrum. Another type of cepstrum, the complex cepstrum, discussed
below, is reversible to a time signal.
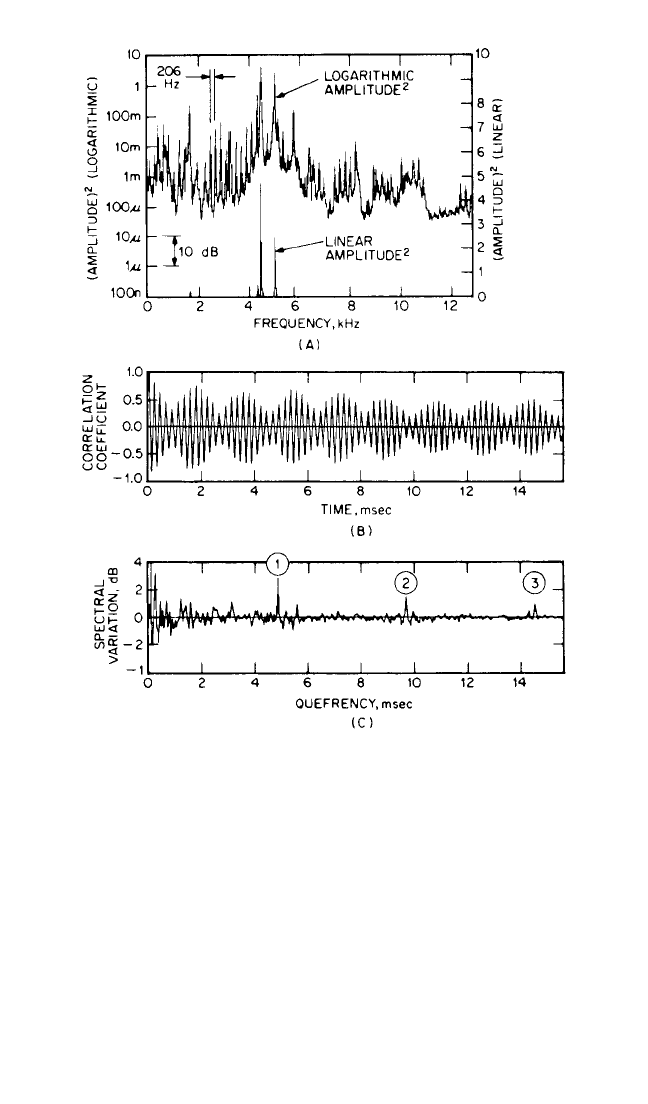
Figure 14.31, the analysis of a vibration signal from a faulty bearing, shows the
advantage of the power cepstrum over the autocorrelation function. In Fig. 14.31A,
the same power spectrum is depicted on both linear and logarithmic amplitude axes;
14.34 CHAPTER FOURTEEN
8434_Harris_14_b.qxd 09/20/2001 11:12 AM Page 14.34
in (B) and (C) the autocorrelation and cepstrum, respectively, are shown. In (C), the
use of the logarithmic power spectrum reveals the existence of a family of harmon-
ics which are concealed in the linear depiction. The presence of the family of har-
monics is made evident by a corresponding series of rahmonics in the cepstrum
(denoted ➀, ➁, etc.), but is not detected in the autocorrelation function. The que-
frency axis of the cepstrum is a time axis, most closely related to the X axis of the
autocorrelation function (i.e., time delay or periodic time rather than absolute time).
The reciprocal of the quefrency of any component gives the equivalent frequency
spacing in the spectrum, not the absolute frequency.
Most of the applications of the power cepstrum derive from its ability to detect a
periodic structure in the spectrum, for example, families of uniformly spaced har-
VIBRATION ANALYZERS AND THEIR USE 14.35
FIGURE 14.30 Use of signal enhancement in gear fault diagnosis. (A)
Enhanced signal (120 averages) for a gear in normal condition. (B)
Enhanced signal (120 averages) for a similar gear with a local fault. (C) Sec-
tion of raw signal corresponding to (B).
8434_Harris_14_b.qxd 09/20/2001 11:12 AM Page 14.35
monics and/or sidebands. The application of the cepstrum to the diagnosis of faults
in gears and rolling element bearings is discussed in Chap. 16 and Ref. 11.
To obtain a distinct peak in the cepstrum, a reasonable number of the members
of the corresponding harmonic or sideband family must be present (although the
fundamental may be absent). These uniformly spaced components must be ade-
quately resolved in the spectrum. As a guide, the spacing of components to be
detected should be a minimum of eight lines in the original spectrum. For this rea-
son, it is often advantageous to perform a cepstrum analysis on a spectrum obtained
by zoom FFT. In this case it is desirable to use a slightly modified definition of the
14.36 CHAPTER FOURTEEN
FIGURE 14.31 Effect of linear vs. logarithmic amplitude scale in power
spectrum. (A) Power spectrum on linear scale (lower curve) and logarith-
mic scale (upper curve). (B) Autocorrelation function (obtained from linear
representation). (C) Cepstrum (obtained from logarithmic representa-
tion)—➀, ➁, etc., are rahmonics corresponding to harmonic series in spec-
trum (4.85 milliseconds equivalent to 1/206 Hz). The harmonics result from
a fault in a bearing.
8434_Harris_14_b.qxd 09/20/2001 11:12 AM Page 14.36
cepstrum corresponding to the amplitude of the analytic signal.
11
(See the next sec-
tion on Hilbert Transform Techniques.)
The complex cepstrum
10,12
(referred to above) is defined as the inverse Fourier
transform of the complex logarithm of the complex spectrum. Despite its name, it is
a real-valued function of time, differing from the power cepstrum primarily in that it
uses phase as well as logarithmic amplitude information at each frequency in the
spectrum. It is thus reversible to a time function (from which the complex spectrum
is obtained by direct Fourier transformation).
Measured vibration signals generally represent a combination of source and
transmission path effects; for example, internal forces in a machine (the source
effect) act on a structure whose properties may be described by a frequency
response function between the point of application and the measurement point (the
transmission path effect). As shown in Refs. 10 and 12, the source and transmission
path effects are convolved in the time signals, multiplicative in the spectra, and addi-
tive in the logarithmic spectra and in the cepstra (both power cepstra and complex
cepstra). In the cepstra, they quite often separate into different regions, which in
principle allows a separation of source and transmission path effects in an externally
measured signal.
13
Figure 14.32 shows an example of an internal cylinder pressure signal in a diesel
engine, derived from an externally measured vibration acceleration signal making
use of cepstrum techniques to generate the inverse filter.
14
VIBRATION ANALYZERS AND THEIR USE 14.37
FIGURE 14.32 Diesel engine cylinder pressure sig-
nal, derived from an externally measured vibration-
acceleration signal using cepstrum techniques. (From
R. H. Lyon and A. Ordubadi.
14
)
Reference 15 gives similar results for the tooth-mesh signal in a gearbox and also
shows that a frequency response function derived by windowing in the cepstrum of
an output signal compares favorably with a direct measurement (which requires
measurement of both an input and an output signal).
Hilbert Transform Techniques. The Hilbert transform is the relationship
between the real and imaginary parts of the Fourier transform of a one-sided sig-
nal.
16
An example is a causal signal such as the impulse response of a vibratory sys-
tem (a causal signal is one whose value is zero for negative time). The real and
imaginary parts of the frequency response (the Fourier transform of the impulse
response) are related by the Hilbert transform; thus, only one part need be known—
the other can be calculated.
8434_Harris_14_b.qxd 09/20/2001 11:12 AM Page 14.37