Harris C.M., Piersol A.G. Harris Shock and vibration handbook
Подождите немного. Документ загружается.

CONCEPTS IN VIBRATION DATA ANALYSIS 22.5
where X(f,T
P
) is as defined in Eq. (22.3) with T = T
P
, the period of the vibration. A
plot of L
x
(f) versus frequency is called a line spectrum or a linear spectrum. The
phase angles, θ
k
; k = 1,2,3,...,are usually ignored, but these phase values should be
retained if the time-history is not retained, since both the magnitude and phase val-
ues in Eq. (22.4) are required to reconstruct the time-history.
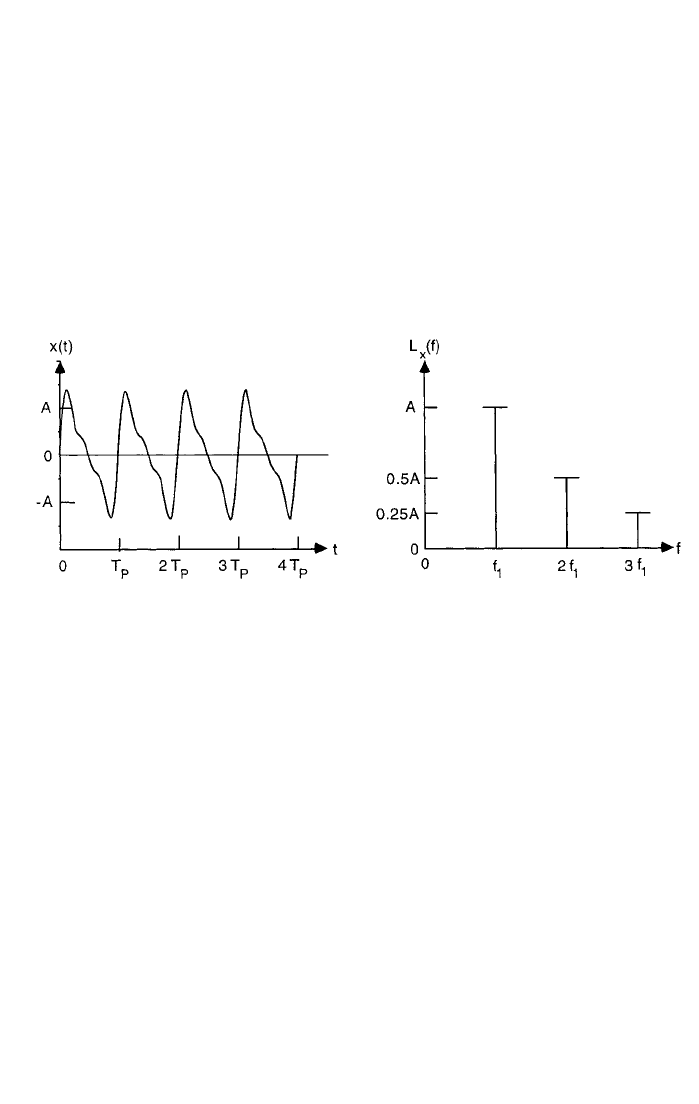
Periodic vibrations are usually produced by the mechanical excitations of rotat-
ing machines and reciprocating engines operating with a constant rotational speed.
They are also produced by the aerodynamic excitations from large fans and pro-
pellers, again operating at a constant rotational speed. An illustration of the time-
history and line spectrum for a periodic vibration composed of three harmonic
components (k = 1, 2, and 3) is shown in Fig. 22.2.
FIGURE 22.2 Time-history and line spectrum for periodic vibration.
Almost-Periodic Vibrations. Although periodic vibrations can be decomposed
into a collection of commensurately related sine waves, as given by Eq. (22.4), it does
not follow that the sum of two or more independent sinusoidal excitations will pro-
duce a periodic vibration. As noted previously in Chap. 1, the sum of such inde-
pendent sine waves will be periodic only if the ratios of all pairs of frequencies
create rational numbers. Those deterministic vibrations that do not have commen-
surately related frequency components are called almost-periodic
1
(also called
quasi-periodic or complex) vibrations. Nevertheless, such vibrations can be de-
scribed by a line spectrum based upon a relationship similar to Eq. (22.4), except the
commensurately related frequencies kf
1
are replaced by independent frequencies f
k
;
k = 1,2,3,....As for periodic vibrations, the magnitude of the frequency compo-
nents for almost-periodic vibrations can be described by a line spectrum defined in
Eq. (22.5), except T
P
→∞.
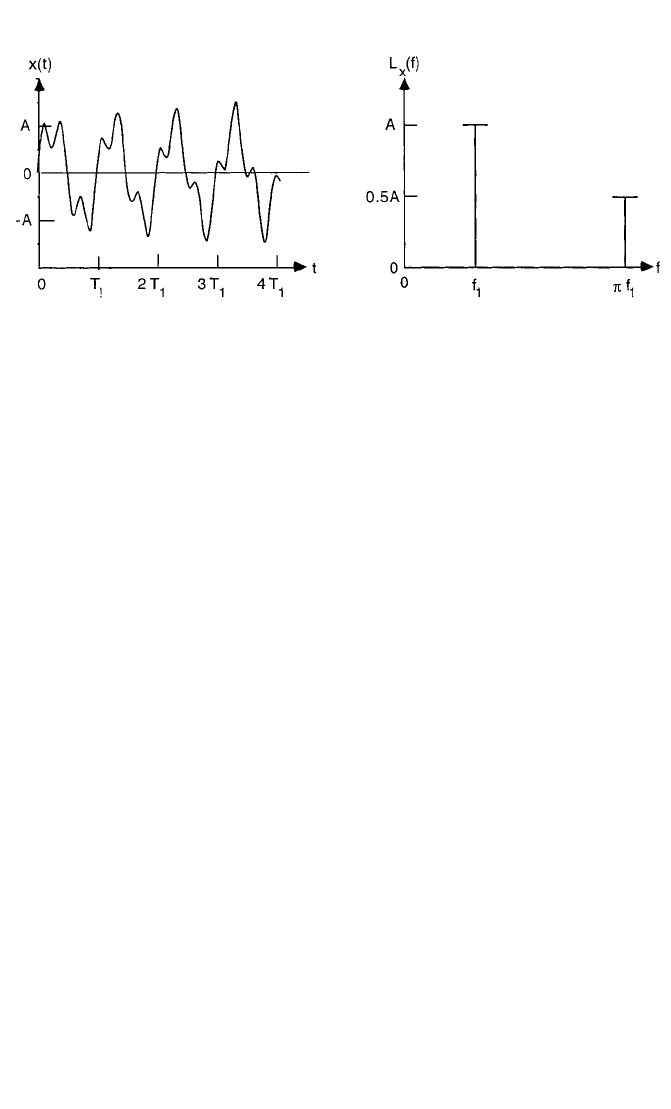
Almost-periodic vibrations often occur when two or more independent periodic
excitations are summed. For example, the vibration produced by two independent
rotating machines that are not synchronized or geared together will usually be
almost-periodic rather than periodic. An illustration of the time-history and line
spectrum for an almost-periodic vibration composed of the sum of two sine waves
that are not commensurately related is shown in Fig. 22.3.
8434_Harris_22_b.qxd 09/20/2001 12:06 PM Page 22.5
22.6 CHAPTER TWENTY-TWO
STATIONARY RANDOM VIBRATIONS
By definition, random vibrations cannot be described by an explicit mathematical
function and, hence, must be described in statistical terms.This can be done (a) in the
amplitude domain by probability functions, (b) in the time domain by correlation
functions, and/or (c) in the frequency domain by spectral density functions.
Probability Density Functions. From Chap. 11, the probability density function
of a stationary random vibration x(t) may be defined as
p(x) = lim
Τ→∞
(22.6)
where T(x,∆x) is the time that x(t) is within the magnitude interval ∆x centered at x
during the sample record duration T. The integral of the probability density function
between any two magnitudes x
1
and x
2
defines the probability at any future instant
that the value of x(t) will fall between x
1
and x
2
, that is,
Prob[x
1
< x(t) ≤ x
2
] =
x
2
x
1
p(x)dx (22.7)
It is noted in Chaps. 11 and 20 that the vibration response of a linear structure to
a stationary random excitation tends to be closely approximated by a specific prob-
ability density function, namely, the Gaussian (normal) probability density function,
which is defined in Eq. (11.14) and plotted in Fig. 22.4. Hence, it is common to omit
the computation of probability density functions from the analysis of random vibra-
tion data, and to simply assume the probability density function is Gaussian. How-
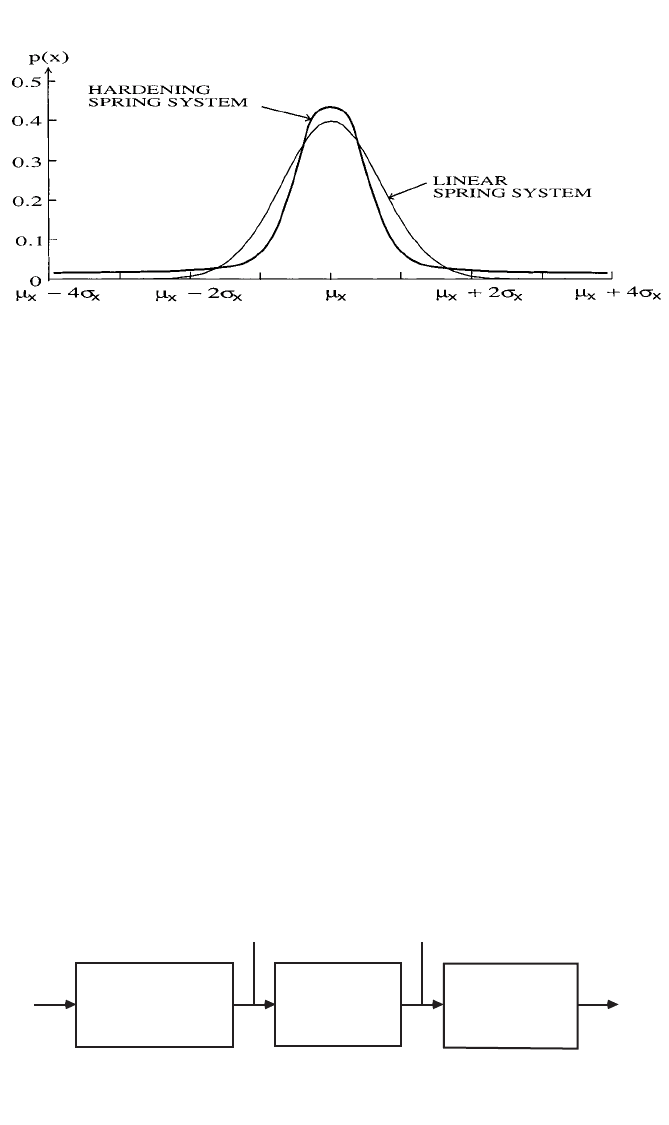
ever, the vibration response of a nonlinear system, even when the excitation is
Gaussian, will generally not be Gaussian.
3
For example, the probability density func-
tion for the acceleration response to a Gaussian excitation of a single degree-of-
freedom system with a stiffness that increases with displacement (often called a
hardening spring system as illustrated in Fig. 31.8) is typically as shown in Fig. 22.4.
Note that the Gaussian assumption for such data can lead to erroneous conclusions
concerning the occurrence of extreme values.
Correlation Functions. Autocorrelation functions and cross-correlation functions
are defined in Eqs. (11.15) through (11.19). They have important theoretical appli-
T(x,∆x)
T
1
∆x
FIGURE 22.3 Time-history and line spectrum for almost-periodic vibration.
∆x → 0
8434_Harris_22_b.qxd 09/20/2001 12:06 PM Page 22.6
cations,
1–6
and a few practical applications to vibration problems.
7
However, the
Fourier transform of a correlation function, called a spectral density function, is gen-
erally of greater interest for practical applications. Furthermore, in those rare cases
where a correlation function may be of interest, it can always be computed by taking
the inverse Fourier transform of a spectral density function.
Power Spectral Density Functions. The power spectral density function (also
called the power spectrum, autospectral density function, or autospectrum) of a sta-
tionary random vibration x(t) is often defined as the Fourier transform of the auto-
correlation function (see Chap. 11). From a practical viewpoint, however, two
equivalent theoretical definitions are more relevant to later data analysis algo-
rithms. First, the power spectrum of x(t) may be defined as
1
W
xx
(f) = lim
T →∞
E[|X(f,T)|
2
] f > 0 (22.8)
where E[ ] denotes the expected value of [ ], which implies an ensemble average,
and X(f,T) is defined in Eq. (22.3). Note that the power spectrum W
xx
(f) in Eq.
(22.8) is defined for positive frequencies only, and is often referred to as a one-sided
spectrum.
The second definition for the power spectrum is more engineering-oriented.
Specifically, referring to Fig. 22.5, the random vibration record x(t) is passed through
a narrow bandpass filter with a bandwidth B
e
and center frequency f to obtain an
output x(f,B
e
,t). The output is squared and averaged over a duration T to obtain a
2
T
CONCEPTS IN VIBRATION DATA ANALYSIS 22.7
FIGURE 22.4 Probability density functions for the acceleration response of linear and hardening
spring systems to stationary random excitation.
FIGURE 22.5 Definition of power spectrum by filtering, squaring, and averaging operations.
BANDPASS FILTER:
BANDWIDTH = B
CENTER FREQ. =
f
x(t)
e
DIVIDE BY BAND-
WIDTH B AND
TAKE LIMITS
W (f)
xx
SQUARE AND
AVERAGE OVER
DURATION T
e
(f, B , T)
x
ψ
2
e
x f, B , t
(
)
e
8434_Harris_22_b.qxd 09/20/2001 12:06 PM Page 22.7

22.8 CHAPTER TWENTY-TWO
bandwidth-limited mean-square value ψ
2
x
(f,B
e
,T). Finally, the bandwidth-limited
mean-square value is divided by the bandwidth B
e
. In the limit as B
e
approaches zero
and B
e
T approaches infinity, the computation illustrated in Fig. 22.5 yields the power
spectrum, that is,
W
xx
(f) = lim
T →
∞
T
0
x
2
(f,B
e
,t)dt f > 0 (22.9)
It can be shown
1
that Eq. (22.9) produces exactly the same result as Eq. (22.8), as
well as the result in Eq. (11.29).
The power spectrum describes the frequency content of the vibration and, hence, is
generally the most important and widely used function for engineering applications,
4,7
which are facilitated by three important properties of power spectra, as follows:
1. Given two or more statistically independent vibrations, the power spectrum for
the sum of the vibrations is equal to the sum of the power spectra for the indi-
vidual vibrations, that is,
W
xx
(f) =
i
W
ii
(f) i = 1,2,3,... (22.10)
2. The area under the power spectrum between any two frequencies, f
a
and f
b
,
equals the mean-square value of the vibration in the frequency range from f
a
to
f
b
, that is,
ψ
2
x
(f
a
,f
b
) =
f
b
f
a
W
xx
(f)df (22.11)
3. Given an excitation x(t) to a structural system with a frequency response function
H(f) (see Chap. 21), the power spectrum of the response y(t) is given by the prod-
uct of the power spectrum of the excitation and the squared magnitude of the fre-
quency response function, that is,
W
yy
(f) = |H(f)|
2
W
xx
(f) (22.12)
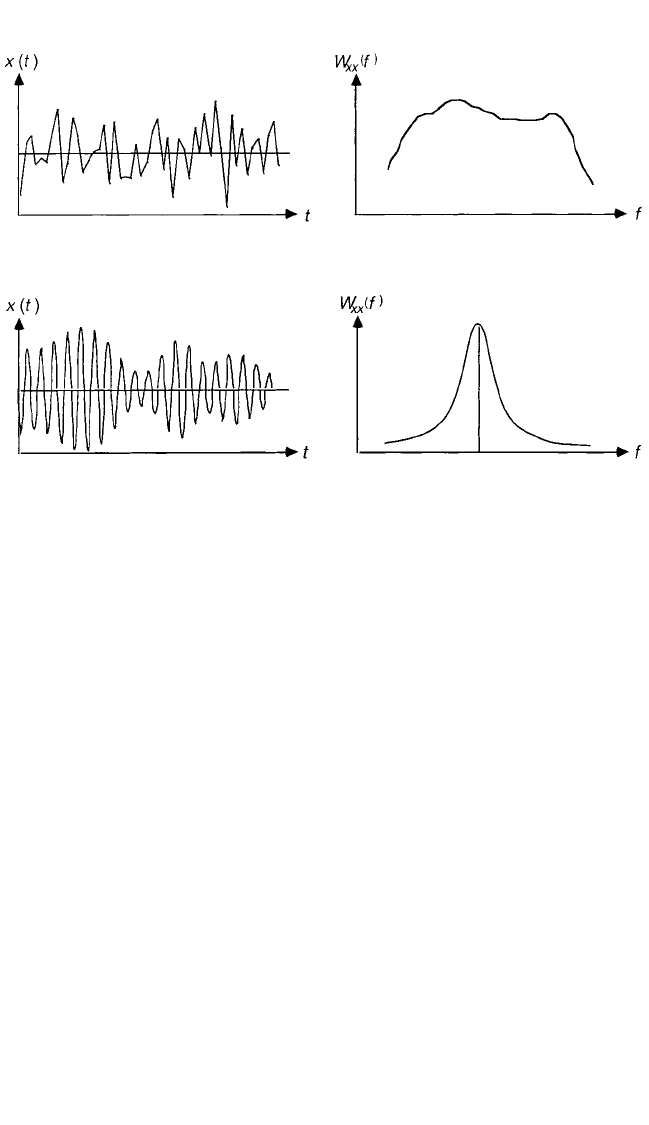
Illustrations of the time-histories and autospectra for both wide bandwidth and
narrow bandwidth random vibrations are shown in Fig. 22.6.
Cross-Spectral Density Functions. Given two stationary random vibrations x(t)
and y(t), the cross-spectral density function (also called the cross-spectrum) is
defined as
W
xy
(f) = lim
T →∞
E[X*(f,T)Y(f,T)] f > 0 (22.13)
where E[ ] is the expected value of [ ], which implies an ensemble average, X*(f,T) is
the complex conjugate of the finite Fourier transform of x(t), as defined in Eq.
(22.3), and Y(f) is the finite Fourier transform of y(t), as defined in Eq. (22.3) with
y(t) replacing x(t).
The cross-spectrum is generally a complex number that measures the linear rela-
tionship between two random vibrations as a function of frequency with a possible
phase shift between the vibrations. Specifically, the cross-spectrum can be written as
2
T
1
B
e
T
B
e
→ 0
8434_Harris_22_b.qxd 09/20/2001 12:06 PM Page 22.8
W
xy
(f) = |W
xy
(f)|e
−jθ
xy
(f)
θ
xy
(f) = 2πfτ(f) (22.14)
where τ(f) is the time delay between x(t) and y(t) at frequency f. An important appli-
cation of the cross-spectrum is as follows. Given a random excitation x(t) to a struc-
ture with a frequency response function H(f) (see Chap. 21), the cross-spectrum
between the excitation x(t) and the response y(t) is given by the product of the
power spectrum of the excitation and the frequency response function, H(f), that is,
W
xy
(f) = H(f)W
xx
(f) (22.15)
Coherence Functions. From Chap. 21, the coherence function between two ran-
dom vibrations x(t) and y(t) is given by
γ
2
xy
(f) = f > 0 (22.16)
where all terms are as defined in Eqs. (22.8) and (22.13). The coherence function is
bounded at all frequencies by zero and unity, where γ
2
xy
(f) = 0 means there is no lin-
ear relationship between x(t) and y(t) at the frequency f (the two vibrations are
uncorrelated) and γ
2
xy
(f) = 1 means there is a perfect linear relationship between x(t)
and y(t) at the frequency f (one vibration can be exactly predicted from the other).
This property leads to an important application of the coherence function. Specifi-
cally, given a stationary random vibration y(t) = x(t) + n(t), where n(t) represents
extraneous noise, including other vibrations that are not correlated with x(t), then
W
xx
(f) =γ
2
xy
(f) W
yy
(f) (22.17)
|W
xy
(f)
2
|
W
xx
(f)W
yy
(f)
CONCEPTS IN VIBRATION DATA ANALYSIS 22.9
FIGURE 22.6 Time-histories and autospectra for wide-bandwidth (A) and narrow-bandwidth (B)
random vibrations.
(A)
(B)
8434_Harris_22_b.qxd 09/20/2001 12:06 PM Page 22.9

22.10 CHAPTER TWENTY-TWO
The result in Eq. (22.17) is referred to as the coherent output power relationship.
1
The coherence function is also an important parameter in establishing the statistical
sampling errors in various spectral estimates to be discussed later.
Other Functions. There are various other specialized functions that have impor-
tant applications for certain advanced stationary random data analysis problems,
including the following:
1. Cepstrum functions, which have important applications to machinery condition
monitoring (see Chap. 14).
2. Hilbert transforms, which can be used to determine the causality between two
measurements
1
and certain properties of modulation processes (Chap. 14).
3. Conditioned spectral density and coherence functions, which have important
applications to the analysis of structural vibration responses to multiple excita-
tions that are partially correlated,
1,7
as well as to the analysis of the vibration
responses of nonlinear systems.
3,7
4. Higher-order spectral density functions, such as bi-spectra and tri-spectra, which
have applications to the analysis of the vibration responses of nonlinear systems.
3
5. Cyclostationary functions, which have important applications to machinery fault
diagnosis procedures.
8
QUANTITATIVE DESCRIPTIONS OF
NONSTATIONARY VIBRATIONS
Unlike stationary vibrations, the properties of nonstationary vibrations must be
described as a function of time, which theoretically requires instantaneous averages
computed over an ensemble of sample records, {x(t)}, acquired under statistically
similar conditions. In this context, the overall values for stationary vibrations in
Eq. (22.1) are given for nonstationary vibrations by
Mean value: µ
x
(t) = E[x(t)]
Mean-square value: ψ
2
x
(t) = E[x
2
(t)] (22.18)
Variance: σ
2
x
(t) = E[{x(t) −µ
x
(t)}
2
]
where E[ ] denotes the expected value of [ ], which implies an ensemble average.
Equation (22.2) applies to the values in Eq. (22.18) at each time t, and the interpre-
tations of these values following Eq. (22.2) apply.
NONSTATIONARY DETERMINISTIC VIBRATIONS
Nonstationary deterministic vibrations are defined here as those vibrations that
would be periodic under constant conditions, but where the conditions are time-
varying such that the instantaneous magnitude and/or the fundamental frequency of
the vibration versus time vary slowly compared to the fundamental frequency of the
vibration (often called phase coherent vibrations). In other words, the vibration can
be described by Eq. (22.4) where the magnitude and phase terms, a
k
and θ
k
, are
replaced by time-varying magnitude and phase terms, a
k
(t) and θ
k
(t), and/or the fun-
8434_Harris_22_b.qxd 09/20/2001 12:06 PM Page 22.10
damental frequency f
1
is replaced by a time-varying fundamental frequency f
1
(t),
that is,
x(t) = a
0
(t) +
k
a
k
(t) cos [2πkf
1
(t) +θ
k
(t)] (22.19)
A similar nonstationary deterministic vibration is given by Eq. (22.19) with kf
1
(t)
replaced by f
k
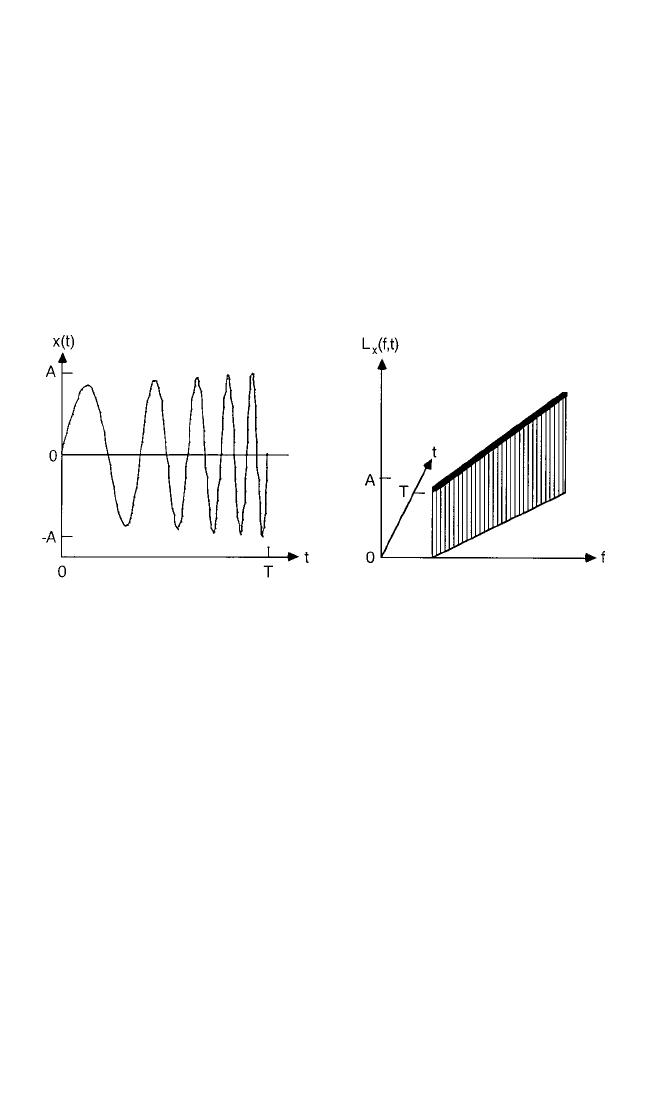
(t). Nonstationary deterministic vibrations described by Eq. (22.19)
are commonly displayed as a three-dimensional plot of the magnitude of the time-
varying coefficients versus time and frequency. Such a plot is often referred to as an
instantaneous line spectrum. An illustration of the time-history and instantaneous
line spectrum for a single instantaneous frequency component with linearly increas-
ing magnitude and frequency is shown in Fig. 22.7.
CONCEPTS IN VIBRATION DATA ANALYSIS 22.11
FIGURE 22.7 Time-history and instantaneous line spectrum for sine wave with slowly
increasing frequency and amplitude.
Another way to describe the frequency-time characteristics of a nonstationary
deterministic vibration is by the Wigner distribution, defined as
1,9
WD
xx
(f,t) =
∞
−∞
x
t −
x
t +
e
−j2πfτ
dτ (22.20)
The Wigner distribution is similar to the instantaneous power spectrum discussed
later in this chapter, and has interesting theoretical properties.
9
However, it often
produces negative spectral values, which are difficult to interpret for most engineer-
ing applications, and offers few advantages over the instantaneous line spectrum
given by Eq. (22.19).
NONSTATIONARY RANDOM VIBRATIONS
There are several theoretical ways to describe nonstationary random data,
1
includ-
ing generalized spectra defined for two frequency variables that provide rigorous
excitation-response relationships, even for time-varying linear systems. From a data
analysis viewpoint, however, the most useful theoretical description for nonstation-
ary random vibrations is provided by the instantaneous power spectral density func-
tion (also called the instantaneous power spectrum or instantaneous autospectrum).
The instantaneous power spectrum is defined by
1,7
τ
2
τ
2
8434_Harris_22_b.qxd 09/20/2001 12:06 PM Page 22.11
22.12 CHAPTER TWENTY-TWO
W
xx
(f,t) = E
x
t −
x
t +
e
−j2πfτ
dτ (22.21)
where E[ ] denotes the expected value of [ ], which implies an ensemble average.
Note that the instantaneous power spectrum is essentially the Wigner distribution
defined in Eq. (22.20), except the product of the values of x(t) at two different times
is averaged.
Like the Wigner distribution, the instantaneous power spectrum can have nega-
tive values at some frequencies and times.
1
For example, let a nonstationary random
process be defined as
{x(t)} = [cos 2πf
0
t]{u(t)} (22.22)
where {u(t)} is a narrow bandwidth stationary random process with a mean value of
zero and a standard deviation of unity, and the cosine term is a modulating function.
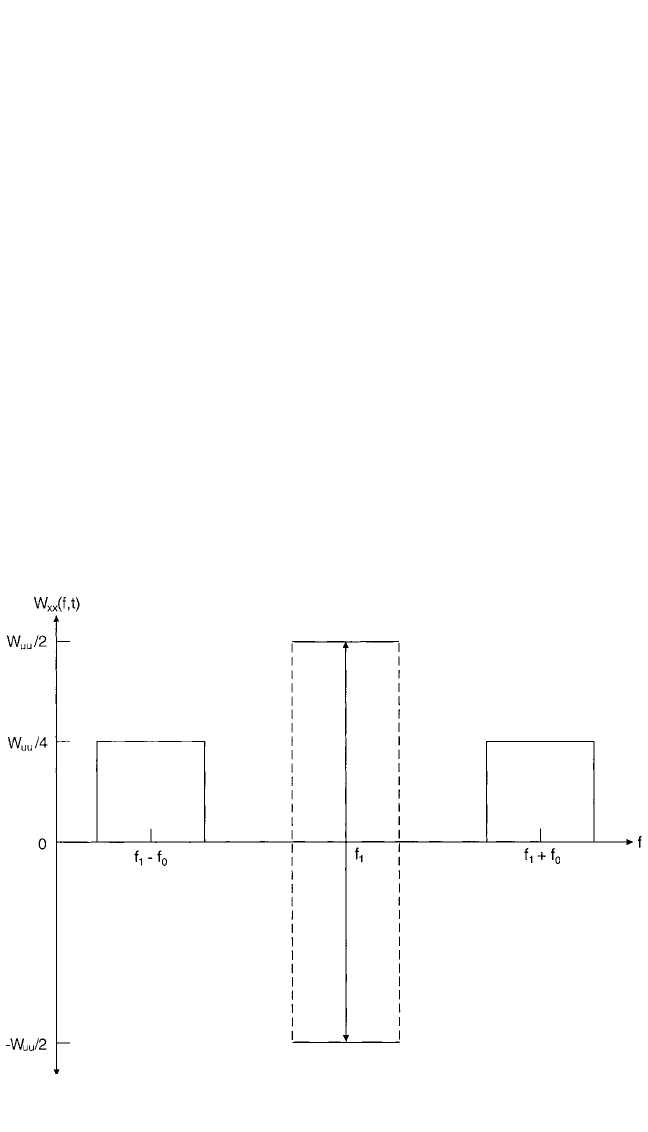
Substituting Eq. (22.22) for Eq. (22.21) yields
W
xx
(f,t) = [W
uu
(f − f
0
) + W
uu
(f + f
0
)] + cos (4πf
0
t)W
uu
(f) (22.23)
where W
uu
(f) is the power spectrum of the stationary component {u(t)}. The instan-
taneous power spectrum given by Eq. (22.23) is plotted in Fig. 22.8. Note that the
instantaneous power spectrum consists of two stationary components (often called
sidebands) that are offset in frequency from the center frequency f
1
of {u(t)} by plus
and minus the modulating frequency f
0
, and a time-varying component at the center
1
2
1
4
τ
2
τ
2
FIGURE 22.8 Instantaneous power spectrum for cosine-modulated, narrow bandwidth random
vibration.
8434_Harris_22_b.qxd 09/20/2001 12:06 PM Page 22.12

CONCEPTS IN VIBRATION DATA ANALYSIS 22.13
frequency f
1
of {u(t)} that oscillates between positive and negative values. Further
note that for nonstationary vibration environments, as defined in this chapter, a
modulating frequency is small compared to the lowest frequency of the stationary
component, that is, f
0
<< f
1
− B/2, where B is the bandwidth of the stationary compo-
nent. It follows that the stationary and time-varying spectral components of the
instantaneous power spectrum will heavily overlap and, hence, eliminate negative
spectral values at most times and frequencies.
PRELIMINARY DATA ANALYSIS
CONSIDERATIONS
Before the detailed analysis of vibration data is initiated, careful consideration
should be given to the following:
1. Final engineering applications of the analyzed data.
2. Stationary sample record durations for the data analysis.
3. Validation and editing of the data.
4. Data storage.
5. Analog-to-digital conversion.
The first two matters should actually be considered prior to the acquisition of the data,
but in any case should be carefully reviewed prior to the initiation of the data analysis.
ENGINEERING APPLICATIONS OF DATA ANALYSIS
Numerous possible applications might motivate the acquisition and analysis of vibra-
tion data, including the applications in this Handbook summarized in Table 22.1.
TABLE 22.1 Applications of Analyzed Vibration Data
Application Chapter
Formulation of test criteria and
verification of test results 19, 20
Formulation of design criteria 41
Condition monitoring of machinery 16
Modal analysis and testing 21
Assessing the vibration response
of structures 24; 29, Part I; 29, Part II; 29, Part III
Assessing the effects of vibration on
humans 42
Prediction of structural failures and
fatigue damage 11, 34, 35
Calibration of transducers 18
Evaluation of vibration responses of
nonlinear systems 4
Balancing of rotating machinery 39, Part I
Input data for mathematical models 11; 28, Part I; 28, Part II
8434_Harris_22_b.qxd 09/20/2001 12:06 PM Page 22.13

The final application for the data is important in determining which properties of
the data should be computed. In most cases, the primary property of interest will be
some form of a frequency spectrum. However, there may be applications that
require other types of analysis. For example, fatigue damage predictions for ran-
dom vibration environments generally require some form of amplitude distribution
analysis, as detailed in Chaps. 11 and 34. These matters should be thoroughly
reviewed prior to initiating data analysis, not only to assure the needed data prop-
erties are computed, but also to avoid computing large amounts of unneeded infor-
mation.
STATIONARY SAMPLE RECORD DURATIONS
It is clear from the descriptions of vibrations in preceding sections that stationary
vibrations are much easier to analyze than nonstationary vibrations. It follows that
an effort should be made to collect stationary sample records of vibration data for
analysis. This is easily accomplished for the vibration data produced by laboratory
experiments, since most such experiments are performed under constant conditions
that naturally produce stationary results. On the other hand, the vibration data col-
lected from measurements of actual vibration environments are commonly nonsta-
tionary. Even in this case, measurement programs can often be designed to produce
stationary data for analysis purposes. For example, the vibration environment for a
motor vehicle during normal service operations is generally nonstationary. How-
ever, if the vehicle is operated over a homogeneous road at constant speed and
engine rpm, the resulting vibration levels will be approximately stationary. It follows
that the vibration environment of the vehicle under all conditions can be measured
and analyzed from a collection of stationary sample records, each representing a
specific road condition, vehicle speed, and/or engine rpm, that together cover all the
operating conditions for the vehicle. Whether a laboratory experiment or a field
experiment, the vibration data acquired for analysis should be forced to be station-
ary when possible.
Some vibrations are produced by excitations that cannot be forced to be station-
ary. Examples include the response of structures to wind loads (see Chap. 39, Part I)
and ocean waves (see Chap. 39, Part II). Even in these cases, however, it is often pos-
sible to identify and select piecewise stationary segments from a long sample record
for data analysis purposes. On the other hand, there are some types of vibration
environments that are inherently nonstationary, for example, a laboratory vibration
test involving a sweep-sine excitation (see Chap. 20) or the vibration environment of
a space vehicle during launch. In these situations, some type of nonstationary data
analysis procedure must be employed.
DATA VALIDATION AND EDITING
Every effort should be made to acquire accurate vibration data, as outlined in
Chap. 15. However, all vibration data collected and stored for later analysis should
be validated and, if necessary, edited to remove anomalies prior to analysis. The
four most common and serious anomalies in acquired vibration data are as fol-
lows:
1,2
1. Signal clipping, which is a limiting on one or both sides of the time-history record,
is caused by too high a gain setting on one or more data acquisition instruments.
22.14 CHAPTER TWENTY-TWO
8434_Harris_22_b.qxd 09/20/2001 12:06 PM Page 22.14