Hatano Y., Katsumura Y., Mozumder A. (Eds.) Charged Particle and Photon Interactions with Matter - Recent Advances, Applications, and Interfaces
Подождите немного. Документ загружается.

460 Charged Particle and Photon Interactions with Matter
17.4.2 MeaSureMentS of Surface tenSion and ultraviolet-viSible abSorption Spectra
Surface tension and ultraviolet absorption measurements provide important reference data for
following discussion on solute dye molecules adsorbed at the water surface (Seno etal., 2002;
Harata
etal., 2009).
The
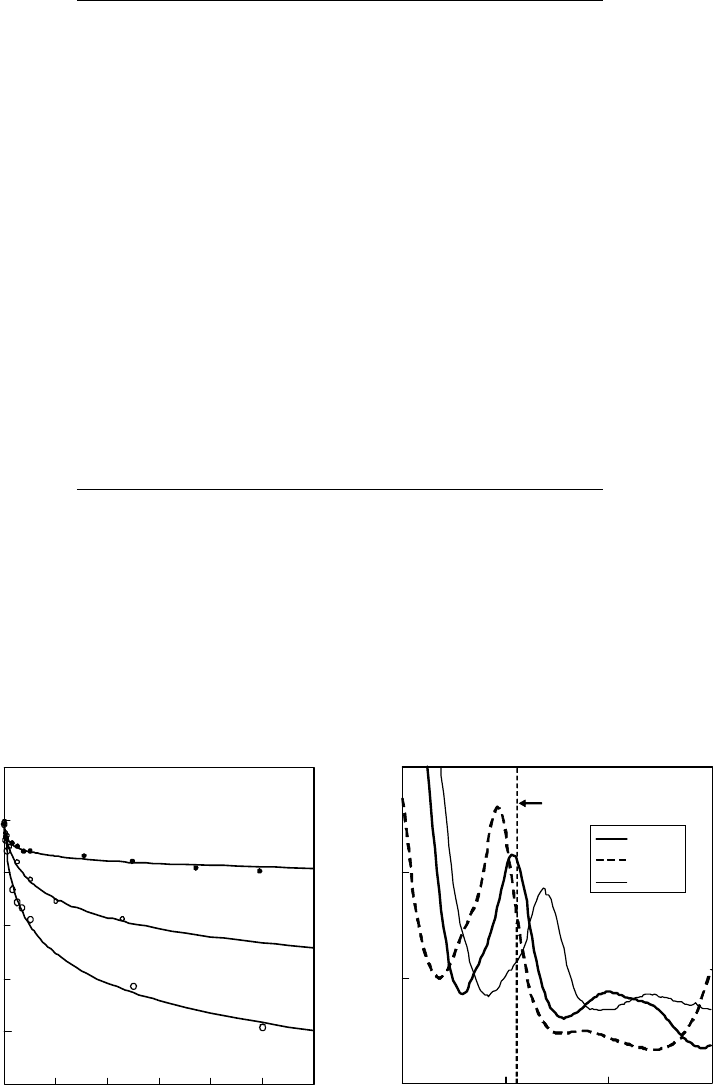
dependence of the surface tension of rhodamine solutions on the concentration is shown
in Figure 17.12a. The surface tension of each rhodamine aqueous solution decreases with the bulk
concentration. This clearly indicates that each rhodamine molecule is positively adsorbed to the
62
64
66
68
70
72
74
0 20 40 60 80 100 120
Concentration (µM)(a) (b)
Surface tension (mN/m)
R6G
RhB
Rh101
0
4
8
12
300 350 400 450
Wavelength (nm)
355 nm
: Rh6G
: RhB
: Rh101
Absorption coeff. (10
3
/cm/M)
Figure 17.12 (a) Concentration dependence of the surface tension for aqueous solutions of rhoda-
mine B chloride (RhB), rhodamine 6G chloride (R6G), and rhodamine 101 perchlorate (Rh101) at 25°C.
(b)Ultraviolet–visible
absorption spectra of aqueous solutions of rhodamine dyes.
table 17.2
adsorption
e
quilibrium
Coefcients K
ad
and signal intensity
Factors
(Q
max
and S
max
) evaluated from each experiment
dye polarization Q
max
(fC), S
max
(arb. units) K
ad
(10
5
m
−1
)
Two photon ionization measurements
Rhodamine
B s 87 6.1
p 72 7.4
Rhodamine 6G s 4.5 21
p 6.0 27
Second harmonic generation measurements
Rhodamine B s 2.3 4.1
p 3.9 4.0
Rhodamine 6G s 9.3 1.2
p 7.7 2.2
Note:
Q
max
, signal intensity factors of two-photon ionization measurements with
one unit of fC. The polarization is of the excitation laser. S
max
, signal
intensity factors of second harmonic generation measurements with an
arbitrary unit.

Ionization of Solute Molecules at the Liquid Water Surface 461
water surface. The curves are tting results of the experimental data to Equation 17.4. In Table 17.3,
the tting parameters K
ad
(M
−1
) and N
max
(mol/m
2
) are summarized for each rhodamine dye with
the specic molecular area A
min
(nm
2
/molecule) corresponding to N
max
. In calculating N
max
, ν = 1 is
assumed. At a neutral pH, the principal chemical forms of RhB, R6G, and Rh101 are zwitterion,
cation, and zwitterion, respectively. The assumption ν = 1 means that the surface activity of protons,
chloride
ions, and perchloride ions is neglected.
It
has been reported that the surface pressure–area isotherm of dioctadecyl-rhodamine B (RhB-
based water-insoluble rhodamine dye having two long hydrocarbon chains on two monoethylamino
groups) shows a collapse pressure at 0.26nm
2
/molecule (Slyadneva etal., 2001). This value is as
small as 10%, 1.6%, and 0.68% of A
min
of RhB, R6G, and Rh101, respectively. The fact indicates
that each rhodamine dye, especially R6G, has enough space at the water surface even when adsorp-
tion
is saturated. Strong interaction between dye molecules at the water surface could be expected.
The
ultraviolet absorption spectra of rhodamine dyes in Figure 17.12b shows that multiphoton
ionization at 355nm of each dye investigated is under a resonant condition. Although there is a pos-
sibility that the absorption peak of the rhodamine dyes at the water surface shifts from those of bulk
aqueous
solution, we disregard the possibility because no large spectral shift is expected.
In
discussing molecular orientation, it is important as well as useful to consider the direction of
the effective transition moment for TPI of rhodamine dyes because of the complexity of the two-
photon process. All the rhodamine dyes used have an absorption peak around 540nm, attributed
to a transition from the ground state to the rst singlet excitation state S
1
, whose transition dipole
moment is nearly parallel to the xanthene ring (x-direction in Figure 17.8) (Jakobi and Kuhn, 1962;
Peterson and Harris, 1989; Drexhage, 1997). The second singlet excitation state S
2
lies at around
350nm, and the transition dipole moment is nearly perpendicular to the xanthene ring (y-direction
in Figure 17.7) (Jakobi and Kuhn, 1962; Peterson and Harris, 1989; Drexhage, 1997). The excitation
wavelength of 355nm in the photoionization experiment is resonant with the transition to the second
singlet
excitation state S
2
.
The resonant two-photon photoionization process may be caused by both a simultaneous two-
photon process and a stepwise two-photon process, and the contributing ratio of both processes
depends on the intensity and pulse width of the excitation laser. In the simultaneous process, two-
photon absorption of the ground state molecules directly into a pre-ionization state via the interme-
diate S
2
state should be considered. In the stepwise process, three processes, that is, photoexcitation
to S
2
, relaxation from S
2
to S
1
, and photoionization from S
1
should be taken into consideration
in combination. Unfortunately, little is known of the directions of the transition moments for the
simultaneous two-photon absorption and stepwise S
2
absorption as well as of their contributing
ratio. Strictly speaking, we cannot identify the direction of the transition moment for the TPI of the
rhodamine dyes. However, a simple assumption can be considered: the direction is the same as that
table 17.3
some
p
roperties
of r
hodamine
d
yes
for a
dsorption
at the
w
ater
s
urface
at r
oom
t
emperature
(25°C) d
etermined
withsurface tension measurements by assuming the
l
angmuir adsorption
i
sotherm
dye K
ad
(10
5
m
−1
) N
max
(10
−7
mol/m
2
) A
min
(nm
2
/molecule)
Rhodamine
B 8.8 6.7 2.5
Rhodamine
6G 58 1.0 16.5
Rhodamine
110 6.3 4.3 3.8
Note:
K
ad
, equilibrium constant; N
max
, molecular density at the adsorption saturation;
and A
min
, specic molecular area at the adsorption saturation.
462 Charged Particle and Photon Interactions with Matter
of resonance photo-absorption, namely, the y-direction. This might be reasonable if the resonance
process dominates the two-photon absorption in the simultaneous process and if the transition from
S
2
to the pre-ionization state does not have large anisotropy.
A similar discussion can be made for the direction of the transition moment for SHG. The direction
is assumed to be parallel to that of the resonance photo-absorption, namely, the x-direction. Under
these assumptions, we could determine the averaged direction of adsorbed rhodamine molecules at
the water surface. Such a discussion has been reported for 1-pyrenehexadecanoic acid on the water
surface (Sato etal., 2001).
17.4.3 concentration-dependent orientation of dye Molecule at the water Surface
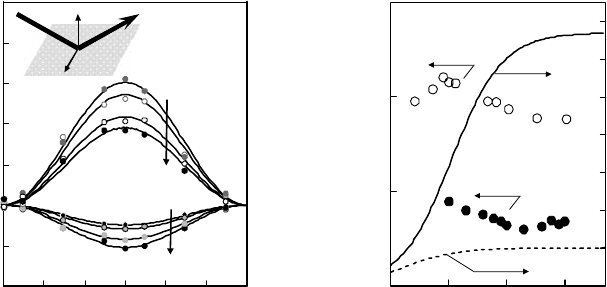
Figure 17.13a shows the dependence of the photoionization signal intensity I(θ) on the polarization
angle θ of the excitation laser with 84° of the incident angle (Seno etal., 2001; Harata etal., 2009).
Four different-concentration data sets are shown of aqueous solutions of each rhodamine dye. θ = 0°
and θ = 90° correspond to p- and s-polarized light, respectively: I
p
= I(θ = 0°) and I
s
= I(θ = 90°). The
curves are the tting results of the experimental data to sinusoidal functions. As seen, this function
describes each of the polarization dependences well. The arrows in Figure 17.13 indicate the order
of the sample concentrations noted on the right-hand side. It is notable that the polarization depen-
dence
does not monotonically change with the concentration.
In
Figure 17.13b, the ratio I
p
/I
s
of the photoionization signal intensity, representing the polariza-
tion dependence, is plotted as a function of the surface excess for aqueous solutions of RhB and
R6G. The surface excess is calculated with the concentration of the solutions using the adsorption
properties listed in Table 17.3. Notable features are that for each rhodamine dye, the I
p
/I
s
values
show a maximum or minimum around a point where the surface excess is just saturated and the I
p
/I
s
values decrease or increase gradually even under a much lower surface-excess condition than the
extreme point. The former indicates that the direction of the effective transition moment changes
with the surface excess, and the latter means that molecules on the water surface signicantly inter-
act
with each other even when they have enough free area for moving on the surface.
Ionization signal intensity I(θ)/I
s
Polarization angle θ (deg.)
0.6
0.8
1.0
1.2
1.4
1.6
1.8
–90 –60 –30 0 30 60 90
s
(a) (b)
sp
RhB
R6G
0.99 μM
4.0 μM
79 μM
20 μM
0.78 μM
0.52 μM
10 μM
100 μM
p
s
RhB
0.5
1.0
1.5
2.0
Concentration (μM)
0
0.7
0.6
0.5
0.4
0.3
0.2
0.1
0.1 1 10 100
R6G
Photoionization ratio (I
p
/I
s
)
Surface excess (μmol/m
2
)
RhB
R6G
Figure 17.13 (a) Dependence of the photoionization signal intensity I(θ) on the polarization angle θ of the
excitation laser at 355nm and 84° of incident angle for 4 sets of concentrations of an aqueous solution of rho-
damine dyes: rhodamine B chloride (RhB) and rhodamine 6G chloride (R6G). θ = 0° and θ = 90° for p- and
s-polarized light, respectively, and I
s
= I(θ = 90°). The curves are the tting results of the experimental data to
sinusoidal functions. The arrows indicate the order of the sample concentrations listed at the their right-hand side.
(b) Concentration dependence of the photoionization ratio I
p
/I
s
and surface excess for an aqueous solution of rho-
damine dyes, RhB and R6G. The surface excess is calculated with the adsorption properties listed in Table 17.3.
Ionization of Solute Molecules at the Liquid Water Surface 463
17.4.4 effective adSorption eQuilibriuM conStantS
It is not necessary for the adsorption equilibrium constants (effective adsorption equilibrium
constants), experimentally determined with a variety of methods, to agree with each other because
different types of interactions are used for these measurements. Surface tension measurements
providing surface excess are based on the thermodynamic equilibrium, for which the spatial distri-
butions of the concentration and orientation of molecules in the depth direction are not considered.
On the other hand, photoionization and SHG signals depend on the spatial distribution of mol-
ecules. As for photoemission, when the photoemitting groups of the dye molecules are positioned
as higher on the water surface, a larger photoionization signal is detected because of a smaller
disturbance from water molecules. As for SHG, when photoabsorbing chromospheres of the dye
molecules are positioned closer to the air–water boundary and are better oriented at the boundary,
a larger resonant-SHG signal is detected because of a larger second-order nonlinear susceptibility.
Consequently, the effective adsorption equilibrium constants determined with a variety of methods
and
experimental conditions reect the state and behavior of molecules at the water surface.
As
summarized in Tables 17.2 and 17.3, the adsorption equilibrium constants K
ad
of RhB deter-
mined by measurements of the surface tension, TPI and SHG, have the same order of magnitude
but K
ad
by TPI and SHG is 69% and 47% for s-polarized excitation (84% and 45% for p-polarized
excitation) of that by the surface tension, respectively (Seno et al., 2001; Harata et al., 2009).
The results have meaningful implications: the surface density of RhB molecules increases as the
bulk concentration increases even after surface-excess saturation, suggesting the existence of a
concentration gradient under the surface whose magnitude depends on the concentration, and the
orientation of dye molecules at the water surface depends on the bulk concentration, as discussed
before.
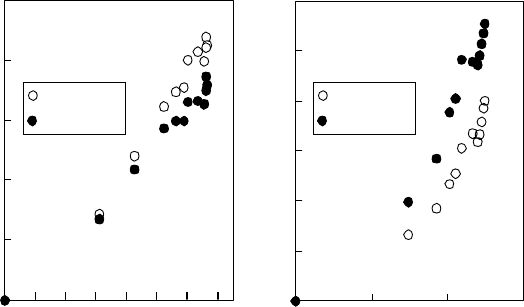
Figure 17.14a shows the dependence of the photoionization charge on the surface excess of
RhB on the water surface. Photoionization charges are larger than expected from a linear relation
between the surface excess and the charges both for s- and p-polarized excitation. It is qualitatively
explainable that, as bulk concentration increases, the RhB molecules rise up and adhere closer to
the gas phase.
The difference between the determined K
ad
values of R6G is more signicant than RhB: K
ad
by TPI
and SHG is 36% and 2.1% for s-polarized excitation (47% and 3.8% for p-polarized excitation) of that
by surface tension, respectively. Figure 17.14b shows the dependence of photoionization charge on the
surface excess of R6G on the water surface. Photoionization charges seem quadratically dependent on
0
20
40
60
80
100
0 0.2
(a) (b)
0.4 0.6
Surface excess (μmol/m
2
)
RhB
Ionization charge (fC)
0
1
2
3
4
5
6
0 0.04 0.08 0.12
R6G
Surface excess (μmol/m
2
)
Ionization charge (fC)
s-Polarized
p-Polarized
s-Polarized
p-Polarized
Figure 17.14 (a) Dependence of the photoionization charge on the surface excess of rhodamine B on water.
The surface excess is calculated with the adsorption properties listed in Table 17.2. (b) Dependence of the
photoionization
charge on the surface excess of rhodamine 6G on the water.
464 Charged Particle and Photon Interactions with Matter
the surface excess and are much larger than expected from a linear relation both for s- and p-polarized
excitation. The results can be explained by the same mechanism as RhB, although the concentration-
dependent changes of the concentration gradient and molecular orientation are large for R6G.
17.4.5 rhodaMine dyeS at the water Surface
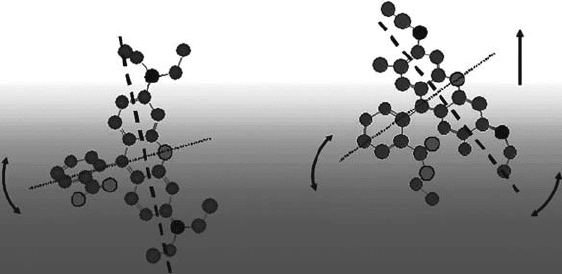
A rough sketch, based on the discussion above concerning the rhodamine dyes adsorbed at the water
surface,
is shown in Figure 17.15 (Harata, 2003). As the time and ensemble average, RhB and R6G
at the water surface have different orientations. The concentration-dependent behavior, indicated
by arrows in the gure, is also different. Even if two dye molecules are far apart from each other
at the water surface, some effective interaction is expected. It is noteworthy, of course, that further
discussion along with precise experiments and analyses is required even for the time- and ensemble-
averaged view of surface-adsorbed molecules. A dynamic view with uctuation of the orientation
and three-dimensional position of molecules and with adsorption–desorption behavior will be pre-
sented
in further studies.
17.5 deteCtion and monitoring oFmoleCules
at
the w
ater
s
ur
F
aCe
17.5.1 detection liMit of MoleculeS at the water Surface
by photoionization MeaSureMentS
Laser-based spectroscopic techniques generally provide high sensitivity in molecule detection even
for molecules adsorbed at the water surface. However, when surface-selective detection is required,
as in the case of detecting adsorbed liquid-soluble molecules on the liquid solution surface, three
main techniques are currently available: confocal laser uorescence, SHG, and TPI. For nonuo-
rescent or less uorescent molecules, there are two techniques. Second harmonic generation spec-
troscopy, the most popular technique for studying molecules on a liquid surface, is particularly
sensitive to the rst layer of the liquid surface. The second one is laser two-photon ionization
spectroscopy, which is sensitive for detection of probe molecules both in a bulk solution (Voigtman
etal., 1981; Voigtman and Winefordner, 1982; Yamada etal., 1982, 1983, 1986; Ogawa etal., 1992a,
1995) and on the surface of a solution (Masuda etal., 1993; Chen etal., 1994; Inoue etal., 1994;
Rhodamine B (RhB) Rhodamine 6G (R6G)
Figure 17.15 Rough sketch of rhodamine dyes at the water surface. The arrows indicate the direction of
molecular motion in increasing concentration in bulk solution. The short axis of the rhodamine B (RhB) mole-
cule is relatively parallel to the water surface, while the long and short axes of the rhodamine 6G (R6G) molecule
have large angles with respect to the water surface. With a concentration increase, RhB changes the direction of
the short axis, and R6G changes the directions of the long and short axes as well as the depth position.

Ionization of Solute Molecules at the Liquid Water Surface 465
Ogawa etal., 1994a,b; Gridin etal., 1998) or metal (Ogawa etal., 1992b). The sensitivities of these
two techniques are, however, different, as shown in Figure 17.2. The typical detection limit of a
solute molecule with the TPI technique was 0.25pmol/cm
2
(Ogawa etal., 1992b), while that with
the SHG technique was 5.0pmol/cm
2
(Inoue etal., 1995).
It is important to estimate the detection limit of a target molecule theoretically or empirically. The
detection limit of molecules at the water surface by TPI measurements depends on the properties of
target molecules as well as the experimental conditions, which include the absorption coefcient ε at
the excitation wavelength, the photoionization threshold E
th
, the energy of the rst excited singlet state
E
S
1
, and the adsorption coefcient K
ad
. It is natural to assume that the detection limit expressed as the
bulk concentration is inversely proportional to ε E
excess
n
K
ad
, where n is the exponent given in Equation
17.9 and E
excess
is excess energy in photoionization relating to photon energy hν. For a stepwise TPI
process, E E h E
excess S th
= + −( )
1
ν , and E
excess
= 2hν − E
th
for simultaneous TPI. Even if well-dened
experimental conditions are adjusted, it is often the case that some of the properties of the target
molecules are unknown. Especially, few reference values are available for K
ad
of targets. It is not easy
to obtain solubility data either. To roughly evaluate K
ad
, n-octanol and the water partition coefcient
P(o/w) may be useful because P(o/w) is easily estimated as an indicator of water solubility.
Table 17.4 is a summary of the detection limits of some chemicals on the aqueous solution sur-
face (Inoue etal., 1994; Maeda etal., 2005; Maeda, 2006), along with the molecular absorptivity,
excess energy, and n-octanol and water partition coefcient. As shown, there is no good correlation
between the detection limit and ε, E
th
, or log P(o/w), but some tendencies to a higher detection limit
are seen for chemicals with higher ε and higher log P(o/w). This could be a measure of estimating
the
detection limit, which may be applicable even for molecules with unknown properties.
17.5.2 acid–baSe eQuilibriuM conStant of MoleculeS at the water Surface
Two-photon photoionization measurements have been used to determine the acid–base equilibrium
constants of the molecules on the water surface and the distribution coefcients of neutral species
and ionized species between the surface and bulk water (Sato etal., 2000, 2004). The photoionization
table 17.4
detection
l
imit
(3
- 2008 — 2026 «СтудМед»