Hatfield J.L., Gandini A. (eds.) Nitrogen in the Environment
Подождите немного. Документ загружается.

Transformation and Transport Processes of Nitrogen in Agricultural Systems 23
factors affecting the amount of NH
3
loss to the atmosphere. As soil pH increases
above 6.0 the NH
3
form, as a fraction of soil-solution NH
4
plus soil-solution NH
3
,
increases by an order of magnitude; thus, increasing the loss of soil-solution NH
3
to
the atmosphere. As summarized by Stevenson (1986) , NH
3
volatilization:
1. Is of most importance on calcareous soils, especially as soil pH exceeds 7.
2. Losses increase with temperature and can be appreciable for neutral or alka-
line soil as they dry out.
3. Is greater in soils of low cation exchange capacity (CEC), such as sands.
4. Losses can be high when high N organic wastes, such as manure, are permit-
ted to decompose on the soil surface.
5. Losses are high from urea applied to grass or pasture as a result of hydrolysis
of the urea to NH
3
by indigenous urease enzyme.
6. Loses of soil- and fertilizer-N are decreased by growing plants.
Anhydrous, or gaseous, NH
3
is a very important direct-application N fertilizer.
Gaseous NH
3
when in contact with moist soil, dissolves in, and reacts with, soil water
to form NH
4
and OH
ions. The pH is increased dramatically immediately around
the application zone of anhydrous NH
3
. Therefore, depending on buffering capacity
of the soil and the resulting soil pH, equilibrium is approached between soil-solution
NH
4
and NH
3
in the soil solution and gaseous NH
3
. If anhydrous NH
3
is placed in
dry soil or at too shallow a depth, the NH
3
is also subject to volatilization. However,
the N that is in NH
4
form is readily sorbed to the CEC of the soil.
2.3.2 . Denitrification
When organic matter in soil decomposes first NH
4
, then NO
2
and finally NO
3
ions form by the process of nitrification ( Figure 2 ). Nitrite usually does not accu-
mulate in soils because it is rapidly transformed to NO
3
or is denitrified to N
2
gas,
nitrous oxide (N
2
O) or nitric oxide (NO). Nitrate can also be lost to the atmosphere
through the denitrification processes. Nitrous oxide is a product of incomplete deni-
trification and is a greenhouse gas identified as contributing to global warming. The
importance of N
2
O is as a long-lived greenhouse gas whose major anthropogenic
source is from agriculture. For example, about 72% of US emissions of N
2
O are from
agricultural sources ( US EPA, 2005 ). About 5% of the total atmospheric greenhouse
effect is attributed to N
2
O of which ⬃ 70% of the annual global anthropogenic emis-
sions are reported to come from animal and crop production ( Mosier, 2001 ). The cli-
mate forcing potential, used to estimate the warming potential of N
2
O, is that it is
296 times that of atmospheric carbon dioxide (CO
2
) during 100 years ( IPCC, 2001 ).
Anthropogenic sources of N
2
O were estimated to have been 5.7 and as 6.9 TgN/year
in 1980 and 1990, respectively ( IPCC, 1996 ; IPCC, 2001 ). The atmospheric burden
of N
2
O continues to increase by about 0.25% per year ( IPCC, 2001 ). Following its
transport to the stratosphere, N
2
O is oxidized to nitric oxide (NO) that in turn cata-
lyzes the destruction of stratospheric ozone (O
3
) ( Hutchinson, 1995 ).
CH02-P374347.indd 23CH02-P374347.indd 23 5/31/2008 5:53:21 PM5/31/2008 5:53:21 PM

24 Nitrogen in the Environment
Biogenic production in soil is a principle source of atmospheric N
2
O. In addi-
tion, several factors affect the ratio of N
2
O to N
2
during denitrification ( Table 1 ).
Anaerobic soil processes, rather than nitrification (an aerobic process) are the prin-
ciple biogenic sources of atmospheric N
2
O ( Freney et al., 1979 ; Goodroad and
Keeney, 1984 ; Klemedtsson et al., 1988 ). Denitrification is a bacterial process, dur-
ing which NO
3
or NO
2
are reduced to gaseous N species NO, N
2
O or N
2
, and is
capable of producing and consuming N
2
O and NO. Nitrate is reduced first to NO
2
,
then to NO, next to N
2
O and finally to N
2
( Eq. 1 ).
NO
NO NO X N O N
↑
→→→→
32 22
[]
(1)
Table 1.
Factors affecting the proportion of N
2
O and N
2
produced during denitrification.
Factor Will Increase N
2
O/N
2
[NO
3
] or [NO
2
]
Increasing oxidant
[O
2
] Increasing O
2
Carbon Decreasing C availability
pH Decreasing pH
[H
2
S] Increasing sulfide
Temperature Decreasing temperature
Enzyme status Low N
2
O reductase activity
Not only denitrification (a reductive process), but also the oxidative process of
nitrification causes emission of a small amount of N
2
O ( Tortoso and Hutchinson,
1990 ). However, denitrification is the route for most losses of gaseous N compounds
to the atmosphere. The potential for denitrification is increased as oxygen levels in
the soil decreases. Under favorable environmental conditions, Nitrosomonas spp.
bacteria in the soil readily transform NH
4
to NO
2
that in turn is transformed by
Nitrobacter spp. bacteria to NO
3
( Figure 2 ). The small quantity of N
2
O produced
during nitrification of NH
4
in aerobic soils is a direct metabolic product of chemo-
autotrophic NH
4
-oxidizing bacteria or results from other soil processes dependent
on these organisms as a source of NO
2
( Tortoso and Hutchinson, 1990 ).
The general conditions required for denitrification to occur include: (a) pres-
ence of bacteria possessing the metabolic capacity; (b) availability of suitable
reductants such as organic carbon; (c) restriction of O
2
availability; (d) availability
CH02-P374347.indd 24CH02-P374347.indd 24 5/31/2008 5:53:21 PM5/31/2008 5:53:21 PM

Transformation and Transport Processes of Nitrogen in Agricultural Systems 25
of N oxides, NO
3
, NO, or N
2
O ( Klemedtsson et al., 1988 ; Firestone and Davidson,
1989 ; Mosier, 2001 ). Either the NH
4
or NO
3
form can potentially contribute to
the release of N
2
O to the atmosphere, especially where excess NO
3
accumulates in
the soil profile and is available for denitrification. Because N
2
O is the greenhouse
gas of concern, the proportion of N
2
O produced relative to N
2
under denitrifying
conditions becomes of special concern. A number of factors affect the proportion
of N
2
O to N
2
. A model by Betlach and Tiedje (1981) predicts accumulation of N
2
O
whenever one of the factors shown in Table 1 slows the rate of overall reduction.
3 . TERRESTRIAL TRANSPORT AND RELATED PROCESSES
3.1 . Fertilizer and Manure
The NH
4
cation in highly water-soluble compounds that contain NH
4
( Table 2 )
can be sorbed to the CEC, incorporated (fixed) into clay and other complexes within
the soil, released by weathering back into the available mineral pool, or immobi-
lized into organic form by soil-microbial processes. Ammonium that is associated
with soil colloids can be transported from its original location and deposited by
water and/or wind erosion processes or, under certain conditions, volatilize into the
atmosphere as NH
3
gas and be aerially transported across the landscape, including
into surface water. Gaseous NH
3
often is returned to the soil-plant system by direct
uptake into plant leaves or dissolved in precipitation. Urea and calcium cyanamide
( Table 2 ), are forms of N that, when applied to soil, are acted upon by enzymes in
the soil to mineralize the N in them to NH
4
ions. Once in the NH
4
form and until
nitrified to the NO
3
ion form, the N in these two fertilizers is also sorbed to the
CEC, the negatively charged sites on soil colloids, and is subject to transport by soil
Table 2.
Nitrogen fertilizer materials, their formulas, and chemical analysis
Material
Chemical Formula
Chemical
Analysis (%N)
Anhydrous ammonia NH
3
83
Ammonium nitrate NH
4
NO
3
33.5
Ammonium sulfate NH
4
SO
4
21
Diammonium phosphate (NH
4
)2H
2
PO
4
18–21
Monoammonium phosphate NH
4
H
2
PO
4
11
Calcium nitrate Ca(NO
3
)
2
15
Calcium cyanamide CaCN
2
20–22
Potassium nitrate KNO
3
13
Sodium nitrate NaNO
3
16
Urea CO(NH
2
)
2
45
Urea-ammonium nitrate CO(NH
2
)
2
+ NH
4
NO
3
32
CH02-P374347.indd 25CH02-P374347.indd 25 5/31/2008 5:53:21 PM5/31/2008 5:53:21 PM
26 Nitrogen in the Environment
erosion. The N in organic materials such as crop residues is also first mineralized
to NH
4
, again being subject to sorption to the CEC of the soil until nitrified to the
NO
3
. The NO
3
ion, when it is part of the chemical formula in compounds shown
in Table 2 , does not sorb to the CEC of the soil. Nitrate, a water-soluble anion, is
very mobile, and moves readily in dissolved form. The primary transport mecha-
nism for
NO
3
ions is by leaching or surface runoff (including return flow). Nitrate
that is leached below the crop-root zone often ends up as a pollutant in groundwa-
ter supplies. Nitrate can also be dissolved in surface runoff water or in return-flow
water that returns to the surface to become part of the runoff. Nitrate and NO
3
ions
can also be denitrified and lost to the atmosphere as NO, N
2
O, or N
2
( Eq. 1 ).
3.2 . Runoff
Amount and timing of rainfall and soil properties are key factors that influ-
ence loss of dissolved N in runoff. Landscape and soil permeability affect infiltra-
tion rates. Soils with low runoff potential usually have high infiltration rates, even
when wet. They often consist of deep, well- to excessively-drained sands or gravels.
Amount of water infiltration will depend on initial soil water content, soil organic
matter (SOM), soil structure, and soil texture. In contrast, soils with high runoff
potential have one or more of the following characteristics: very slow infiltration
rates when thoroughly wetted and containing high clay content possibly of high
swelling potential, high water tables, a claypan or clay layer at or near the surface,
or are shallow over a nearly impervious subsurface layer. A combination of soil con-
ditions of high runoff potential and high precipitation amounts are especially condu-
cive to surface runoff losses. Steeper slope gradients increase amount and velocity of
runoff, while depressions, soil roughness, and presence of vegetative cover or crop
residue decrease runoff by improving the infiltration. Williams and Kissel (1991)
studied the relationship between soil permeability and surface runoff across several
climates. Soils with higher infiltration rates are classified as Hydrology Group A;
well- to excessively-drained sands or gravel soils with low runoff potential. Opposite
to this is Hydrology Group D that is represented by high-clay; often poorly to very
poorly drained soils that have a high runoff potential. Concentration of dissolved
N in surface runoff from soils under conservation or no-tillage often is higher than
from soil under conventional tillage ( Romkens, 1973 ; McDowell and McGregor,
1984 ). Reasons may include incomplete incorporation of surface-crop residues, and
higher dissolved N concentration in the surface soil because of residue accumulation
and decomposition. Also, high concentrations of soluble N can occur when there is
a soil horizon barrier (e.g., Fragipan) present in the soil profile that results in return
flow of leached N back to the soil surface ( Lehman and Ahuja, 1985 ).
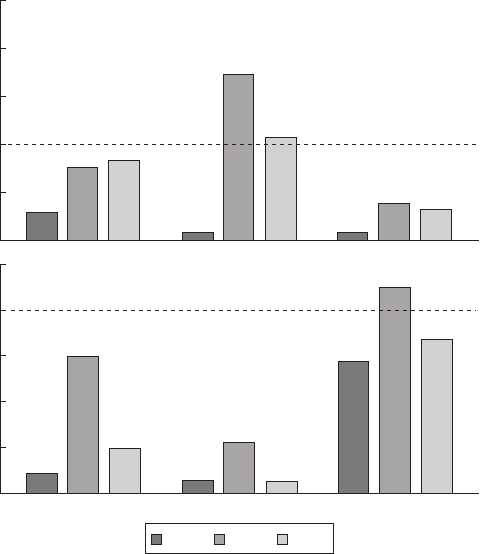
Some of the effects on dissolved nutrients in surface and subsurface water dis-
charges that are associated with agricultural nutrient management for crop production
and the use of conservation tillage for erosion control are illustrated ( Figure 3 ) by
the work of Alberts and Spomer (1985) . Their study site, for this 10-year study, was
in the deep loess hills in western Iowa. The loess is underlain by nearly impervious
CH02-P374347.indd 26CH02-P374347.indd 26 5/31/2008 5:53:21 PM5/31/2008 5:53:21 PM
Transformation and Transport Processes of Nitrogen in Agricultural Systems 27
glacial till at depths of 4.6 to 24.4 m. Lateral water movement occurs in a saturated
soil zone that exists at the loess-till interface. Water from both surface runoff and sub-
surface flow was sampled. In their study, watershed 2 (WS2) was conventionally tilled
(33.5 ha) while watersheds 3 and 4 (WS3 and WS4) were contour-till planted (43.3 h a )
and terrace-till planted (60.8 ha), respectively. About 65 head of cattle gleaned the
corn stalks from WS3 and WS4 from mid-November to March each year.
25
20
15
10
5
0
2.5
2.0
1.5
1.0
0.5
0.0
NH
4
-N NO
3
-N
Period 1 Period 2 Period 3
Nutrient concentrations in surface flow (mg / L)
WS2 WS4WS3
Figure 3 . Runoff-weighted concentrations of NO
3
-N and NH
4
-N in surface flow
by seasonal period. Dashed lines represent current water quality standards. (From
Alberts and Spomer, 1985 ).
Figure 3 shows the 10-year, runoff-weighted concentrations of NO
3
and NH
4
for three time periods; April through June (fertilization, seedbed preparation, and
crop establishment period); July through November (crop reproduction and matura-
tion period); and December through March (crop residue period) or periods 1, 2,
CH02-P374347.indd 27CH02-P374347.indd 27 5/31/2008 5:53:21 PM5/31/2008 5:53:21 PM
28 Nitrogen in the Environment
and 3 respectively. Water quality criteria for NO
3
and NH
4
are shown by dashed
lines ( US EPA, 1982 ; Fletcher, 1991 ) in Figure 3 as 10 and 2 mg/L; respectively.
Highest NO
3
concentrations from the till-planted watersheds (WS3 and WS4)
occurred during July through November (period 2), perhaps as a result of evapora-
tive drying moving previously applied fertilizer salts to the soil surface. Preplant
applications of fertilizer for the conventionally tilled watershed (WS2) had been
incorporated with a disk. Ammonium N concentrations were generally from cattle
manure and leaching of NH
4
from partially decomposed corn stalks. Issues illus-
trated by this study include the need to place fertilizer below the soil surface while
still maintaining residue cover for soil erosion control. Fall and winter livestock
grazing of crop residues likely contributes to N runoff since the manure and urine
may be deposited on frozen ground.
3.3 . Erosion
Detachment of sediments and nutrients from the parent soil is selective for
soluble nutrients (such as NO
3
) and for the fine soil fractions to which nutrients
(such as NH
4
and the SOM N) are associated. Therefore, N contained in runoff
and/or associated with sediments is present in higher concentrations than in the par-
ent soil. This difference is termed the enrichment ratio. Enrichment of sediment
loads is a two-step process: enrichment during particle suspension and enrichment
due to re-deposition of coarser particles during overland and channel flows. In order
for management practices to decrease the effect of water erosion processes on the
production and transport of sediment associated N, they must directly influence the
processes involved. Such practices need to protect against soil particle detachment,
slow sediment transport, and enhance sediment deposition within the landscape
rather than allowing the sediments to move into surface water.
Soil erosion is important to the movement of N into surface water that primarily
occurs with soil erosion by water, rather than by wind. Briefly, soil erosion by water
includes the processes of detachment, transport, and deposition of the soil particles
by raindrops or surface flow ( Foster et al., 1985 ). Some sediment may travel only
a few millimeters while other sediment may be transported long distances before
either being deposited or reaching a lake, reservoir, or stream. Movement of NH
4
results because it is sorbed to the surfaces of clays and finer sediments. The NO
3
is
completely water soluble and thus moves with the water until it re-enters the avail-
able soil pool, is utilized by microbes or plants, becomes denitrified, is possibly
deposited and buried, or enters and possibly degrades surface and/or groundwaters.
A major source of the N that degrades surface water is that which is transported in
SOM. A large part of the SOM and soil organic N (SON) contained in it are con-
centrated near the soil surface and are therefore vulnerable to erosion and oxidative
(mineralization/nitrification) processes. Within the United States, about 400 mil-
lion m
3
of sediment are dredged each year in the maintenance and establishment of
waterways and harbors ( Sopper, 1993 ). Two independent methods of estimating the
amount of eroded SON in sediments are to utilize information about river sediment
CH02-P374347.indd 28CH02-P374347.indd 28 5/31/2008 5:53:21 PM5/31/2008 5:53:21 PM
Transformation and Transport Processes of Nitrogen in Agricultural Systems 29
loads or to use estimates of amounts of eroded sediments themselves. To use the
sediment load approach for 1991 data collected by Leeden et al. (1991) show the
suspended load in 12 major rivers in the United States were 336 Tg/year. Assuming
75% of the suspended load is mostly from soil erosion from cropland the amount
of sediment transport attributed to cropland was ⬃ 250 Tg/year. Assuming a deliv-
ery ratio of 10% and SON content of sediment of 0.25% ( Follett et al., 1987 ; Lal,
1995 ), the total SON displaced by soil erosion from cropland was about 6.25 T g /
year. Alternatively, ( Lal et al., 1998 ) used an estimate of the amount of eroded
sediments to calculate soil organic carbon (SOC) losses. By assuming a SOC:SON
of 110:9 in sediment ( Follett et al., 1987 ) the total SON displaced by soil erosion
would be about 9.6 Tg/year. Thus considering only the United States, soil erosion
serves as an environmental source of 6–9 Tg/year as SON.
Much still needs to be learned about managing cropland soil erosion. For exam-
ple, Follett et al. (1987) assessed effects of tillage practices and slope on amount of
organic N in eroded sediments from cultivated land surfaces in Minnesota (USA)
for major land resource areas (MLRAs) 102, 103, 104, and 105. Their estimates
using the Universal Soil Loss Equation with average organic matter in topsoil by
slope category, dominating slope gradient, and soil series indicates that conservation
tillage compared to conventional tillage decreases the amount of organic N associ-
ated with eroded sediments by about half with some additional decrease resulting
from the use of no-tillage. One can assume that added fertilizer N responds simi-
larly to organic N when it is sorbed to clay surfaces, finer sediments, or to SOM.
3.4 . Leaching
Nitrate is a negatively charged ion that is repelled by, rather than attracted to the
negative charged clay mineral surfaces in soil (i.e., the CEC). It is the primary form
of N leached into groundwater, is totally soluble at concentrations found in soil, and
moves freely through most soils. Movement of NO
3
through soil is governed by
convection of soil solution (i.e., mass-flow) and by diffusion within the soil solu-
tion Jury and Nielson (1989) . The widespread appearance of NO
3
in groundwater
is a consequence of its high solubility, mobility, and easy displacement by water.
An extensive literature about N-management, leaching, and groundwater qual-
ity includes that by CAST (1985) , Follett (1989) , Follett et al. (1991) , Follett and
Wierenga (1995) , and Delgado et al. (2005) . In addition, it is well documented that
NO
3
-N leaching rates will be affected by rain, irrigation, tile drainage, and water
table fluctuations during the growing season ( Meisinger and Delgado, 2002 ).
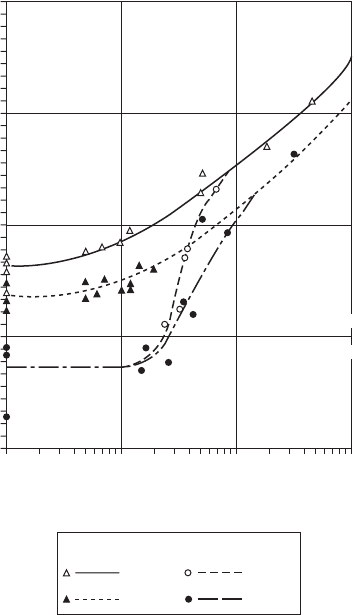
Juergens-Gschwind (1989) reported on leaching losses observed under widely
varying conditions (lysimeters, drainage water measurements in field trials, catch-
ment areas, profile and groundwater research in field trials) ( Figure 4 ). The results
were made comparable by referencing the N-losses at each site to a ⬃ 300 mm
drainage level per year. The leaching risk was distinctly higher on arable land than
on grassland, and on lighter textured soils than on heavy-textured soils. An upward
shift in the data was observed when going from lower nutrition rates obtained by
CH02-P374347.indd 29CH02-P374347.indd 29 5/31/2008 5:53:21 PM5/31/2008 5:53:21 PM
30 Nitrogen in the Environment
normal fertilization practices to the very high rates that can result from exces-
sive N-fertilization and animal manure disposal (rates in excess of the plant nutri-
ent requirements) on agricultural lands. Soil texture influences how rapidly NO
3
leaching through soil can occur. This influence of soil texture, in sandy soils is doc-
umented by Delgado et al. (1999) in which more NO
3
leaching was observed on a
loamy sand than on a sandy loam. Also, unless the soil is anaerobic, excess amounts
of NO
3
also leach on heavy-textured soils, as illustrated in an N-rate study with
irrigated corn ( Zea mays L.) by Godin (1999) . Godin used
15
N-labeled fertilizer on
a clay loam soil, he observed that the recommended fertilizer rate (135 kg N/ha) ade-
quately satisfied the crop N requirement and resulted in higher percent recovery of
10
4
10
3
10
2
10
1
10
1
10
2
10
3
10
4
1
Leaching
(kg N/ha /year)
Applied mineral nitrogen
(kg N/ha /year)
Drainage water appr. 300 mm /year
Groundwater 1 m below ground level
Arable Grassland
(sand) (sand)
(clay) (clay)
Figure 4 . Leaching of nitrogen from arable and grassland systems. (Adapted from
Juergens-Gschwind, 1989 ).
CH02-P374347.indd 30CH02-P374347.indd 30 5/31/2008 5:53:21 PM5/31/2008 5:53:21 PM
Transformation and Transport Processes of Nitrogen in Agricultural Systems 31
N than did the excess N rate (200 kg N/ha). At the excess N rate, fertilizer
15
N had
leached below the crop root zone (0.9 m) by harvest of the first year and to a depth
of over 1.5 m by harvest of the second year.
4 . NITROGEN CYCLING IN PASTURE SYSTEMS
Inputs of N into pasture systems include from fertilizer, manure, BNF, wet and
dry deposition, supplemental feed to livestock, and mineralization of SOM ( Figure 2 ).
Losses may occur through harvest of animal or plant products, transfer of N within
the pasture with animal excreta, fixation of N in the soil, soil erosion, surface run-
off, leaching, volatilization, and denitrification. The soil compartment includes a
pool of available N (NO
3
and NH
4
) for plant uptake that can exchange with N
in residues (organic N) and, for some soils, with fixed NH
4
held between mineral
layers of clay. Plant N-uptake is from the available soil pool. The N in the herbage
is either harvested and removed from the field, returned to the soil as crop residue
and root material, and/or eaten by grazing animals and either utilized by the animal
or excreted as feces or urine and returned to the soil.
4.1 . Role of Soil Organisms
Soil microfauna and microflora have a major role in N cycling. Release of N
from plant and animal residue depends on microbial activity. Soil bacteria utilize
the more readily available, soluble, or degradable organic fractions. Fungi and
actinomycetes decompose the resistant cellulose, hemicellulose, and lignin. Dung
beetles, earthworms, and other soil fauna increase the decomposition rates of feces
and plant litter by mixing them with soil. Rhizobia and vesicular arbuscular mycor-
rhizae (VAM) associate with plant roots to fix N and increase nutrient and water
scavenging ability, respectively. VAM infection of roots is considered more help-
ful for tap rooted pasture legume species than for fibrous rooted grasses. At any
time, soil-microbial biomass contains much of the actively cycling N of the soil
and represents a relatively available N pool, capable of rapid turnover ( Bristow and
Jarvis, 1991 ). The energy flux through the soil microbial biomass (SMB) drives
the decomposition of organic residues ( Smith and Paul, 1990 ) and SOM. Plant
root biomass and soil-microbial processes are intimately linked in grassland sys-
tems as described by Reeder et al. (2000) . If decomposition exceeds carbon inputs,
the SOM will decline. The resulting mineralization of N (and other nutrients) will
result in their becoming vulnerable to possible losses into the environment by leach-
ing, denitrification, or other mechanisms ( Follett et al., 1995 ). Because its levels are
relatively stable for a particular soil/land-use system, even though the SMB pool is
very active for nutrient cycling, SMB can serve as a measure (index) of the effects
of agricultural management practices on soil quality. In their study, Follett et al.
(1995) utilized
15
N labeled fertilizer and followed the N in the SMB fraction under
no-till in a 4-year (winter wheat-sorghum-fallow-winter wheat) cropping sequence.
Their conclusion was that, under no-till, biological processes conserved the N by
CH02-P374347.indd 31CH02-P374347.indd 31 5/31/2008 5:53:21 PM5/31/2008 5:53:21 PM
32 Nitrogen in the Environment
accumulation of crop residue carbon and N near the soil surface by recycling of N
through the crop-SMB system, and maintenance of N in organic forms.
4.2 . Role of the Grazing Animal
Grazing animals affect plant growth by defoliation, traffic patterns, herbage
fouling, partitioning of ingested N to body weight, feces, and urine, re-distribution
of herbage N in excreta, and N turnover rate. Defoliation by grazing animals pre-
vents senescence of plant tissue, removes N in animal products, changes the N path-
way from internal plant recycling or leaf fall to return as feces and urine, increases
light penetration into the canopy and, through selective grazing, may alter botanical
composition by promoting one species over another. Animal traffic may contribute
to soil compaction and sometimes contributes to less desirable soil characteristics
for plant growth. Herbage fouling by feces reduces its acceptability for grazing,
thereby increasing maturity and reducing forage quality and/or consumption by
grazers. Urine does not cause herbage to be unacceptable for grazing. Livestock
recycle much of the N that they consume from forage back to the soil. The N reten-
tion of forage N by livestock, as a percentage of dietary intake, ranges from about
8% of live weight gain (LWG) (e.g., in steers) to 20% ( Follett and Wilkinson,
1995 ) in high producing animals (e.g., milk cows). For example, a 250 kg steer that
ingests 6 kilogram of forage per day (containing 3% of nitrogen in the forage) and
gaining 0.8 kg/day may ingest 180 g N/day, retain about 20 g in LWG (12% reten-
tion) and excrete the remainder, about 160 gram of nitrogen per day. Excretion
as feces and urine both result in volatile losses of NH
3
. About 74% of the total N
excreted is in the urine ( Follett and Wilkinson, 1995 ) and a single urine spot can
have an N concentration corresponding to more than 600 kg N/ha ( Whitehead,
1995 ). Some of the N is released to the atmosphere as volatile NH
3
while the N
remaining in the excreta and its associated plant residues return to available nutrient
pools in the soil.
Animals on range may utilize more of the forage near watering points. Greater
density of dung and increased levels of soil profile NO
3
are frequently observed in
areas near watering and shade points ( Wilkinson et al., 1989 ; Haynes and Williams,
1993 ). Even without transfer of N to unproductive areas such as woods, shade, watering
points, fence lines, and paths, consumption and excretion of N by ruminants results
in gathering of N from large areas of the pasture, and deposition of the N to smaller
areas. This gathering effect results in less efficient re-distribution of N for subsequent
uptake by forage plants. On an annual basis, less than 35% of pasture areas receives
excretal N and some areas receive one or more applications (overlapping of excreta).
Thus some of the pasture area is under fertilized and some over fertilized.
5 . PRIMARY AND SECONDARY FLOWS OF NITROGEN
Primary and secondary flows of N are very much a part of the animal/plant
N cycling ecosystem as discussed above. The following discussion is focused on
CH02-P374347.indd 32CH02-P374347.indd 32 5/31/2008 5:53:22 PM5/31/2008 5:53:22 PM