Henini M. Handbook of Self Assembled Semiconductor Nanostructures for Novel devices in Photonics and Electronics
Подождите немного. Документ загружается.

Self-organized Quantum Dot Multilayer Structures 39
With further increasing spacer thickness, the lateral ordering of the dots becomes weaker and
weaker until at about 600 Å no lateral ordering (see Fig. 1.25d ) and not interlayer correlations
are observed any more. The latter is illustrated by the cross-sectional transmission electron
microscopy image of a superlattice with 680 Å spacers depicted in Fig. 1.25g , where obviously
the dots in each layer nucleate at random sites independent of the dots in the previous layers.
Thus, these superlattices represent merely a repetition of uncorrelated single dot layers and
therefore, no dot rearrangements or lateral ordering occurs. As a consequence, the average lat-
eral dot spacing on top of the superlattice stack (full circles in region III of Fig. 1.25e ) is always
equal to the constant value of about 500 Å as found for single dot reference layers grown under
the same conditions.
1.8.2 Lateral ordering
1.8.2.1 Fcc -stacked superlattices
For PbSe/PbEuTe dot superlattices with intermediate spacer thicknesses between 420 and 520 Å
the remarkably effi cient lateral ordering process is illustrated in Fig. 1.26 , where the atomic force
microscopy images of the last PbSe dot layer of series of superlattices consisting of N 1, 10, 30
and 100 periods are depicted [30] . In theses samples, the PbSe and Pb
1
x
Eu
x
Te layer thicknesses
were kept constant at 5 ML and 470 Å, respectively, and identical growth conditions were used.
As shown in Fig. 1.26a , for the single layer N 1 the islands are distributed randomly on the
surface without any preferred lateral correlation direction. With an increasing number N of peri-
ods, a rapidly progressing ordering sets in. Already after ten periods, the dots are aligned in single
and double rows along the
〈〉110
directions ( Fig. 1.26b ). Measurements on samples with fewer
than ten bilayers show that this ordering commences fi rst with the formation of small patches of
hexagonally ordered regions, which subsequently enlarge and join to form row-type structures.
With further increasing period number ( Fig. 1.26c and d ), larger and larger ordered regions are
formed, such that for samples with large N the perfect hexagonal 2D arrangement is disrupted
only by single point defects, such as missing dots, dots at interstitial positions, or occasionally by
additionally inserted dot rows ( “ dislocations ” ) (see Fig. 1.26d for N 100 periods).
h 89 Å
14%
h 119 Å
27%
h 120 Å
18%
h 120 Å
10%
5
6
2
(a) N 1
1
6
4
3
1
0
200150100500
PbSe dot height h (Å)
200150100500
PbSe dot height h (Å)
200150100500
PbSe dot height h (Å)
200150100500
PbSe dot height h (Å)
Density (m
2
)
FFT FFTFFT FFT ACACFACAC
[110]
[112]
(b) N 10
(c) N 30
(d) N 100
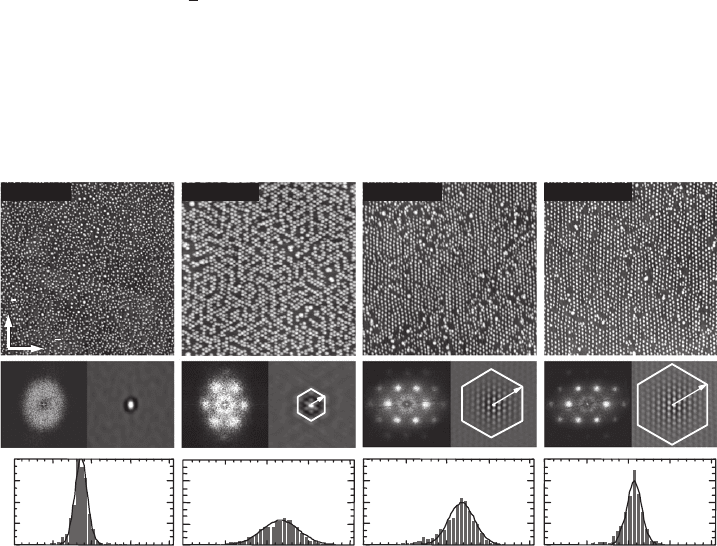
Figure 1.26 Top row : Atomic force microscopy images of PbSe/PbEuTe superlattices with increasing number of
superlattice periods of N 1, 10, 30 and 100 from (a) to (d), respectively. Each bilayer consists of fi ve monolayers
PbSe dots alternating with 480 Å PbEuTe spacers (image size: 3 3 μ m
2
). Centre row : Fourier (FFT) power spectra
(left) and 1 1 μ m
2
auto correlation (AC) spectra (right) of the atomic force microscopy images characterizing
the hexagonal lateral ordering process. Bottom row : Corresponding dot height histograms deduced from the
atomic force microscopy images. The full lines represent Gaussian fi ts of the histograms. See Pinczolits et al. [30] for
details.
CH001-I046325.indd 39CH001-I046325.indd 39 6/25/2008 12:27:40 PM6/25/2008 12:27:40 PM

40 Handbook of Self Assembled Semiconductor Nanostructures for Novel Devices in Photonics and Electronics
The development of the lateral ordering was characterized by Fourier transformation (FFT) as
well as auto correlation (AC) analysis, as shown in the middle panel of Fig. 1.26 . For the single
dot layer, the FFT power spectrum exhibits only a broad and diffuse ring that indicates an average
in-plane dot distance of 800 Å without any preferred nearest neighbour direction. The relative
width (FWHM) of this ring is 47%, which indicates a substantial variation of the lateral dot
separations. Also, the autocorrelation spectrum does not exhibit any structure outside the cen-
tral maximum, indicating the lack of any correlations in the lateral dot positions. In contrast,
for the ten bilayer sample the FFT spectrum ( Fig. 1.26b ) already shows six well-separated side
maxima. This corresponds to a preferred spacing between the dot rows of 488 Å. Six side maxima
also appear in the autocorrelation spectrum, indicating that the next nearest neighbour dots are
along the
〈〉110
directions, with a preferred distance of 680 Å.
For the 30 and 100 period superlattices, the peaks in the FFT spectra drastically sharpen
and many higher-order satellite peaks appear (see Fig. 1.26c and d ). The FWHM of the satellite
peaks narrows from 47% for N 1 to 6% for the 100 period superlattice, i.e. the dot spac-
ings become extremely well defi ned. Many higher-order peaks also appear in the autocorrelation
spectra, which shows that large perfectly ordered dot domains are formed, with a nearly perfect
registry of the dot position up to ten nearest neighbouring dots. As indicated in the autocorrela-
tion images of Fig. 1.26 , average domain radii of 1, 2, 5 and 6 hexagonal unit cells are obtained
for N 1, 10, 30 and 100 periods, respectively. This underlines the effi ciency of the lateral order-
ing process.
A particular feature of the superlattice structures is that neither the lateral dot spacing nor the
average dot size changes with increasing number of periods – in contrast to the observations for
InAs or SiGe dot superlattices (see, e.g., Sections 1.6 and 1.7 and Fig. 1.20 ). This is proven by the
island height histograms of different samples depicted in the lower panel of Fig. 1.26 . After an
initial transient from the disordered to the ordered dot state, a constant average dot height of 120
Å is found for all layers ( Fig. 1.26 ). In addition, no change in the critical wetting layer thickness
[30] and no changes in the faceted pyramidal island shapes were observed. To determine how
the lateral ordering of the dots affects the size homogeneity, the width of the size distributions
was determined by Gaussian fi ts as indicated in Fig. 1.26 by the solid lines. For the single PbSe
dot layer the width of the histogram is 14%. Although the lateral ordering starts already in the
fi rst few superlattice layers, the height distribution at fi rst actually broadens to 27% after ten
superlattice periods, and only thereafter decreases to reach a fi nal value of 10% for N 1 0 0 .
This transient broadening can be understood in terms of a mismatch of the average lateral dot
spacing in the fi rst PbSe layer with respect to the preferred spacing in the superlattice stack that
is determined by the elastic interlayer interactions. In the fi rst superlattice layers, this mismatch
is accommodated by the formation of many defects and missing rows in the hexagonally ordered
dot regions, and because the size of the dots near these defects deviates from those within the
ordered regions, a broadening of the size distribution is induced. Once, however, the ordered dot
domains have a larger size, a notable size homogenization occurs. This transient effect has also
been found in the Monte Carlo growth simulations ( Fig. 1.18 ).
1.8.2.2 Vertically aligned superlattices
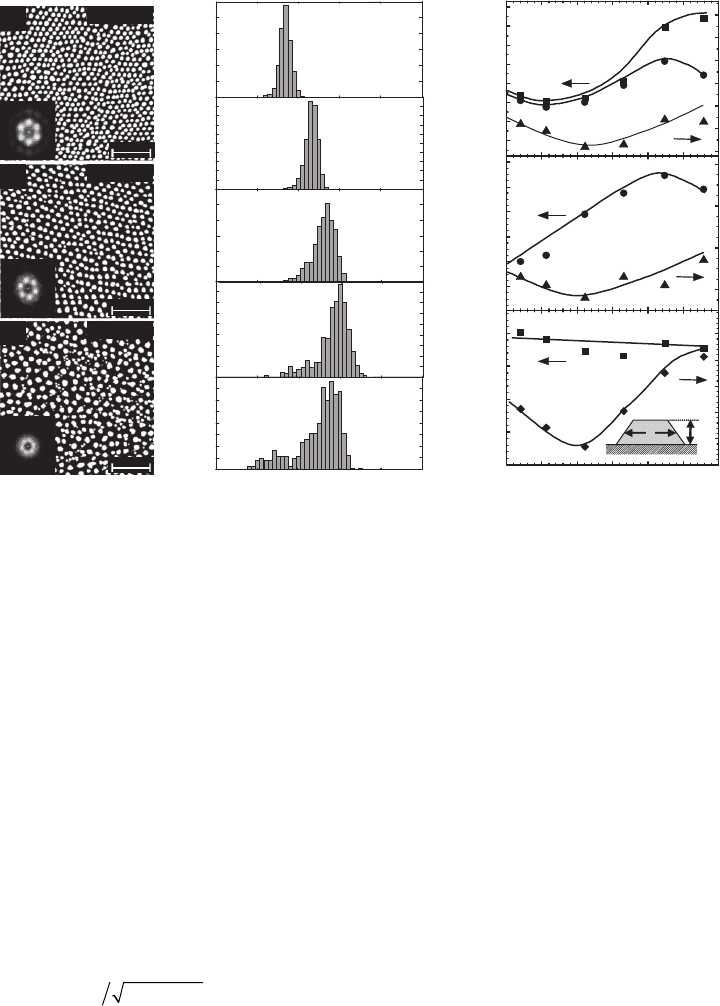
The properties of vertically aligned PbSe dot superlattices are summarized in Fig. 1.27 , where
on the left-hand side the atomic force microscopy images of three vertically aligned dot superlat-
tices with spacer thickness of 105–330 Å are shown, together with the corresponding evolution
of the dot size distributions depicted in the centre panel. Clearly, there is a very strong tendency
for a lateral dot alignment along the in-plane
〈〉110
surface directions. As a result, 2D hexago-
nally ordered dot arrays are formed, which is evidenced by the six-fold symmetric satellite peaks
in the FFT power spectra of the atomic force microscopy images shown as inserts. In addition,
the dot sizes and spacings are not only much larger as compared to that of the single dot refer-
ence layer, but also systematically increase with increasing spacer thickness. This is proven by
the corresponding decrease in the FFT satellite peak separations in Fig. 1.27 . The lateral ordering
is best for spacer thicknesses between 100 and 220 Å, for which the FFT satellite peaks are most
narrow in width and for which even weaker second-order FFT satellites are visible. For larger
CH001-I046325.indd 40CH001-I046325.indd 40 6/25/2008 12:27:43 PM6/25/2008 12:27:43 PM
Self-organized Quantum Dot Multilayer Structures 41
spacer thicknesses, the satellites become increasingly smeared out and they almost disappear for
the superlattice with 330 Å spacers ( Fig. 1.27c ). This is due to the increasing disorder in the dot
arrangement and the appearance of a second type of smaller PbSe dots nucleated between the
larger dots. Because the 330 Å spacer thickness of this sample is already close to the transition
to the fcc -like dot stacking, these interstitial dots obviously represent local fcc -stacked regions in
which the lateral dot separation is a factor of two smaller than those for the vertically aligned
dots (see Fig. 1.25e ).
For a quantitative analysis of the lateral ordering process in the vertically aligned structures,
the FFT satellite peak widths and separations Δ k were deduced. The preferred lateral dot spac-
ing L is then obtained from L
FFT
1 / ( Δ k · sin 60°) or, alternatively, from the dot density n by
using
Ln
n
160⋅°sin
. The results are plotted in Fig. 1.27f as a function of spacer thickness.
Clearly, the preferred lateral dot spacing increases strongly with increasing spacer thickness, but
does not follow a strict linear dependence as observed for the fcc -stacked superlattices. The rela-
tive width of the FFT satellite peaks (triangles in Fig. 1.27f ) shows a clear minimum of 16%
at a spacer thickness of d
s
160 Å, but for thinner as well as thicker spacer layers, the FWHM
increases to about 21%. Thus, the best lateral ordering occurs for 160 Å spacers. For larger
spacer thicknesses, also the mean dot separation obtained from the dot densities does not agree
any more with the value deduced from the FFT peak spacing. This is due to the appearance of the
smaller dots in the atomic force microscopy images, which increases the dot density but does not
affect much the separation of the larger dots.
600
700
800
900
1000
1100
1200
1300
15
20
25
30
35
40
45
60
80
100
120
140
160
Average dot height (Å)
10
20
30
40
Dot height h
Δh/h
FWHM Δh/h (±%)
50 100 150 200 250 300 350
0
100
200
300
400
Dot width b
Δb/b
(k)
(i)
Average dot width (Å)
Spacer layer thickness (Å)
0
10
20
30
40
50
FWHM Δb/b (±%)
FWHM
FFT
L
n
L
FFT
Lateral dot spacing (Å)
FWHM FFT peaks (±%)
h
b
500 nm
0
10
20
30
40
0
20
40
60
0
10
20
0
4
8
12
16
4
8
12
Density (m)
2
Density (m)
2
Density (m)
2
Density (m)
2
Density (m)
2
0 50 100 150 200 250
PbSe dot height (Å)
d
s
105 Å
11%
8%
13%
12%
17%
(d)
A
A
B
B
B
(g)
(f)
(e)
(h)
d
s
330 Å
d
s
275 Å
(a)
(b)
(c)
n
tot
192 m
2
d
s
160 Å
n
tot
181m
2
n
tot
112 m
2
n
tot
146 m
2
n
tot
130 m
2
d
s
215 Å
(j)
d
s
105 Å
d
s
215 Å
d
s
330 Å
500 nm
500 nm
Figure 1.27 Left-hand side : Atomic force microscopy surface images of vertically aligned PbSe/PbEuTe quantum
dot superlattices with PbEuTe spacer layer thicknesses of 105, 215 and 330 Å, from (a) to (c), respectively. The
number of 50 superlattice periods and the 5 ML thickness of the PbSe dot layer is constant for all samples. The insets
show the 2D FFT power spectra of the atomic force microscopy images. Centre : Dot height histograms obtained for
superlattices with spacer thicknesses of 105, 160, 215, 275 and 330 Å, from (d) to (h), respectively. Right-hand
side : Dot parameters plotted as a function of the spacer layer thickness: (i) lateral dot spacing L obtained from the
FFT satellite peaks (
) as well as the PbSe dot density ( ). Also plotted is the FWHM ( ) of the FFT satellite peaks.
(j) Average PbSe dot height h (
) and corresponding FWHM ( Δ h / h ) of the height histogram peaks ( ). (k) Average
dot width b (
) and corresponding FWHM ( Δ b / b ) of the histograms of the dot widths ( ) plotted as a function of
spacer thickness. Adapted from Raab et al. [51] .
CH001-I046325.indd 41CH001-I046325.indd 41 6/25/2008 12:27:43 PM6/25/2008 12:27:43 PM
42 Handbook of Self Assembled Semiconductor Nanostructures for Novel Devices in Photonics and Electronics
The dependence of the dot size and shape as a function of spacer thickness was deduced from
a statistical analysis that also yields the width of the size distributions. Fig. 1.27d –h shows the
height histograms for the samples with spacer thicknesses of 105 to 330 Å. Clearly, for spacer
thicknesses increasing from 85 to 275 Å, the dot height rapidly increases from h 8 5 Å t o
h 149 Å, respectively. For thicker spacers, however, a small left-hand shoulder (A) starts to
emerge at smaller dot heights, and this shoulder becomes even more pronounced for the sam-
ple with 330 Å spacers. Also, the average dot size does not increase anymore but rather slightly
decreases to 138 Å. Both effects are caused by the formation of additional smaller dots on the
surface, which reduces the overall amount of PbSe available for the larger dots.
Figure 1.27j and k summarize the dependence of the average dot height h and dot width b
as a function of spacer thickness. As indicated in Fig. 1.27j , up to d
s
275 Å, the average dot
height increases linearly with increasing spacer thickness, whereas the dot width of about 350
Å remains essentially constant ( Fig. 1.27k ). This translates into a fl attening of the dot shape for
small spacers, indicating that the dot growth is enhanced in the lateral direction. Atomic force
microscopy images recorded with selected sharp atomic force microscopy tips show that these
dots assume a truncated pyramidal shape with triangular base and { 100 } side facets, as shown
schematically in the inset of Fig. 1.27k . For very thin spacer layers, the PbSe dots are rather fl at
with an aspect ratio of only about 1:5, whereas for the thicker spacers the aspect ratio increases
to about 1:3. This is still below the value of 1:2.2 of the pyramidal dots of single dot layers that
do not show any fl attening of the island apex. The modifi cations of dot shape are obviously
induced by the elastic strain fi elds of the buried dots, which are strongest for the thinnest spacer
layers but decay rapidly as the spacer thickness increases. Therefore, for spacer thicknesses larger
than 400 Å, the dots exhibit the same pyramidal shape known for unperturbed single dot layers.
Perhaps the most interesting feature is the pronounced narrowing of the size distribution for the
well-ordered vertically aligned samples. From the dependence of the width of the size distributions
plotted in Fig. 1.27j and k as a function of spacer thickness it is found that the FWHM decreases
from 13% to 8% when d
s
increases from 80 to 160 Å, after which it increases again to above
15% for d
s
330 Å. A similar, but even more pronounced, trend is observed for the variation of
the lateral dot widths ( Fig. 1.27k ), which again shows a pronounced minimum for 160 Å spacers.
Thus, the highest uniformity is obtained for the superlattice with the best hexagonal ordering, dem-
onstrating that the lateral ordering produces a higher uniformity of the dot ensembles.
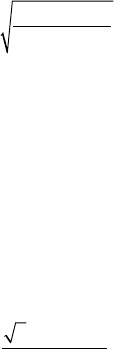
1.8.2.3 Order parameters derived by X-ray diffraction studies
The vertical and lateral ordering was also characterized by anomalous X-ray diffraction per-
formed at the ESRF synchrotron light source in Grenoble with an X-ray photon energy tuned to
the M shell absorption edge of the Pb atoms. In this way, the structure scattering factor of the
PbEuTe matrix is drastically reduced to about 50 times below that of PbSe and therefore the scat-
tering contrast between the dots and matrix is drastically enhanced. The resulting anomalous
reciprocal space maps are depicted in Fig. 1.28a–d for the superlattices with 105, 165, 215 and
465 Å spacer thicknesses, respectively. Clearly, for all samples a large number of satellite peaks is
observed in the vertical q
z
as well as lateral q
x
direction. However, whereas for the samples with
thin spacers the lateral satellite peaks are aligned parallel to the q
x
direction, for the sample with
thick spacers they are aligned along inclined directions (dashed lines in Fig. 1.28 ). In addition,
reciprocal space maps recorded along different azimuth directions indicate a six-fold symmetry for
the samples with small spacers as compared to a three-fold symmetry for the other sample. This
is additional evidence of the different interlayer dot stackings in the samples, forming a trigonal
fcc -like dot lattice for the latter and a vertically aligned 3D hexagonal dot lattice for the former.
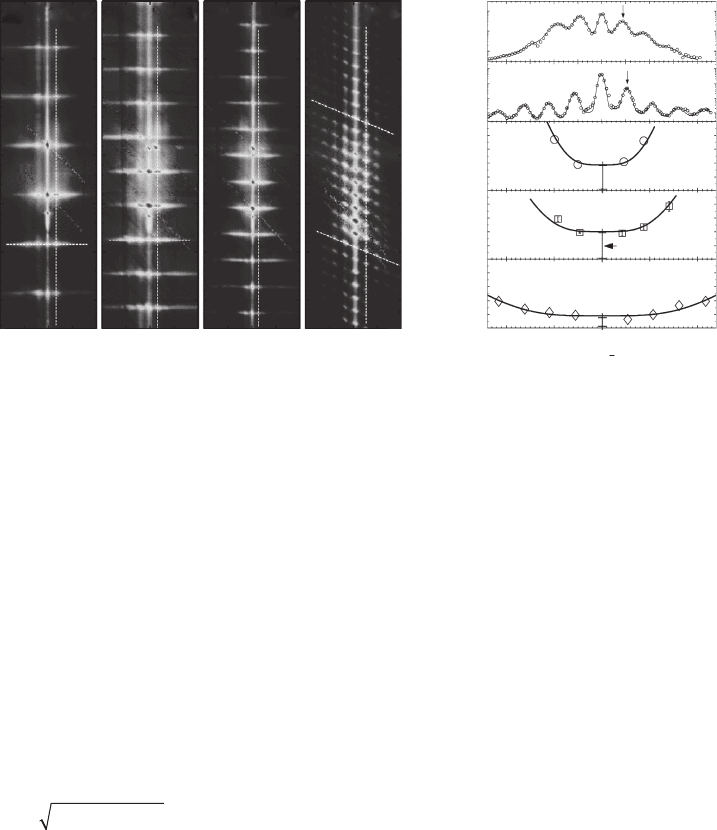
The quality of the dot ordering process was assessed from cross-sectional line scans of the
reciprocal space maps shown in Fig. 1.28 e and f. For the sample with fcc stacking ( Fig. 1.28f ) a
much larger number of lateral satellites can be resolved as compared to those of the vertically
aligned dot samples ( Fig. 1.28e ). In addition, for the latter a signifi cant increase in the peak
widths with increasing q
x
scattering vector occurs. For a quantitative analysis, the widths of the
satellites were derived by fi tting the cross-sectional profi les by Gaussians, with the fi ts represented
as solid lines in Fig. 1.28e and f . The resulting FWHM of the lateral satellite peaks are plotted
CH001-I046325.indd 42CH001-I046325.indd 42 6/25/2008 12:27:44 PM6/25/2008 12:27:44 PM
Self-organized Quantum Dot Multilayer Structures 43
in Fig. 1.28g–j versus in-plane scattering vector q
x
. For the vertically aligned dot superlattices,
the lateral peak width rapidly increases, whereas for the superlattice with fcc stacking the FWHM
are almost constant. To deduce the corresponding order parameters of the dot structures, this
dependence was fi tted using a modifi ed short-range ordering scattering model, in which the
dependence of the satellite peak width Δ q
x
as a function of scattering vector q
x
is described as
[57, 91, 173] :
ΔqqLM
xxL
≈
44 2 2
σ / .
(1.12)
Here, L is the average lateral dot distance obtained from the satellite peak spacing, σ
L
is the vari-
ance in the nearest neighbour dot distance within the growth plane and M is the relative size of
the ordered dot domain in units of L . By fi tting the experimental data with this relation (solid
lines in Fig. 1.28g–j ), σ
L
and M can be deduced. M basically corresponds to the offset of Δ q
x
at
q
x
0, and σ
L
is determined by the parabolic increase of Δ q
x
at higher q
x
values. For the well-
ordered vertically aligned samples ( Fig. 1.28g and h ), σ
L
117 and 86 Å, which corresponds
to a relative variance or dispersion of the lateral dot spacings of 15 and 10%, respectively.
For the fcc -stacked sample σ
L
is only 36 Å, corresponding to a much smaller dispersion of only
5%. This indicates that the lateral dot ordering is signifi cantly better than that of the vertically
aligned samples. The same trend also applies for the average domain sizes, with M 2 for the
vertically aligned samples as compared to M 5 for the superlattice with fcc stacking. This indi-
cates that the ordering process for superlattices with staggered dot stacking is much more effi -
cient compared to that for vertically aligned dots, which agrees well with the results from the
Monte Carlo growth simulations (Section 1.5). From an analogous measurement of the satel-
lite peak widths in the vertical q
z
direction, it is found that this width is quite small for all four
samples and that the widths are nearly independent of q
z
. This indicates that the layer-to-layer
(e)
(f)
(g)
(h)
(i)
Intensity [cps]
d
s
164 Å
FWHM
FWHM
FWHM
8
6
4
2
8
6
4
2
8
6
4
2
d
s
454 Å
d
s
164 Å
d
s
454 Å
σ
s,rel
15%
σ
s,rel
10%
σ
s,rel
5%
q
x 0
q
x
[Å
1
] along [101] azimuth
0.04 0.02 0 0.02 0.04
q
x
(10
3
Å
1
)
1.6
q
Z
[Å
1
] along [111] growth direction
q
x
[Å
1
] along [101] azimuthal direction
1.9
1.85
1.8
1.75
1.7
1.65
(a) (b) (c) (d)
d
s
164 Å
d
s
214 Å d
s
454 Å
10
0
10
1
10
2
10
3
10
1
10
2
10
3
0.025 0.0250 0.025
0.025
0 0.025
0.025
0 0.025
0.025
0
d
s
104 Å
d
s
104 Å
Figure 1.28 Left-hand side : (111) Reciprocal space maps recorded by anomalous synchrotron X-ray diffraction at
5.1 Å wavelength of four PbSe quantum dot superlattices with different PbEuTe spacer thicknesses d
s
104, 164,
214 and 454 Å, from (a) to (d), respectively. The arrangement of the lateral satellite peaks along q
x
indicates a 3D
hexagonal dot lattice structure and vertical dot alignment for the superlattices with small spacer thickness (a) to (c),
as compared to the 3D trigonal dot lattice with fcc dot stacking for the sample with 454 Å spacers (d). Right-hand
side : Cross-sectional q
x
line scans for the superlattice samples with (e) 164 Å and (f) 454 Å spacers recorded along
the horizontal, respectively, inclined dashed lines in the reciprocal space maps (b) and (d). (g) to (i) Full width at half
maximum (FWHM) Δ q
x
of the lateral satellite peaks (open symbols) along q
x
plotted as a function of q
x
scattering
vector for the samples with d
s
104, 164 and 454 Å.The solid lines represent the fi t of the data with a short-range
order scattering model from which the dot order parameters such as variance of the dot spacings σ
L
as well as the
average domain size is obtained. Adapted from Lechner et al. [57] .
CH001-I046325.indd 43CH001-I046325.indd 43 6/25/2008 12:27:45 PM6/25/2008 12:27:45 PM
44 Handbook of Self Assembled Semiconductor Nanostructures for Novel Devices in Photonics and Electronics
dot correlation along the growth axis is nearly perfect, with a correlation length as large as 25
superlattice periods for the vertically aligned samples and of seven periods for the superlattice
with fcc stacking. This difference is caused by the decreasing strain fi eld interactions with increas-
ing spacer thickness, eventually approaching zero in the far-fi eld limit.
1.8.3 Interlayer correlations as a function of dot size
Apart from the spacer thickness dependence, we have also investigated the infl uence of the dot
layer thickness and the growth temperature on the interlayer correlation formed in self-assem-
bled PbSe dot superlattices [55, 56] . As shown by studies of single dot layers [130, 171] , both
parameters strongly affect the size and density of the dots and thus the confi guration of the start-
ing layer which is expected to alter the evolution of the subsequent growth process. Two series of
samples were investigated. In the fi rst series, the PbSe dot layer thickness was varied from 1 to
8 ML, while keeping the substrate temperature of 360°C, the spacer thickness of 410 Å and the
number of 100 superlattice periods constant [54] . In the second series, the substrate tempera-
ture was varied from 320 to 400°C whereas the spacer and dot layer thicknesses were kept con-
stant at 420 Å and 5 monolayers and the number of superlattice periods was 30 [56] .
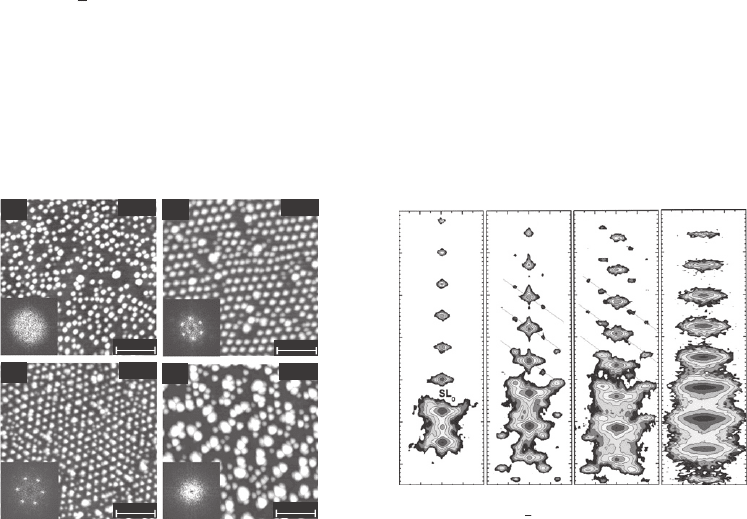
Figure 1.29a–d shows the atomic force microscopy surface images of the superlattices with
PbSe thicknesses of 3, 4, 5 and 8 monolayers. At 3 ML PbSe coverage ( Fig. 1.29a ), the PbSe dots
are obviously randomly distributed over the surface without a preferred nearest neighbor direc-
tion (see featureless diffuse FFT power spectrum of the atomic force microscopy image depicted
as inset). When the PbSe layer thickness increases to 4 ML, this disordered dot arrangement gives
way to a well-ordered hexagonal dot arrangement (see Fig. 1.29b ) where the dots are aligned
along the
〈〉110
surface directions with a well-defi ned lateral dot spacing of 580 Å. The good lat-
eral ordering is evidenced by the appearance of sharp, six-fold symmetric satellite peaks in the
FFT power spectrum. The same ordering is also observed for PbSe thicknesses of 5 and 6 ML, as
shown in Fig. 1.29c . For thicker PbSe layers, however, the dots start to cluster and large “ super ”
dots are formed. This is illustrated in Fig. 1.29d by the atomic force microscopy image of the 8 ML
superlattice sample. Although between the large dots a few smaller dots remain that still show
(a)
3ML
250 nm
(d)
8ML
250 nm
(b)
250 nm
5ML
250 nm
(c)
4ML
(e) (f) (g) (h)
34.2
34
33.8
33.6
33.4
33.2
33
0.1
0.1
0.1 0.1
00
0.1
0.1
0
0.1
0.1
0
q
x
along the (211) azimuthal direction (nm
1
)
q
z
along the (111) growth direction (nm
1
)
3ML
8ML
5ML
4ML
Figure 1.29 Left-hand side : Atomic force microscopy surface images of 100 period PbSe quantum dot
superlattices with constant 410 Å PbEuTe spacers but varying PbSe dot layer thickness of 3, 4, 5 and 8 monolayers
for (a) to (d), respectively. The FFT power spectra shown as insets indicate a different lateral ordering for the samples.
Right-hand side : (222) X-ray reciprocal space maps for the same samples. For the 3 ML superlattice (e), no lateral
satellites are observed due to the lack of any lateral or vertical dot correlations. For the 4 and 5 ML superlattices (f)
and (g), the lateral satellite indicates an fcc -like dot stacking, whereas for the 8 ML superlattice (h) the large peak
broadening along q
x
indicates the lack of lateral ordering but a vertical dot alignment along the growth direction.
Adopted from Springholz et al. [55] .
CH001-I046325.indd 44CH001-I046325.indd 44 6/25/2008 12:27:46 PM6/25/2008 12:27:46 PM

Self-organized Quantum Dot Multilayer Structures 45
some signs of a preferred hexagonal dot coordination, no distinct satellite peaks appear in the
FFT power spectrum. This indicates the existence of a rather disordered overall dot arrangement.
To determine the corresponding interlayer dot correlations, high-resolution X-ray diffraction
reciprocal space maps were recorded along the [
211
] azimuth direction. The results are shown
in Fig. 1.29e – h for superlattices with 3, 4, 5 and 8 ML PbSe thicknesses. For the 3 ML dot sam-
ple ( Fig. 1.29e ), only vertically aligned satellite peaks along q
z
appear. Around the 0th order SL0
superlattice peak there is a strongly enhanced diffuse scattering caused by the presence of self-
assembled quantum dots at the heterointerfaces. Because this scattering component is absent for
the higher-order satellites, there is no spatial correlation of the dots from one layer to the next
layer, i.e. the superlattice represents an uncorrelated repetition of disordered single dot layers,
similar to PbSe dot superlattices with thick spacer layers.
For the superlattices with intermediate PbSe thicknesses (see Fig. 1.29f and g for 4 and 5 ML,
respectively), satellite peaks are observed in both the vertical q
z
and lateral q
x
direction. Thus, the
dots are highly correlated both vertically and laterally, creating a three-dimensional ordered lat-
tice of dots. As discussed in detail in the previous section, because the lateral satellites are aligned
along lines inclined by 38 ° to the vertical q
z
direction an fcc -like dot stacking is formed. For the
samples with larger PbSe thicknesses, again a striking change occurs, in which the well-defi ned
lateral satellites are replaced by a strong correlated diffuse broadening of all satellites along the
lateral q
x
direction. This indicates that although the dots are disordered in the lateral direction,
the interface corrugation is replicated from layer to layer along the growth axis. Thus, the dots
are vertically aligned in columns as was found for PbSe superlattices with small spacer thickness.
From a statistical analysis of the dot size distributions [55, 56] , the average dot height of the
fi nal layer was found to increase from 48 Å for the 3 ML superlattice to 125 Å for the 8 ML sam-
ple, and the narrowest size distribution is formed for the well-ordered samples with 4 and 5 ML
PbSe thicknesses, for which the FWHM of the histograms is 14%, whereas it is more than
25% for the disordered 3 and 8 ML superlattices [55, 56] . Thus, an fcc -like dot stacking is
formed only for the superlattices with an average dot height between 80 and 120 Å. This demon-
strates that the kind of interlayer correlation and dots stacking formed in the superlattice struc-
tures does not depend only on the spacer thickness but also on the dot size.
For the sample series with varied growth temperature, a similar behaviour was found [54,
56] . At growth temperatures below 340°C, the dot density is very high and the average dot size
smaller than 70 Å. As a result, no interlayer correlations are formed and no lateral ordering
occurs [56] . At temperatures between 360 and 380°C, in contrast, atomic force microscopy and
X-ray diffraction measurements reveal a good hexagonal lateral ordering as well as a well-defi ned
fcc -like vertical dot stacking. Again in this case, the average dot height is around a value of 90 Å
with a very low 14% size dispersion. At higher temperatures, very large and disordered dots
are formed with a large average height of 160 Å and the X-ray diffraction data indicates a prefer-
ential vertical dot alignment in the samples [56] . This indicates again that an fcc -type dot stack-
ing is formed only for a very limited range of PbSe dot sizes and that the dot size is an important
parameter in the interlayer correlation formation.
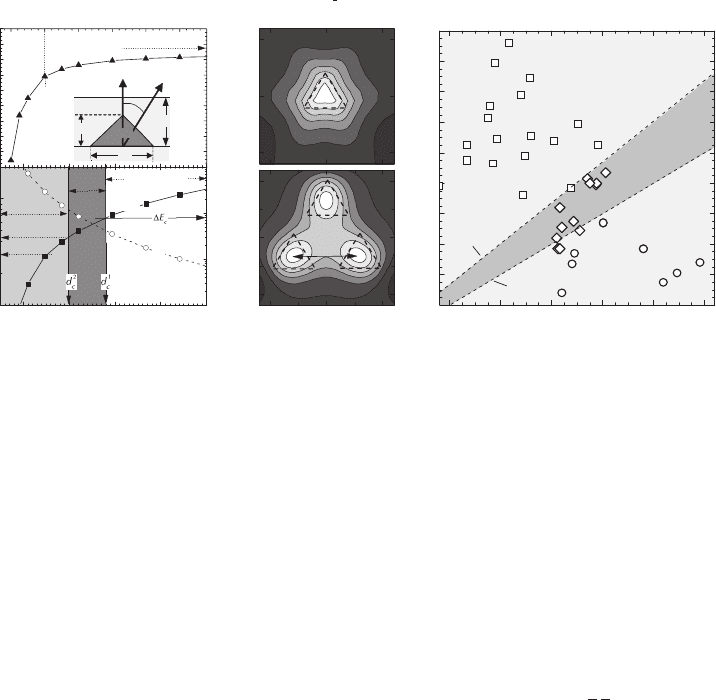
1.8.4 Phase diagram for vertical and lateral dot ordering
To explain the changes in the interlayer dot correlations as a function of spacer thickness and dot
size, the dependence of the elastic strain fi elds and surface energy distributions on these parame-
ters must be taken into account. For this purpose, we have performed a series of fi nite element cal-
culations for pyramidal PbSe dots of different size but invariant shape located in a (111)-oriented
PbEuTe matrix at various depths d below the surface [50] . In accordance with our atomic force
microscopy studies [130] , the shape of the dots was modelled as a triangular pyramid with
{ 100 } side facets and constant aspect ratio of b/h
6, where b is the island base and h the
island height. A general conclusion of these calculations is that the surface strain energy distri-
butions plotted in terms of dimensionless scaled surface coordinates x / d depend only on the ratio
d / b of the island depth to the island size. As a consequence, the directions α of the surface energy
minima are determined exclusively by the d / b ratio.
CH001-I046325.indd 45CH001-I046325.indd 45 6/25/2008 12:27:48 PM6/25/2008 12:27:48 PM
46 Handbook of Self Assembled Semiconductor Nanostructures for Novel Devices in Photonics and Electronics
Figure 1.30c and d shows two representative scaled strain energy distributions for d / b 0 . 5
and 1.5, respectively. Clearly, for spacer thicknesses larger than the island base, i.e. d/b 1, the
strain energy distributions closely resemble that obtained by the point-source model (compare
Fig. 1.30d with Fig. 1.6c ), with three well-separated energy minima along the
〈〉112
directions.
Thus, for large d/b values the results converge to that of the far-fi eld point-source model. This
is also evidenced by Fig. 1.30a , where the minima direction α is plotted versus d/b which con-
verges to 36° when d/b is larger than one. Thus, the experimentally observed fcc dot stacking as
well as the measured and calculated interlayer correlation directions are in good agreement with
each other for d/b 1. However, when d/b decreases below 1, α rapidly decreases, reaching zero
already for d/b 0.5 (see Fig. 1.30a ). This means that the three side energy minima are joined
to one central minimum exactly above the buried dot, as is illustrated by the strain energy dis-
tribution depicted in Fig. 1.30c for d/b 0.5. At small spacer thicknesses and/or large dot sizes,
the fcc dot stacking is therefore replaced by a vertical dot alignment, in good agreement with the
experimental observations.
Figure 1.30b shows the dependence of the energy minima separation L
min
as well as their
depth Δ E
min
as a function of the vertical superlattice period d for PbSe dots with 120 Å height
and 300 Å base, as measured for the sample series described in Section 1.8.1. The differently
shaded regions indicate the different interlayer correlations observed by the experiments. For
large spacers, L increases linearly with d , but rapidly drops to zero at d below 200 Å. On the other
hand, the depth of the energy minima continuously decreases as the spacer thickness increases
due to the decay of the elastic strain fi elds. Similar calculations for a constant spacer thickness
but varying dot size are depicted in Fig. 1.10 [55] .
To deduce the conditions at which the transition between the differently correlated dot struc-
tures occur, one has to compare the minima separation L
min
and the dot base width b as indi-
cated by the dashed triangles in Fig. 1.30c and d . For the case of small dots or thick spacers, the
minima separation is much larger than the dot base width ( b L
min
). Therefore, the dots on the
surface can easily occupy just one single energy minimum and as growth proceeds, an fcc -like
200 400 600 800 1000
100
1000
0.1
1
10
0
5
10
15
20
25
30
35
40
45
0.5 1.5 2.0 2.5 3.0
5
10
15
20
25
30
35
40
300
500
700
200
Minima separation L
min
(
Å
)
Vertical superlattice period d (Å)
uncorrelated
trigonal
Vertically
aligned
ΔE (meV/atom pair)
b
w
eff
PbSe pyramid:
b 300A; n 120A
(b)
(a)
Point source
Depth-to-pyramid base ratio d/b
Minima directions α (deg)
h
1
1
1
-1 0
d/b=0.5
(c)
x/d || [110]
1101
1
-
x/d || [110]
(d)
d/b=1.5
Lmin
--
- -
PbEuTe
D
PbSe
α
(111)
E
min
h
200 300 400 500 600 700
40
60
80
100
120
140
160
180
200
220
PbSe dot
stackings
[h/d]
c1
[h/d]
c2
(e)
Uncorrelated
fcc-
stacked
vertically
aligned
Measured average PbSe dot height h (Å)
1.0
ΔE
Lmin
y/c || [112] y/c || [112]
b
Vertical dot layer spacin
g
d (Å)
1
Figure 1.30 The infl uence of the spacer layer thickness, i.e. vertical superlattice period d as well as the PbSe dot
size on the strain energy distributions and interlayer correlations in (111) PbSe/PbEuTe quantum dot superlattices.
(a) Direction α of the surface strain energy minima above pyramidal PbSe islands plotted as a function of the
renormalized vertical dot layer separation d/b , where b is the lateral dot base width and d is the superlattice period.
The surface strain energy distributions for d/b 0.5 and 1.5 are plotted in (c) and (d) as a function of the reduced
surface coordinates x / d . The energy separation between the contour lines is 6 meV and 0.16 meV, respectively.
(b) Calculated lateral separation L
min
of the energy minima ( ) and depth of the minima E (o) plotted versus
superlattice period for PbSe pyramids with a fi xed base width of b 300 Å and a dot height of h 120 Å.(e)
Phase diagram of different dot stackings in PbSe dot superlattices as a function of vertical dot layer spacing and PbSe
dot size: (
) vertically aligned dots, ( ) fcc -stacked and (o) uncorrelated superlattices. Data obtained from X-ray
diffraction, transmission electron and atomic force microscopy measurements. The phase boundary lines are plotted
according to Eqs (1.13) and (1.14). See also Springholz et al. [50] .
CH001-I046325.indd 46CH001-I046325.indd 46 6/25/2008 12:27:48 PM6/25/2008 12:27:48 PM
Self-organized Quantum Dot Multilayer Structures 47
ABCABC … stacking sequence is formed. For very small dots and large spacer thicknesses, how-
ever, the energy minima become very shallow because the strain fi elds decrease linearly with
decreasing dot volume in the far-fi eld limit (see Eq. 1.3 ). Experimentally, no interlayer dot cor-
relations were found for vertical superlattice periods beyond the critical value of d
c
1
560 Å
(see Fig. 1.25e ). From Fig. 1.30b , at this point, the depth of the strain energy minima induced
by one subsurface dot is as small as ΔE 0.4 meV/atom pair. Because in the multilayers each
surface energy minimum is produced by the superposition of the strain fi elds of three subsur-
face dots, the corresponding minimal interaction energy required for interlayer correlation for-
mation is actually three times this value, i.e. Δ E
crit
1.2 meV for the given growth conditions.
Surprisingly, this value is more than one order of magnitude smaller than the thermal ener-
gies at the given growth temperature. This may be taken as an indication that the nucleation of
Stranski–Krastanov islands is mostly governed by the critical nucleus size and nucleation barrier
rather than by the hopping and diffusion process of the single surface adatoms.
For large dots and small spacer thicknesses, the energy minima separation successively
decreases ( Fig. 1.30b ) and they eventually merge into one single minimum. Experimentally,
the transition from the fcc dot stacking to a vertical alignment already occurs before this point,
namely, at a spacer thickness of d
c
2
400 Å (see Fig. 1.30e ), i.e. at a d / b value of about 1.3. This
is because for fcc- stacked dots, not only must the energy minima separation be larger than the
dot base widths, but additionally a certain denuded zone around each dot must be taken into
account where further dot nucleation is kinetically suppressed. According to our experimental
data, the size of this denuded zone must be about 1.6 times the base width, which is the effective
width of the minimal surface area required for each dot.
For a given material system, the two phase boundary conditions can be written in a rather
generalized form because under the condition of an invariant island shape there is a fi xed rela-
tionship between the dot base and dot height and the dot volume is proportional to h
3
. The fi rst
phase boundary corresponds to the cut-off length of the interlayer correlations that is deter-
mined by the minimal interaction energy E
crit
required for correlated dot nucleation. This value is
specifi c for each material system and growth condition, but according to Eq. 1.3, it is determined
only by ratio of the volume over the dot depth V
0
/ h . As V
0
h
3
, this cut-off condition can be
reformulated as:
hd
E
EC
c
crit
s
D
hkl
/
[]
⋅⋅
1
2
3
δ
(1.13)
where δ V
0
/ h
3
is constant for a given island shape, and E
0
is the surface strain energy den-
sity of the uniformly strained 2D reference layer. Using for PbSe the values E
s
2D
1 4 2 m e V,
C
hkl
0.69 (see Section 1.3.4), δ
3/2 for { 100 } faceted pyramids and the experimental value
of E
crit
1.4 meV from above, one obtains a critical ratio of [ h / d ]
c
1
0.22 below which no inter-
layer correlations should be formed in the superlattice structures.
Concerning the second boundary condition, for a fi xed island shape the correlation angle α of
the energy minima is constant for a given d / b (see Fig. 1.30a ) and likewise for a fi xed h / d ratio.
Since the diameter of the denuded zone w
eff
is proportional to b and thus w
eff
/ h κ constant,
the condition of w
eff
L
min
for the transition between the vertical dot alignment and fcc stacking
can be written for the (111) case as:
hd
c
/
[]
⋅
2
111
3
tanα
κ
(1.14)
For the (100) growth orientation, the
3 factor simply has to be replaced by
2 because of the
different arrangement of the energy minima (Section 1.3). Applying the appropriate parameters
for the PbSe case ( κ 3.9 and α
111
38°), one obtains a critical ratio of [ h / d ]
c
2
0.28 above
which the PbSe dots should be always vertically aligned. Thus, an fcc -like dot stacking should
occur only in the range of 0.22 [ h / d ] 0.28.
Compiling in Fig. 1.30 the large body of experimental data obtained by X-ray diffraction,
transmission electron and atomic force microscopy for more than 50 different PbSe quantum
CH001-I046325.indd 47CH001-I046325.indd 47 6/25/2008 12:27:49 PM6/25/2008 12:27:49 PM
48 Handbook of Self Assembled Semiconductor Nanostructures for Novel Devices in Photonics and Electronics
dot superlattices with various spacer thicknesses and dot sizes, a complete phase diagram of dot
stackings is obtained for this material system in which the phase boundaries follow exactly the
dashed boundary lines defi ned by the stacking conditions of Eqs (1.13) and (1.14) . Moreover,
this phase diagram clearly demonstrates that staggered dot stackings can be generally obtained
only in a narrow window of parameters confi ned by the phase boundaries represented by Eqs
(1.13) and (1.14) . Its width is determined not only by the elastic properties, the surface orien-
tation and the characteristic island shapes but also by the epitaxial growth conditions that will
determine the effective cut-off energy value E
crit
. For materials with small elastic anisotropy (e.g.
for Si/Ge (100)) [ h / d ]
c
2
will become smaller than [ h / d ]
c
1
. This means that no set of parameters
exist in which a staggered dot stacking may be formed, which poses a strong limitation on the
conditions and materials in which a staggered stacking can be obtained.
1.9 Other mechanisms for interlayer correlation formation
Elastic interactions are certainly the most important factor for interlayer correlations formed in
quantum dot multilayer structures. However, as already mentioned in Section 1.2, there exist
at least two other alternative but less obvious mechanisms that may contribute to interlayer
correlation formation. These mechanisms are correlated dot nucleation mediated by (i) non-
planarized surface topographies ( Fig. 1.1c and d ) or (ii) lateral compositional modulations of the
spacer layer ( Fig. 1.1e and f ). Although up to now little work has been carried out to clarify these
mechanisms, each of them may in principle give rise to different interlayer dot stacking types (see
Fig. 1.1 ), depending on the intricate details of the interaction and nucleation process.
1.9.1 Morphologic correlations
With respect to the correlations mediated by the growth morphology, one fi rst has to realize that
each quantum dot layer itself represents a highly corrugated surface structure. Although during
overgrowth, this 3D surface will be eventually planarized to minimize the surface energy, a cor-
rugated non-planar surface structure can be retained when the capping process is incomplete.
This can be expected, e.g., for thin spacer layers or when planarization is hindered by sluggish
surface kinetics. Obviously, a corrugated surface will infl uence the subsequent island nucleation
and, because the surface corrugations are linked to dots below the surface, in this way interlayer
dot correlations can be produced as well. That the surface morphology plays a profound role in
self-assembled dot nucleation has been recently established by investigation of self-assembled
quantum dot growth on prepatterned substrates. In these studies it has been demonstrated that
dot nucleation can be triggered by lithographically patterned surface sites [174–178] . In fact, in
this way a near-perfect position control of self-assembled quantum dots has been achieved for the
Ge on Si [174] as well as InAs on GaAs material systems [176] .
For overgrowth of Stranski–Krastanow islands, actually two different growth scenarios may
occur with quite different resulting surface morphologies. On the one hand, when the surface
diffusivity of spacer adatoms and surface capillarity forces are small, surface planarization is
rather slow and mound-like structures are retained above the buried islands when the spacer
thickness is not very large. This situation is illustrated schematically in Fig. 1.1c and d . On the
contrary, when surface mass transport is dominated by the stress fi elds of the buried dots, the
mobile adatoms during spacer deposition are repelled from the surface above the buried dots due
to the opposite sign of strain [15] . As a result, the growth of the spacer layer can be locally sup-
pressed and surface depressions or pits are formed above the dots [15] . This has been reported,
e.g., for InAs islands overgrown by GaAs [179] or InP [180] , as well as for PbSe dots overgrown
with PbEuTe [112] . This means that the actual type of spacer morphology strongly depends on
the chosen growth conditions.
A second complication arises from the fact that the reaction of dot nucleation to the presence
of non-planar corrugated surface morphologies itself depends on the mechanism that dominates
the dot layer surface mass transport. If lateral mass transport during wetting layer growth is
CH001-I046325.indd 48CH001-I046325.indd 48 6/25/2008 12:27:49 PM6/25/2008 12:27:49 PM