Hull J.C. Risk management and Financial institutions
Подождите немного. Документ загружается.


102 Chapter 4
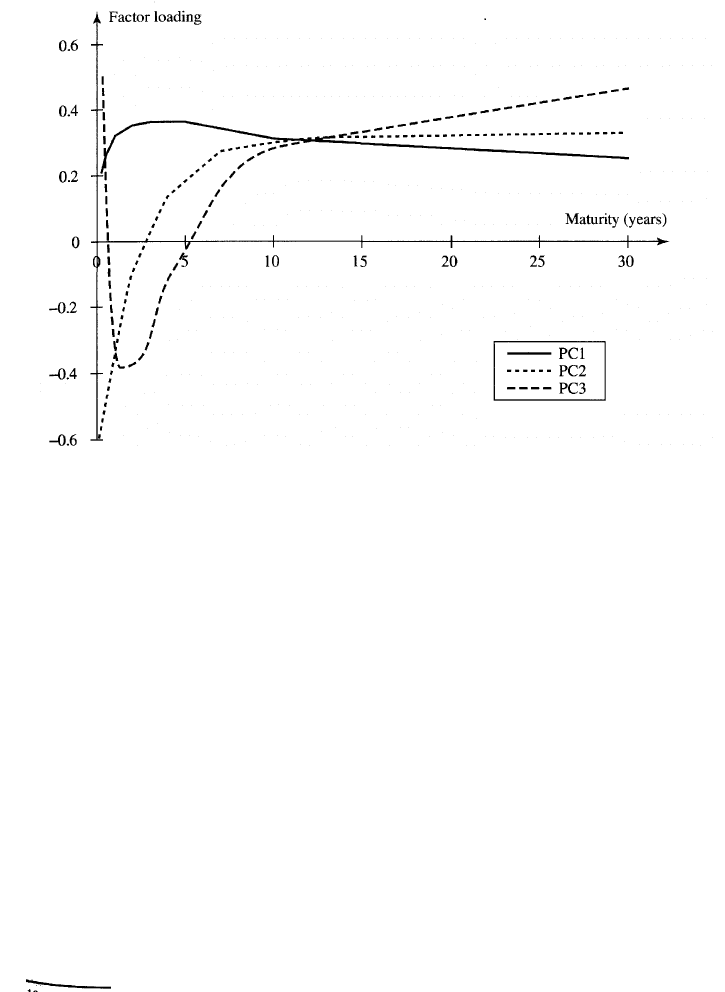
the three-month rate increases by 0.21 basis points, the six-month rate
increases by 0.26 basis points, and so on. The second factor is shown in
the column labeled PC2. It corresponds to a "twist" or change of slope of
the yield curve. Rates between three months and two years move in one
direction; rates between three years and 30 years move in the other
direction. The third factor corresponds to a "bowing" of the yield curve.
Rates at the short end and long end of the yield curve move in one
direction; rates in the middle move in the other direction. The interest rate
move for a particular factor is known as factor loading. In our example,
the first factor's loading for the three-month rate is 0.21.
9
As there are ten rates and ten factors, the interest rate changes observed
on any given day can always be expressed as a linear sum of the factors by
solving a set of ten simultaneous equations. The quantity of a particular
factor in the interest rate changes on a particular day is known as the
factor score for that day.
The importance of a factor is measured by the standard deviation of its
factor score. The standard deviations of the factor scores in our example
are shown in Table 4.10 and the factors are listed in order of their
importance. The numbers in Table 4.10 are measured in basis points. A
quantity of the first factor equal to one standard deviation, therefore,
corresponds to the three-month rate moving by 0.21 x 17.49 = 3.67 basis
points, the six-month rate moving by 0.26 x 17.49 = 4.55 basis points,
and so on.
The technical details of how the factors are determined are not covered
here. It is sufficient for us to note that the factors are chosen so that the
factor scores are uncorrelated. For instance, in our example, the first
factor score (amount of parallel shift) is uncorrelated with the second
factor score (amount of twist) across the 1,543 days. The variances of the
factor scores (i.e., the squares of the standard deviations) have the
property that they add up to the total variance of the data. From
Table 4.10, the total variance of the original data (i.e., sum of the
variance of the observations on the three-month rate, the variance of
the observations on the six-month rate, and so on) is
17.49
2
+ 6.05
2
+ 3.10
2
+ ... + 0.79
2
= 367.9
From this, it can be seen that the first factor accounts for
17.49
2
/367.9 = 83.1% of the variance in the original data; the first two
factors account for (17.49
2
+ 6.05
2
)/367.9 = 93.1% of the variance in the
9
The factor loadings have the property that the sum of their squares for each factor is 1.0.
Interest Rate Risk 103
Figure 4.7 The three most important factors driving yield curve movements.
data; the third factor accounts for a further 2.6% of the variance. This
shows that most of the risk in interest rate moves is accounted for by the
first two or three factors. It suggests that we can relate the risks in a
portfolio of interest-rate-dependent instruments to movements in these
factors instead of considering all ten interest rates. The three most
important factors from Table 4.9 are plotted in Figure 4.7.
10
Using Principal Components Analysis to Calculate Deltas
To illustrate how a principal components analysis can provide an alter-
native way of calculating deltas, suppose we have a portfolio with the
exposures to interest rate moves shown in Table 4.11. A one-basis-point
change in the one-year rate causes the portfolio value to increase by
$10 million; a one-basis-point change in the two-year rate causes it to
increase by $4 million; and so on. We use the first two factors to model
rate moves. (As mentioned earlier, this captures over 90% of the un-
certainty in rate moves.) Using the data in Table 4.9, our delta exposure to
the first factor (measured in millions of dollars per factor-score basis
10
Results similar to those described here, with respect to the nature of the factors and
the amount of the total risk they account for, are obtained when a principal components
analysis is used to explain the movements in almost any yield curve in any country.
100 Chapter 4
be considered for the segment of the zero curve between 2.0 and 3.0 years
in Figure 4.3. Again, the sum of the deltas for all the segments equals
the DV01.
Calculating Deltas to Facilitate Hedging
One of the problems with the delta measures that we have considered so
far is that they are not designed to make hedging easy. Consider the deltas
in Table 4.8. If we plan to hedge our portfolio with zero-coupon bonds,
we can calculate the position in a one-year zero-coupon bond to zero out
the $200 per basis point exposure to the one-year rate, the position in a
two-year zero-coupon bond to zero out the exposure to the two-year rate,
and so on. But, if other instruments are used, a much more complicated
analysis is necessary.
In practice, traders tend to use positions in the instruments that have
been used to construct the zero curve to hedge their exposure. For
example, a government bond trader is likely to take positions in the
actively traded government bonds that were used to construct the Treas-
ury zero curve when hedging. A trader of instruments dependent on the
LIBOR/swap yield curve is likely to take positions in LIBOR deposits,
Eurodollar futures, and swaps when hedging.
To facilitate hedging, traders therefore often calculate the impact of
small changes in the quotes for each of the instruments used to construct
the zero curve. Consider a trader responsible for interest rate caps and
swap options. Suppose that the trader's exposure to a one-basis-point
change in a Eurodollar futures quote is $500. Each Eurodollar futures
contract changes in value by $25 for a one-basis-point change in the
Eurodollar futures quote. It follows that the trader's exposure can be
hedged with 20 contracts. Suppose that the exposure to a one-basis-point
change in the five-year swap rate is $4,000 and that a five-year swap with a
notional principal of $1 million changes in value by $400 for a one-basis-
point change in the five-year swap rate. The exposure can be hedged by
trading swaps with a notional principal of $10 million.
4.10 PRINCIPAL COMPONENTS ANALYSIS
The approaches we have just outlined can lead to analysts calculating
10 to 15 different deltas for every zero curve. This seems like overkill
because the variables being considered are quite highly correlated with
each other. For example, when the yield on a five-year bond moves up by

Interest Rate Risk 101
Table 4.9 Factor loadings for US Treasury data.
3m
6m
12m
2y
3y
4y
5y
7y
l0y
30y
PC1
0.21
0.26
0.32
0.35
0.36
0.36
0.36
0.34
0.31
0.25
PC2
-0.57
-0.49
-0.32
-0.10
0.02
0.14
0.17
0.27
0.30
0.33
PC3
0.50
0.23
-0.37
-0.38
-0.30
-0.12
-0.04
0.15
0.28
0.46
PC4
0.47
-0.37
-0.58
0.17
0.27
0.25
0.14
0.01
-0.10
-0.34
PC5
-0.39
0.70
-0.52
0.04
0.07
0.16
0.08
0.00
-0.06
-0.18
PC6
-0.02
0.01
-0.23
0.59
0.24
-0.63
-0.10
-0.12
0.01
0.33
PC7
0.01
-0.04
-0.04
0.56
-0.79
0.15
0.09
0.13
0.03
-0.09
PC8
0.00
-0.02
-0.05
0.12
0.00
0.55
-0.26
-0.54
-0.23
0.52
PC9
0.01
-0.01
0.00
-0.12
-0.09
-0.14
0.71
0.00
-0.63
0.26
PC10
0.00
0.00
0.01
-0.05
-0.00
-0.08
0.48
-0.68
0.52
-0.13
a few basis points, most of the time the yield on a ten-year bond does the
same. Arguably a trader should not be worried when a portfolio has a
large positive exposure to the five-year rate and a similar large negative
exposure to the ten-year rate.
One approach to handling the risk arising from groups of highly
correlated market variables is principal components analysis. This takes
historical data on movements in the market variables and attempts to
define a set of components or factors that explain the movements.
The approach is best illustrated with an example. The market variables
we will consider are ten US Treasury rates with maturities between three
months and 30 years. Tables 4.9 and 4.10 show results produced by Frye
for these market variables using 1,543 daily observations between 1989
and 1995.
8
The first column in Table 4.9 shows the maturities of the rates
that were considered. The remaining ten columns in the table show the
ten factors (or principal components) describing the rate moves. The first
factor, shown in the column labeled PC1, corresponds to a roughly
Parallel shift in the yield curve. When we have one unit of that factor,
Table 4.10 Standard deviation of factor scores (basis points).
8
See J. Frye, "Principals of Risk: Finding VAR through Factor-Based Interest Rate
Scenarios." In VAR: Understanding and Applying Value at Risk, Risk Publications,
London, 1997, pp. 275-288.
PC1
17.49
PC2
6.05
PC3
3.10
PC4
2.17
PC5
1.97
PC6
1.69
PC7
1.27
PC8
1.24
PC9
0.80
PC10
0.79

102
Chapter 4
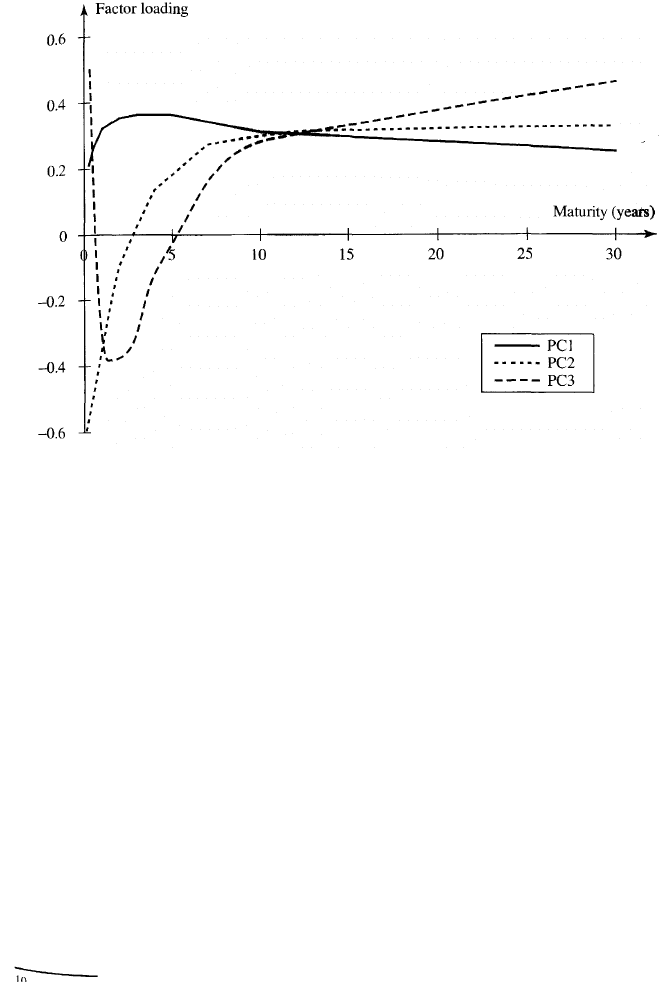
the three-month rate increases by 0.21 basis points, the six-month rate
increases by 0.26 basis points, and so on. The second factor is shown in
the column labeled PC2. It corresponds to a "twist" or change of slope of
the yield curve. Rates between three months and two years move in one
direction; rates between three years and 30 years move in the other
direction. The third factor corresponds to a "bowing" of the yield curve.
Rates at the short end and long end of the yield curve move in one
direction; rates in the middle move in the other direction. The interest rate
move for a particular factor is known as factor loading. In our example,
the first factor's loading for the three-month rate is 0.21.
9
As there are ten rates and ten factors, the interest rate changes observed
on any given day can always be expressed as a linear sum of the factors by
solving a set of ten simultaneous equations. The quantity of a particular
factor in the interest rate changes on a particular day is known as the
factor score for that day.
The importance of a factor is measured by the standard deviation of its
factor score. The standard deviations of the factor scores in our example
are shown in Table 4.10 and the factors are listed in order of their
importance. The numbers in Table 4.10 are measured in basis points. A
quantity of the first factor equal to one standard deviation, therefore,
corresponds to the three-month rate moving by 0.21 x 17.49 = 3.67 basis
points, the six-month rate moving by 0.26 x 17.49 = 4.55 basis points,
and so on.
The technical details of how the factors are determined are not covered
here. It is sufficient for us to note that the factors are chosen so that the
factor scores are uncorrelated. For instance, in our example, the first
factor score (amount of parallel shift) is uncorrelated with the second
factor score (amount of twist) across the 1,543 days. The variances of the
factor scores (i.e., the squares of the standard deviations) have the
property that they add up to the total variance of the data. From
Table 4.10, the total variance of the original data (i.e., sum of the
variance of the observations on the three-month rate, the variance of
the observations on the six-month rate, and so on) is
17.49
2
+ 6.05
2
+ 3.10
2
+ • • • + 0.79
2
= 367.9
From this, it can be seen that the first factor accounts for
17.49
2
/367.9 = 83.1% of the variance in the original data; the first two
factors account for (17.49
2
+ 6.05
2
)/367.9 = 93.1% of the variance in the
9
The factor loadings have the property that the sum of their squares for each factor is 1.0.
Interest Rate Risk
103
Figure 4.7 The three most important factors driving yield curve movements.
data; the third factor accounts for a further 2.6% of the variance. This
shows that most of the risk in interest rate moves is accounted for by the
first two or three factors. It suggests that we can relate the risks in a
portfolio of interest-rate-dependent instruments to movements in these
factors instead of considering all ten interest rates. The three most
important factors from Table 4.9 are plotted in Figure 4.7.
10
Using Principal Components Analysis to Calculate Deltas
To illustrate how a principal components analysis can provide an alter-
native way of calculating deltas, suppose we have a portfolio with the
exposures to interest rate moves shown in Table 4.11. A one-basis-point
change in the one-year rate causes the portfolio value to increase by
$10 million; a one-basis-point change in the two-year rate causes it to
increase by $4 million; and so on. We use the first two factors to model
rate moves. (As mentioned earlier, this captures over 90% of the un-
certainty in rate moves.) Using the data in Table 4.9, our delta exposure to
the first factor (measured in millions of dollars per factor-score basis
10
Results similar to those described here, with respect to the nature of the factors and
the amount of the total risk they account for, are obtained when a principal components
analysis is used to explain the movements in almost any yield curve in any country.
104
Chapter 4
Table 4.11 Change in portfolio value for a
one-basis-point rate move ($ millions).
1-year
rate
+ 10
2-year
rate
+4
3-year
rate
-8
4-year
rate
-1
5-year
rate
+2
point) is
10 x 0.32 + 4 x 0.35 - 8 x 0.36 - 7 x 0.36 + 2 x 0.36 = -0.08
and our delta exposure to the second factor is
10 x (-0.32) + 4 x (-0.10) - 8 x 0.02 - 7 x 0.14 + 2 x 0.17 = -4.40
The approach being used here is similar to the approach described in
Section 4.8 where partial durations are used to estimate the impact of
nonparallel shifts. The advantage of using a principal components ana-
lysis is that it tells you which are the most appropriate shifts to consider.
It also provides information on the relative importance of different shifts.
In the example we have considered, our exposure to the second shift is
about 50 times greater than our exposure to the first shift. However, the
first shift is about three times as important in terms of the extent to which
it occurs. (We base this last statement on the standard deviation of factor
scores reported in Table 4.10.)
4.11 GAMMA AND VEGA
When several delta measures are calculated, there are many possible
gamma measures. Suppose that ten instruments are used to compute
the zero curve and that we measure deltas with respect to changes in
the quotes for each of these. Gamma is a second partial derivative of the
form , where P is the portfolio value. We have ten choices for
x
i
and ten choices for x
j
and a total of 55 different gamma measures. This
may be "information overload". One approach is to ignore cross-gammas
and focus on the ten partial derivatives where i = j. Another is to
calculate a single gamma measure as the second partial derivative of
the value of the portfolio with respect to a parallel shift in the zero curve.
A further possibility is to calculate gammas with respect to the first two
factors in a principal components analysis. ,
Interest Rate Risk 105
The vega of a portfolio of interest rate derivatives measures its
exposure to volatility changes. Different volatilities are used to price
different interest rate derivatives. One approach is to make the same
small change to all volatilities and calculate the effect on the value of the
portfolio. Another is to carry out a principal components analysis to
calculate factors that reflect the patterns of volatility changes across
different instruments that tend to occur in practice. Vega measures can
be calculated for the first two or three factors.
SUMMARY
The compounding frequency used for an interest rate defines the units in
which it is measured. The difference between an annually compounded
rate and a quarterly compounded rate is analogous to the difference
between a distance measured in miles and a distance measured in kilo-
meters. Analysts frequently use continuous compounding when analyzing
derivatives.
Many different types of interest rates are quoted in financial markets
and calculated by analysts. The n-year zero rate or n-year spot rate is the
rate applicable to an investment lasting for n years when all of the return
is realized at the end. Forward rates are the rates applicable to future
periods of time implied by today's zero rates.
A zero-coupon yield curve shows the zero rate as a function of
maturity. Two important zero-coupon yield curves for risk managers
are the Treasury zero curve and the LIBOR/swap zero curve. The method
most commonly used to calculate zero curves is known as the bootstrap
method. It involves starting with short-term instruments and moving to
progressively longer-term instruments making sure that the zero rates
calculated at each stage are consistent with the prices of the instruments.
An important concept in interest rate markets is duration. Duration
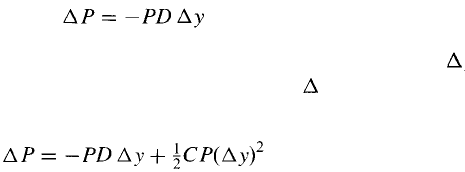
measures the sensitivity of the value of a portfolio to a small parallel shift
m the zero-coupon yield curve. An approximate relationship is
where P is the value of the portfolio, D is the duration of the portfolio, y
is the size of a small parallel shift in the zero curve, and P is the resultant
effect on the value of the portfolio. A more precise relationship is
106
Chapter 4
where C is the convexity of the portfolio. This relationship is accurate for
relatively large parallel shifts in the yield curve but does not quantify the
exposure to nonparallel shifts.
To quantify exposure to all the different ways the yield curve can
change through time, several duration or delta measures are necessary.
There are a number of ways these can be defined. A principal components
analysis can be a useful alternative to calculating multiple deltas. It shows
that the yield curve shifts that occur in practice are to a large extent a
linear sum of two or three standard shifts. If a portfolio manager is
hedged against these standard shifts, he or she is therefore also well
hedged against the shifts that occur in practice.
FURTHER READING
Allen, S. L., and A. D. Kleinstein. Valuing Fixed-Income Investments and
Derivative Securities. New York Institute of Finance, 1991.
Duffie, D. "Debt Management and Interest Rate Risk," in W. Beaver and
G. Parker (eds.) Risk Management: Challenges and Solutions. New York:
McGraw-Hill, 1994.
Fabozzi, F. J. Fixed-Income Mathematics: Analytical and Statistical Techniques.
New York: McGraw-Hill, 1996.
Fabozzi, F.J. Duration, Convexity, and Other Bond Risk Measures, Frank J.
Fabozzi Associates, 1999.
Grinblatt, M., and F.A. Longstaff. "Financial Innovation and the Role of
Derivatives Securities: An Empirical Analysis of the Treasury Strips
Program," Journal of Finance, 55, 3 (2000): 1415-1436.
Jorion, P. Big Bets Gone Bad: Derivatives and Bankruptcy in Orange County.
New York: Academic Press, 1995.
Stigum, M., and F. L. Robinson. Money Markets and Bond Calculations.
Chicago: Irwin, 1996.
QUESTIONS AND PROBLEMS (Answers at End of Book)
4.1. A bank quotes you an interest rate of 14% per annum with quarterly
compounding. What is the equivalent rate with (a) continuous compound-
ing and (b) annual compounding?
4.2. An investor receives $1,100 in one year in return for an investment of
$1,000 now. Calculate the percentage return per annum with (a) annual

Interest Rate Risk 107
compounding, (b) semiannual compounding, (c) monthly compounding,
and (d) continuous compounding.
4.3. A deposit account pays 12% per annum with continuous compounding,
but interest is actually paid quarterly. How much interest will be paid each
quarter on a $10,000 deposit?
4.4. What rate of interest with continuous compounding is equivalent to 15%
per annum with monthly compounding?
4.5. Suppose that zero interest rates with continuous compounding are as
follows:
Maturity
{years)
1
2
3
4
5
Rate
(% per annum)
2.0
3.0
3.7
4.2
4.5
Calculate forward interest rates for the second, third, fourth, and fifth
years.
4.6. Suppose that zero interest rates with continuous compounding are as
follows:
Maturity
(months)
3
6
9
12
15
18
Rate
(% per annum)
8.0
8.2
8.4
8.5
8.6
8.7
Calculate forward interest rates for the second, third, fourth, fifth, and
sixth quarters.
4.7. The term structure of interest rates is upward sloping. Put the following in
order of magnitude: (a) the five-year zero rate, (b) the yield on a five-year
coupon-bearing bond, and (c) the forward rate corresponding to the
period between 5 and 5.25 years in the future. What is the answer to this
question when the term structure of interest rates is downward sloping?
4.8. The six-month and one-year zero rates are both 10% per annum. For a
bond that has a life of 18 months and pays a coupon of 8% per annum