IEA Statistics. Oil Information 2011
Подождите немного. Документ загружается.

II.54 - OIL INFORMATION (2011 Edition)
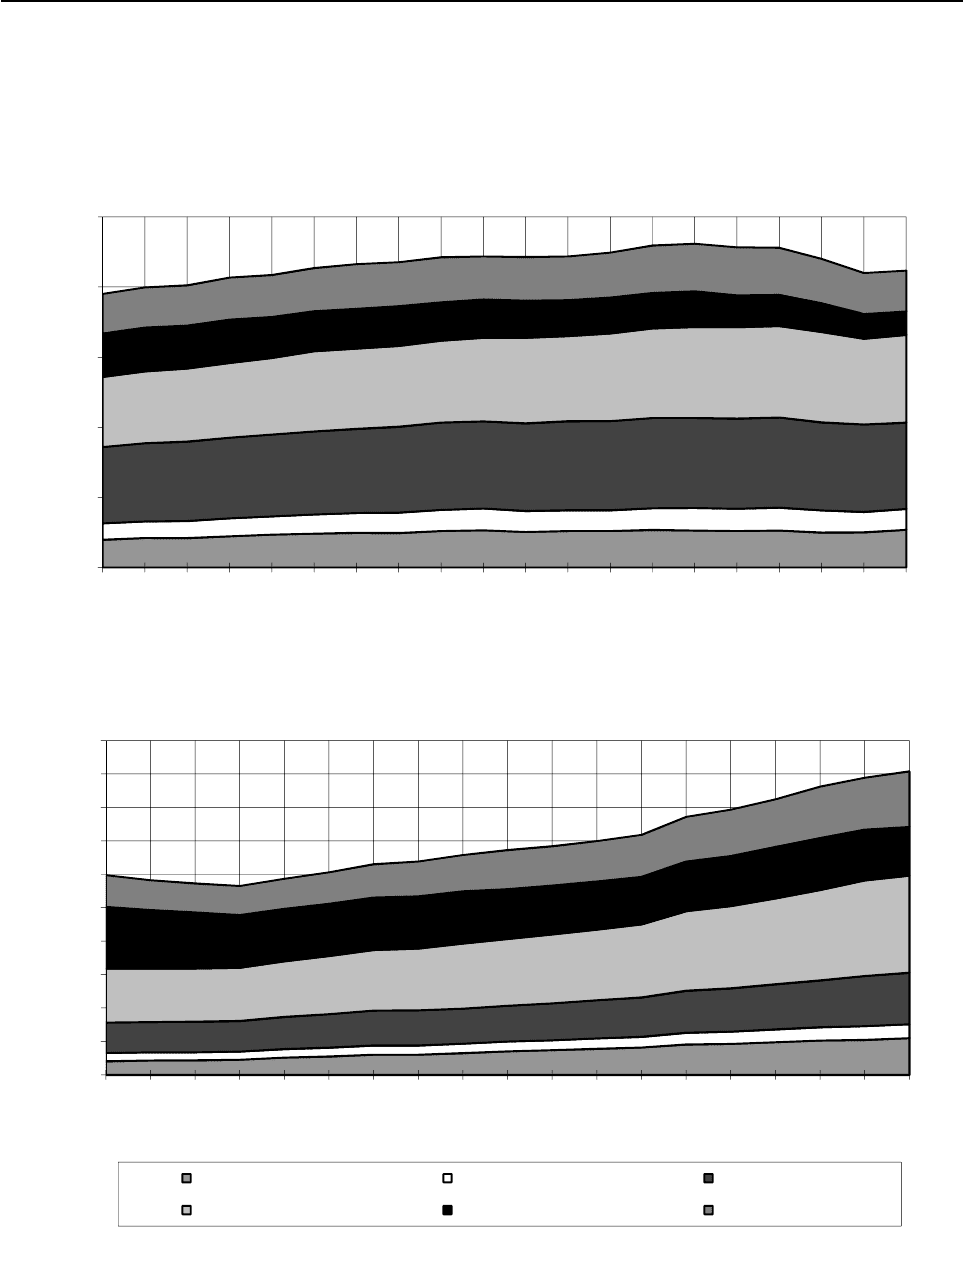
Graph 2
Demand by main product groups *
OECD Total
NON-OECD Total
0
500
1000
1500
2000
2500
1991
1992
1993
1994
1995
1996
1997
1998
1999
2000
2001
2002
2003
2004
2005
2006
2007
2008
2009
2010e
Million Metric Tons
1800
2000
* Demand refers to net deliveries (including refinery fuel and international marine bunkers).
0
200
400
600
800
1000
1200
1400
1600
1800
2000
1991
1992
1993
1994
1995
1996
1997
1998
1999
2000
2001
2002
2003
2004
2005
2006
2007
2008
2009
Million Metric Tons
LPG/Naphtha Aviation Fuels Motor Gasoline
Gas/Diesel Oil Residual Fuel Oil Other Products
INTERNATIONAL ENERGY AGENCY
II.55 - OIL INFORMATION (2011 Edition)
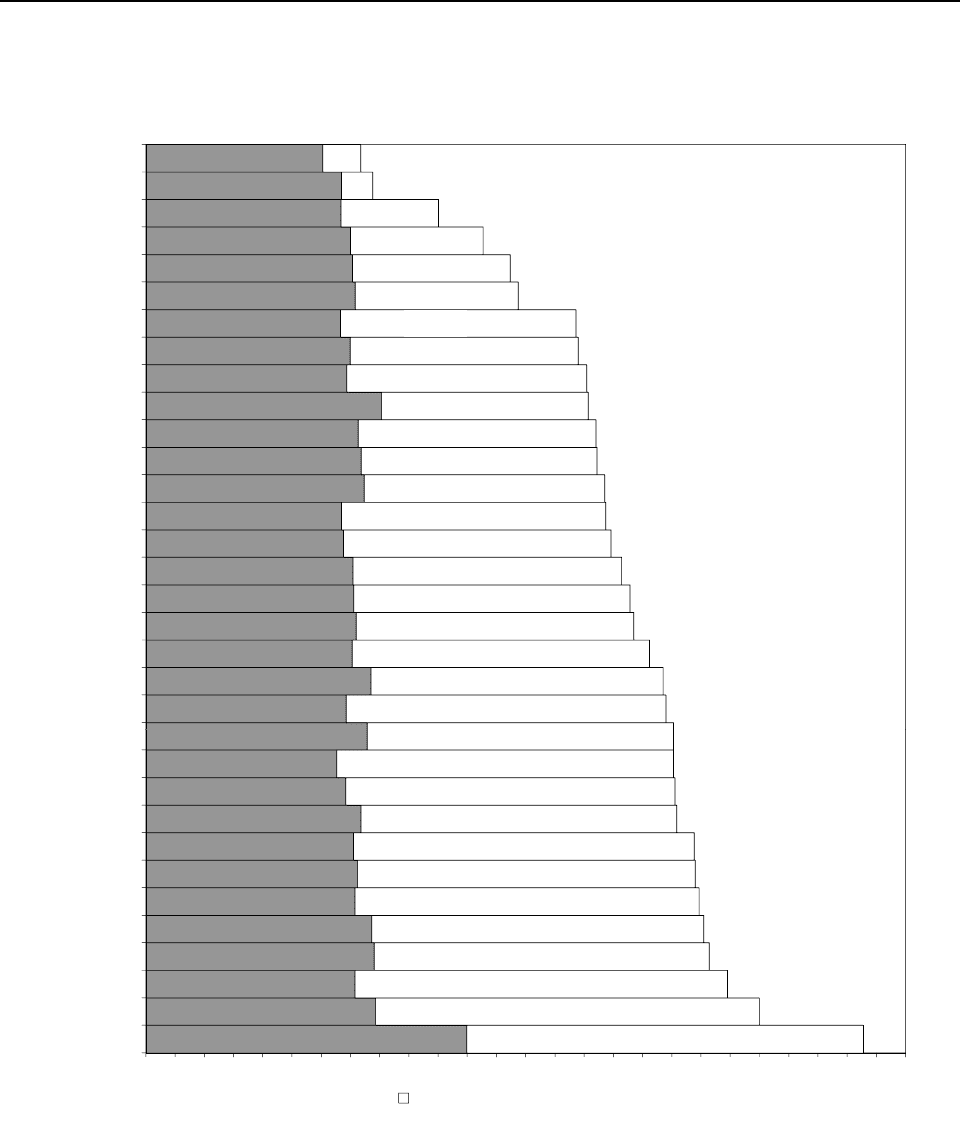
Graph 3
Unleaded motor gasoline prices and taxes*, 2010e
58.9%
63.4%
64.0%
57.0%
55.8%
53.9%
55.2%
55.0%
51.8%
56.0%
53.1%
52.6%
43.9%
41.0%
39.8%
32.3%
14.8%
21.8%
54.0%
45.4%
33.3%
10.7%
13.0%
United Kingdom
Italy
France
Israel
Ireland
Czech Republic
Slovak Republic
Hungary
Slovenia
Austria
Switzerland
Spain
Luxembourg
Japan
Poland
Korea
Estonia
New Zealand
Chile
Australia
Canada
Mexico
United States
* US Dollars per litre.
Regular unleaded for Australia, Canada, Japan, Korea, Mexico, and New Zealand.
Premium unleaded 95 for all other countries.
64.3%
62.7%
63.8%
61.1%
66.6%
59.9%
64.6%
63.7%
62.1%
60.5%
58.9%
63.4
%
0 0.1 0.2 0.3 0.4 0.5 0.6 0.7 0.8 0.9 1 1.1 1.2 1.3 1.4 1.5 1.6 1.7 1.8 1.9 2 2.1 2.2 2.3 2.4 2.5 2.6
Turkey
Norway
Netherlands
Belgium
Denmark
Finland
Greece
Germany
Portugal
Sweden
United Kingdom
Italy
Tax Component
INTERNATIONAL ENERGY AGENCY
II.56 - OIL INFORMATION (2011 Edition)
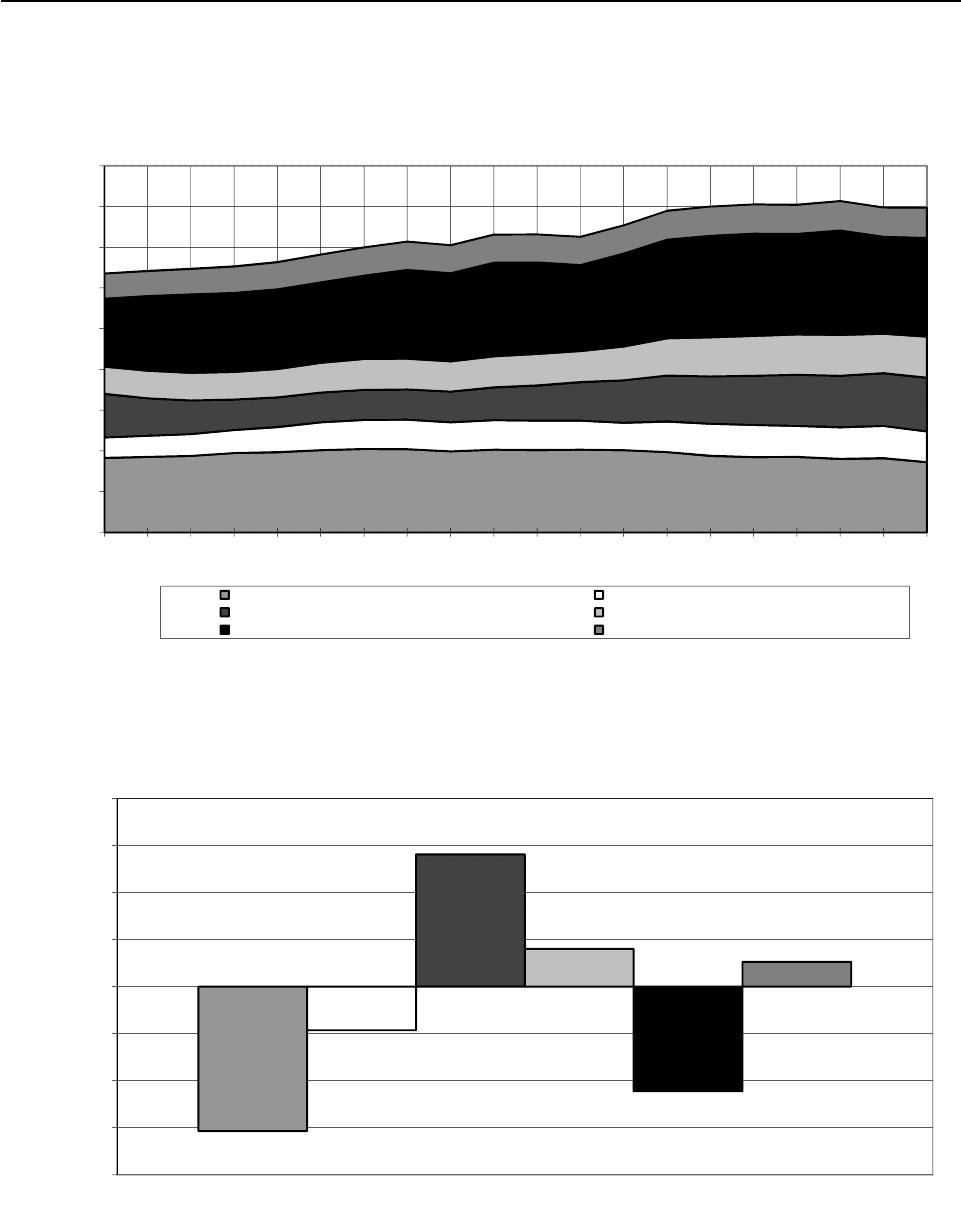
Graph 4
World crude oil and NGL production by region
Graph 5
Increase in oil production by region, 2006-2010e
0
500
1000
1500
2000
2500
3000
3500
4000
4500
1991 1992 1993 1994 1995 1996 1997 1998 1999 2000 2001 2002 2003 2004 2005 2006 2007 2008 2009 2010e
Million Metric Tons
OECD Total Latin America
Non-OECD Europe and Euroasia* Africa
Middle East Asia + China
* Non-OECD Europe and Eurasia includes the Former Soviet Union but it excludes Estonia.
-80
-60
-40
-20
0
20
40
60
80
Million Metric Tons
INTERNATIONAL ENERGY AGENCY

OIL INFORMATION (2011 Edition) - III.1
PART III
DETAILED OECD OIL DATA
For additional notes to following tables please refer to Part I, Sources and Notes.
INTERNATIONAL ENERGY AGENCY
OIL INFORMATION (2011 Edition) - III.3
OECD TOTAL
* Excluding electricity trade.
** Includes hydro, geothermal, solar, wind, combustible renewables and waste, etc.
Source: Annual Energy Balances.
0
10
20
30
40
50
60
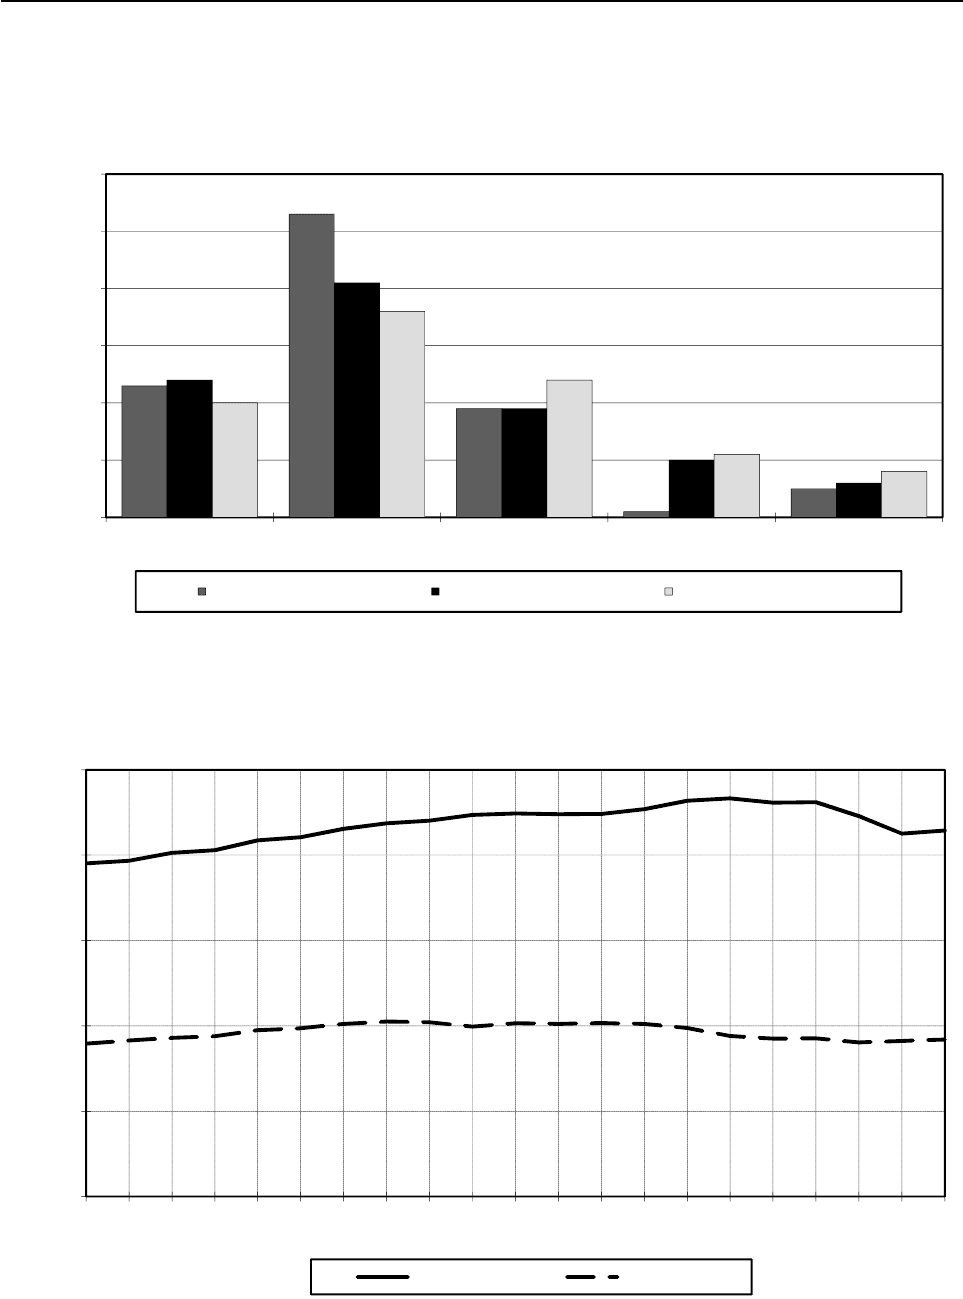
Coal Oil Gas Nuclear Other **
Percentage
Figure 1. Fuel shares of TPES *
1973 TPES = 3741 Mtoe 1990 TPES = 4522 Mtoe 2010e TPES = 5413 Mtoe
2500
Figure 2. Oil production and consumption
*** Includes refinery fuel and international marine bunkers.
Source: Annual Oil Statistics.
0
500
1000
1500
2000
2500
1990
1991
1992
1993
1994
1995
1996
1997
1998
1999
2000
2001
2002
2003
2004
2005
2006
2007
2008
2009
2010e
Million Metric Tons
Fi
gure
2
.
Oil
pro
d
uc
ti
on an
d
consump
ti
on
Consumption *** Production
INTERNATIONAL ENERGY AGENCY

III.4 - OIL INFORMATION (2011 Edition)
OECD TOTAL
Table 1: Oil supply and consumption - summary table
000 metric tons
1973 1978 1980 1990 2007 2008 2009 2010e
Indigenous production
1
685 504 742 150 822 276 895 296 927 245 903 246 911 356 920 269
Crude oil - 674 153 735 727 795 527 749 719 716 703 709 491 704 320
NGL - 66 523 76 980 84 651 103 582 100 996 102 751 104 987
Othe
r
- 1 474 9 569 15 118 73 944 85 547 99 114 110 962
+ Net imports 1365 335 1387 719 1211 235 1066 813 1357 132 1332 502 1207 897 1207 391
Crude oil, NGL, othe
r
1201 571 1255 217 1100 869 948 906 1265 816 1268 128 1149 412 1157 180
Oil products 163 764 132 502 110 366 117 907 91 316 64 374 58 485 50 211
- Intl. marine bunkers 75 152 74 914 76 858 74 910 106 107 99 975 90 089 88 105
+ Stock changes -21 770 16 328 -27 478 -16 833 8 153 -8 736 -1 012 829
TOTAL SUPPLY 1953 917 2071 283 1929 175 1870 366 2186 423 2127 037 2028 152 2040 384
Refinery intake 1833 526 1950 930 1866 729 1821 427 2124 861 2099 453 2007 506 2012 415
Refinery output 1832 548 1930 854 1850 143 1811 320 2111 832 2091 956 1999 585 2011 184
LPG + ethane 32 874 34 402 34 137 42 534 48 866 48 174 46 871 47 455
Naphtha 90 687 70 782 71 185 66 816 96 461 90 398 85 885 90 107
Kerosenes 114 072 111 195 111 944 144 267 182 957 183 017 171 257 172 805
Gasolines 441 223 510 946 494 207 549 952 612 463 605 702 607 655 604 833
Gas/diesel oil 438 245 466 857 449 595 471 689 640 934 657 956 621 573 628 442
Fuel oil 519 773 523 398 482 135 294 322 238 895 219 779 193 198 188 301
Other products 195 674 213 274 206 940 241 740 291 256 286 930 273 146 279 241
- Refinery losse
s
978 20 076 16 586 10 107 13 029 7 497 7 921 1 231
+ Returns 5 557 13 371 20 252 16 236 35 866 34 192 33 746 33 331
- Statistical differences -13 288 -4 857 2 910 - 202 6 178 26 044 18 434 17 148
TOTAL CONSUMPTION 1971 784 2069 435 1929 931 1876 697 2203 082 2127 688 2035 543 2055 336
Transformation and energy 406 685 423 293 380 548 294 012 260 983 239 980 219 167 ..
Crude oil 21 804 19 710 12 789 20 187 9 881 6 946 3 248 ..
LPG + ethane 3 915 4 846 6 687 7 817 8 075 7 656 7 256 ..
Gas/diesel oil 11 903 16 147 13 531 10 316 12 960 11 819 11 272 ..
Fuel oil 273 503 290 199 252 184 146 244 80 327 68 606 57 402 ..
Petroleum coke 14 603 15 114 16 014 24 813 37 032 35 823 35 524 ..
Othe
r
80 957 77 277 79 343 84 635 112 708 109 130 104 465 ..
Transport 661 247 764 165 751 253 923 878 1253 915 1225 176 1189 170 ..
Motor gasolin
e
436 542 499 037 473 395 532 837 633 204 619 130 616 205 ..
Gas/diesel oil 126 138 161 863 170 854 248 207 433 774 424 155 404 037 ..
Subtotal 562 680 660 900 644 249 781 044 1066 978 1043 285 1020 242 ..
Aviation fuels 76 263 81 617 85 133 119 464 161 020 156 758 143 767 ..
Othe
r
22 304 21 648 21 871 23 370 25 917 25 133 25 161 ..
Industry 516 358 511 962 489 696 407 752 472 353 443 660 418 696 ..
Naphtha 82 568 73 941 69 832 78 724 120 343 110 656 113 030 ..
LPG + ethane 46 677 45 057 55 046 63 774 85 375 81 207 82 145 ..
Gas/diesel oil 66 410 73 412 67 271 51 267 55 595 54 964 50 255 ..
Fuel oil 209 900 185 870 171 574 79 463 37 542 34 697 27 922 ..
Othe
r
110 803 133 682 125 973 134 524 173 498 162 136 145 344 ..
Other 387 494 370 015 308 434 251 055 215 831 218 872 208 510 ..
Gas/diesel oil 241 920 240 914 201 214 164 731 135 442 142 369 133 300 ..
Fuel oil 68 739 53 536 41 916 18 603 8 482 8 007 8 142 ..
Othe
r
76 835 75 565 65 304 67 721 71 907 68 496 67 068 ..
Memo: Non-energy use 214 444 243 044 237 704 262 910 373 677 349 623 336 342 ..
Chem/petchem. feedst. 114 789 129 902 124 285 147 274 223 590 209 375 209 729 ..
Other 99 655 113 142 113 419 115 636 150 087 140 248 126 613 ..
1. Includes inputs from other sources.
Source: Annual Oil Statistics.
INTERNATIONAL ENERGY AGENCY

OIL INFORMATION (2011 Edition) - III.5
OECD TOTAL
Table 2: Supply of crude oil, NGL, feedstocks and other hydrocarbons
000 metric tons
1973 1978 1980 1990 2007 2008 2009 2010e
CRUDE OIL
Indigenous productio
n
- 674 153 735 727 795 527 749 719 716 703 709 491 704 320
+ Imports - 1332 707 1209 258 1125 774 1550 964 1526 278 1399 813 1412 730
- Exports - 89 660 132 740 236 445 327 397 304 256 288 064 279 676
- Direct use - 20 004 12 956 20 227 9 955 7 018 3 315 4 462
+ Stock change - -3 660 -16 816 -7 204 3 163 -4 943 -1 860 430
- Statistical differences - 2 997 7 118 -6 503 10 420 17 447 6 136 6 036
Refinery intake - 1890 539 1775 355 1663 928 1956 074 1909 317 1809 929 1827 306
Closing stock level - 135 422 162 824 226 714 271 880 276 803 279 537 279 107
NATURAL GAS LIQUIDS
Indigenous productio
n
- 66 523 76 980 84 651 103 582 100 996 102 751 104 987
+ Imports - 6 819 11 663 15 171 25 550 26 080 26 610 24 295
- Exports - 4 191 6 466 11 368 17 064 18 306 18 714 18 420
- Direct use - 46 781 55 616 60 982 76 710 73 340 73 765 74 865
+ Stock change - 217 -1 936 - 216 145 12 719 - 720
- Statistical differences - 171 -1 138 - 986 350 741 469 831
Refinery intake - 22 416 25 763 28 242 35 153 34 701 37 132 34 446
Closing stock level - 10 493 11 433 3 380 4 540 4 528 3 809 4 529
REFINERY FEEDSTOCKS
Backflows - 12 935 19 262 14 159 27 820 25 985 24 923 24 943
+ Transfers - 9 540 14 721 44 846 23 706 43 164 46 259 45 121
+ Imports - 10 149 20 433 64 284 63 616 67 153 61 874 56 721
- Exports - 614 1 290 6 684 9 476 10 600 10 471 10 365
+ Stock change - 1 214 -1 203 1 983 544 - 136 1 951 - 829
- Statistical differences - -3 285 -4 123 1 697 - 229 16 - 687 - 18
Refinery intake - 36 509 56 046 116 891 106 439 125 550 125 223 115 609
Closing stock level - 24 784 31 150 32 466 30 205 30 341 28 391 29 220
OTHER HYDROCARBONS
Indigenous productio
n
- 1 474 9 569 15 118 73 944 85 547 99 114 110 962
+ Imports - 7 11 390 6 141 6 522 5 194 4 644
- Exports - - - 2 216 26 518 24 743 26 830 32 749
- Direct use - 15 15 581 26 613 36 419 41 435 49 065
+ Stock change - - - - 52 - 144 - 647 - 394 133
- Statistical differences - - - 293 - 385 375 427 -1 129
Refinery intake - 1 466 9 565 12 366 27 195 29 885 35 222 35 054
Closing stock level - - - 266 2 062 2 838 3 272 3 139
CRUDE OIL, NGL, FEEDSTOCKS AND OTHER
Indigenous productio
n
685 504 742 150 822 276 895 296 927 245 903 246 911 356 920 269
+ Backflows 5 020 12 935 19 262 14 159 27 820 25 985 24 923 24 943
+ Transfers 5 472 9 540 14 721 44 846 23 706 43 164 46 259 45 121
+ Imports 1263 705 1349 682 1241 365 1205 619 1646 271 1626 033 1493 491 1498 390
- Exports 62 134 94 465 140 496 256 713 380 455 357 905 344 079 341 210
- Direct use 64 469 66 800 68 587 81 790 113 278 116 777 118 515 128 392
+ Stock change -10 639 -2 229 -19 955 -5 489 3 708 -5 714 416 - 986
- Statistical differences -11 067 - 117 1 857 -5 499 10 156 18 579 6 345 5 720
Refinery intake 1833 526 1950 930 1866 729 1821 427 2124 861 2099 453 2007 506 2012 415
Closing stock level 126 514 170 699 205 407 262 826 308 687 314 510 315 009 315 995
Source: Annual Oil Statistics.
INTERNATIONAL ENERGY AGENCY

III.6 - OIL INFORMATION (2011 Edition)
OECD TOTAL
Table 3: Motor gasoline - supply
000 metric tons
1973 1978 1980 1990 2007 2008 2009 2010e
MOTOR GASOLINE
Refinery output 437 700 497 261 479 562 537 784 611 452 604 735 606 814 603 937
+ Imports 23 888 21 447 24 928 54 805 97 745 93 629 86 914 86 958
- Exports 15 673 19 100 21 683 44 480 87 321 88 419 88 029 93 698
+ Transfers 1 114 3 096 1 769 -1 350 24 445 17 001 24 568 29 831
+ Stock change -1 216 3 442 -4 147 -1 312 -1 760 2 464 - 781 635
- Statistical differences - 111 - 837 - 398 2 103 1 598 2 305 5 283 2 779
Total consumption 445 924 506 983 480 827 543 344 642 963 627 105 624 203 624 884
Closing stock level - 46 576 51 282 49 016 46 568 44 345 45 284 44 649
Table 4: Aviation fuels - supply
000 metric tons
1973 1978 1980 1990 2007 2008 2009 2010e
AVIATION GASOLINE
Refinery output 2 512 2 126 2 083 1 499 995 926 831 848
+ Imports 442 335 321 217 138 119 131 157
- Exports 336 224 400 283 189 205 150 115
+ Transfers - 4 90 - 34 2 - 9 - 24
+ Stock change 32 48 - 17 34 20 3 19 4
- Statistical differences 39 52 16 - 19 - 62 - 96 - 57 - 3
Total consumption 2 611 2 237 2 061 1 486 1 060 941 879 873
Closing stock level - 538 523 341 220 213 194 190
GASOLINE TYPE JET FUEL
Refinery output 1 011 11 559 12 562 10 669 16 41 10 48
+ Imports 320 623 1 182 305 45 329 52 7
- Exports 415 1 038 1 313 728 3 4 3 45
+ Transfers - - 33 59 - 69 - 4 - 7 - - 1
+ Stock change 6 - 35 21 71 10 1 - 1 2
- Statistical differences - 16 - 37 97 187 11 1 - 2 - 4
Total consumption 938 11 113 12 414 10 061 53 359 60 15
Closing stock level - 1 266 1 595 895 7 6 7 5
KEROSENE TYPE JET FUEL
Refinery output 67 573 66 655 71 564 110 867 148 031 151 132 138 619 140 136
+ Imports 15 460 9 342 9 947 16 677 39 989 39 012 38 518 37 604
- Exports 7 195 5 970 8 144 14 320 26 543 30 473 29 393 29 755
+ Transfers 961 - 157 - 247 - 544 92 - 877 - 316 802
+ Stock change - 751 280 - 769 -1 866 795 - 964 - 903 243
- Statistical differences 2 524 1 285 1 658 1 993 482 547 1 940 1 677
Total consumption 73 524 68 865 70 693 108 821 161 882 157 283 144 585 147 353
Closing stock level - 6 026 8 081 9 446 11 784 12 748 13 737 13 494
Source: Annual Oil Statistics.
INTERNATIONAL ENERGY AGENCY

OIL INFORMATION (2011 Edition) - III.7
OECD TOTAL
Table 5A: Gas/diesel oil - supply and consumption
000 metric tons
1973 1978 1980 1990 2007 2008 2009 2010e
Refinery output 438 245 466 857 449 595 471 689 640 934 657 956 621 573 628 442
+ Recycled products - - 8 30 26 29 38 64
+ Imports 78 285 66 352 64 681 89 573 132 791 142 605 146 581 156 385
- Exports 49 946 42 960 46 163 65 693 125 240 149 216 147 917 154 949
- Intl. marine bunkers 10 662 11 662 10 294 16 492 15 580 12 590 12 446 13 015
+ Transfers -1 219 1 619 - 674 -1 903 -1 027 195 527 980
+ Stock changes -8 360 10 579 -4 426 -5 177 2 889 -3 025 -4 554 1 460
- Statistical differences - 28 -1 551 - 143 -2 494 -2 978 2 647 4 938 6 079
Total consumption 446 371 492 336 452 870 474 521 637 771 633 307 598 864 613 288
Transformation 10 145 13 393 10 960 8 258 10 573 9 476 8 632 ..
Main activity producer electricity 9 618 10 962 7 732 5 273 8 262 7 643 6 563 ..
Autoproducer electricity 69 934 844 1 346 653 635 671 ..
Main activity producer CHP 57 109 101 69 225 191 272 ..
Autoproducer CHP - 2 1 33 331 119 214 ..
Main activity producer heat 30 53 42 139 278 218 317 ..
Autoproducer heat 92 319 317 150 9 9 9 ..
Petrochemical industry 221 975 1 878 1 232 802 661 586 ..
Other transformation 58 39 45 16 13 - - ..
Energy industry own use 1 758 2 754 2 571 2 058 2 387 2 343 2 640 ..
Refinery fuel 1 102 2 092 1 949 1 254 1 235 1 221 1 420 ..
Other energy industry 656 662 622 804 1 152 1 122 1 220 ..
Final consumption 434 468 476 189 439 339 464 205 624 811 621 488 587 592 ..
Transport
126 138 161 863 170 854 248 207 433 774 424 155 404 037 ..
Aviation - - - 1 1 1 1 ..
Road 89 166 119 980 128 075 219 795 404 021 397 421 380 604 ..
Rail 22 204 22 596 21 992 17 744 19 259 16 687 14 403 ..
Domestic navigation 10 224 10 148 10 263 8 090 9 016 8 896 7 977 ..
Non-specified 4 544 9 139 10 524 2 577 1 477 1 150 1 052 ..
Industry
66 410 73 412 67 271 51 267 55 595 54 964 50 255 ..
Iron and steel 1 872 1 706 1 409 1 107 2 076 1 209 1 061 ..
Chemical (incl. pet.-chem.) 2 728 4 400 5 080 5 084 9 511 10 300 9 425 ..
Non-ferrous metals 898 980 1 011 496 913 974 770 ..
Non-metallic minerals 3 764 3 179 2 230 1 727 5 682 5 763 5 232 ..
Transport equipment 807 817 806 499 956 872 773 ..
Machinery 2 359 2 352 2 083 3 274 2 919 2 313 2 022 ..
Mining and quarrying 1 185 1 838 2 143 2 519 4 962 4 935 4 978 ..
Food and tobacco 2 882 3 465 3 408 3 745 5 634 5 261 4 848 ..
Pulp, paper and printing 648 617 818 796 2 302 2 353 2 178 ..
Wood and wood products 548 1 092 1 066 395 2 310 3 461 3 117 ..
Construction 4 228 6 622 6 589 7 823 8 194 8 413 8 049 ..
Textiles and leather 944 963 898 515 826 478 413 ..
Non-specified 43 547 45 381 39 730 23 287 9 310 8 632 7 389 ..
Other
241 920 240 914 201 214 164 731 135 442 142 369 133 300 ..
Commerce and public 69 002 71 402 57 480 50 757 43 115 44 942 42 935 ..
Residential 127 111 126 095 98 649 72 341 50 312 54 566 49 709 ..
Agriculture (incl. fishing) 26 303 31 047 32 642 39 432 40 703 41 689 39 502 ..
Non-specified 19 504 12 370 12 443 2 201 1 312 1 172 1 154 ..
Memo: Non-energy use 1 933 4 018 5 272 5 392 4 779 4 171 3 743 ..
Chem/petchem. feedst. 1 712 3 043 3 394 4 159 3 970 3 504 3 149 ..
Other 221 975 1 878 1 233 809 667 594 ..
Closing stock level - 81 731 94 554 67 848 75 520 78 480 83 464 82 004
Source: Annual Oil Statistics.
INTERNATIONAL ENERGY AGENCY