Kline R.B. Principles and Practice of Structural Equation Modeling
Подождите немного. Документ загружается.

44 CONCEPTS AND TOOLS
tests were also considered, including the need to avoid common misinterpretations of
statistical significance. Results of statistical tests in SEM generally apply to unstandard-
ized estimates only, not to the corresponding standardized estimates. Also reviewed in
this chapter was the basic logic of bootstrapping, a resampling technique that can be
applied to estimate standard errors for statistics with complex distributions.
reCoMMended readIngs
The book by Cohen, Cohen, West, and Aiken (2003) is considered by many as a kind of
“bible” of the multiple regression technique. The suggested chapters in Kline (2004) concern
the correct interpretation of statistical tests and related statistics, such as standard errors (chaps.
1–3), and an introduction to bootstrapping (chap. 9). A more comprehensive review of boot-
strap methods for estimation, regression, forecasting, and simulation is available in Chernick
(2008).
Chernick, M. R. (2008). Bootstrap methods: A guide for practitioners and researchers (2nd
ed.). Hoboken, NJ: Wiley.
Cohen, J., Cohen, P., West, S. G., & Aiken, L. S. (2003). Applied multiple regression/correla-
tion analysis for the behavioral sciences (3rd ed.). Mahwah, NJ: Erlbaum.
Kline, R. B. (2004). Beyond significance testing: Reforming data analysis methods in behav-
ioral research. Washington, DC: American Psychological Association.
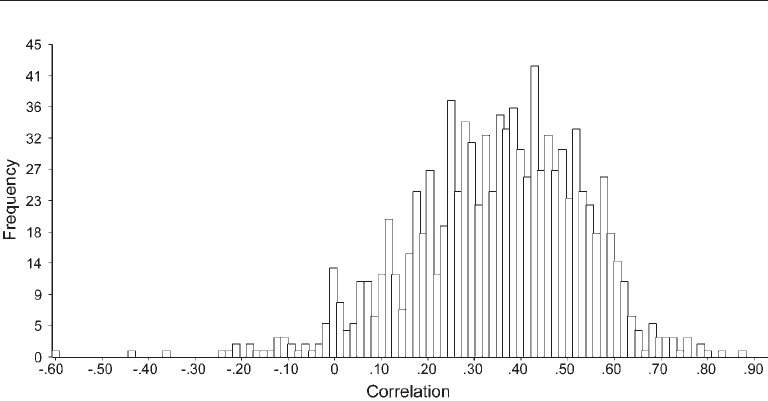
FIgure 2.4. Empirical sampling distribution for the Pearson correlation r
XY
in 1,000 boot-
strapped samples for the data in Table 2.3.

Fundamental Concepts 45
eXerCIses
1. For the data in Table 2.1, calculate
12Y
R
⋅
, the unstandardized regression equa-
tion, and the standardized regression weights. Interpret the results assuming
X
1
, X
2
, and Y are, respectively, measures of working memory, phonics skill, and
reading achievement.
2. Calculate scores on
ˆ
Y
and Y –
ˆ
Y
for the data in Table 2.1. Show that
12Y
R
⋅
=
ˆ
YY
r
. Also show that the equality expressed in Equation 2.2 is true.
3. Calculate scores on
ˆ
Y
z
and z
Y
–
ˆ
Y
z
for the data in Table 2.1. Show that the
residuals in standardized form are uncorrelated with each predictor in stan-
dardized form.
4. Calculate a shrinkage-corrected
2
12Y
R
⋅
for the data in Table 2.1. Interpret the
results.
5. Calculate
12Y
R
⋅
, b
1
, and b
2
, given r
Y1
= .40, r
Y2
= .50, and r
12
= –.30. Describe the
results.
6. Use Equation 2.10 to calculate the partial correlation between X and Y control-
ling for W, given these Pearson correlations: r
XY
= .50, r
XW
= .80, and r
YW
=
.60.
7. Suppose that the 95% confidence interval for the difference between two means
in a particular sample is 75.25–84.60. Explain what is wrong with this state-
ment: “There is a 95% chance that the interval 75.25–84.60 contains the popu-
lation mean difference µ
1
– µ
2
.”
8. Find three incorrect definitions of statistical significance on the Internet. Hint:
In Google, type “define: statistical significance.” Explain what is wrong with
each.

46
3
Data Preparation
The main topics of this chapter—data preparation and screening—are critical for two
reasons. First, the most widely used estimation methods in SEM make specific distribu-
tional assumptions about the data. These assumptions must be taken seriously because
violation of them could result in bias. Second, data-related problems can make SEM
computer programs fail to yield a logical solution. A researcher who has not properly
prepared and screened the data could mistakenly believe that the model is at fault.
Also reviewed are concepts from measurement theory about score reliability and valid-
ity. It is not possible to cover all aspects of data screening and psychometrics in a
single chapter, but more advanced works are cited throughout, and these should be
consulted for more information. This adage attributed to Abraham Lincoln sets the tone
for this chapter: If I had eight hours to chop down a tree, I’d spend six sharpening my
axe.
ForMs oF InPut data
Most primary researchers—those who conduct original studies—input raw data files
for a primary analysis with SEM computer programs. These same researchers may
be surprised to learn that the raw data themselves are not necessary for many—and
perhaps most—types of SEM. This is also true, however, for many other statistical tech-
niques. For example, presented in the top part of Table 3.1 is syntax that instructs SPSS
to conduct a one-way analysis of variance (ANOVA) using only summary statistics that
include group means, standard deviations, and sizes. In the bottom part of the table is
SPSS syntax for conducting a multiple regression analysis with summary statistics that
include the sample correlation matrix, means, and standard deviations. The “Matrix
Data” commands in both sets of syntax define the summary statistics.
The capability to analyze summary statistics provides the basis for a secondary
analysis where data collected by others are reanalyzed but where the raw data are

Data Preparation 47
unavailable. The technique of meta-analysis is a type of secondary analysis in which
summary statistics from a set of primary studies are analyzed altogether. Many journal
articles about the results of SEM contain enough information, such as correlations and
standard deviations, to create a matrix summary of the data, which can then be submit-
ted to a computer program for analysis. Thus, readers of these works can, with no access
to the raw data, replicate the original analyses or estimate alternative models not con-
sidered in the original work. You can replicate analyses described in this book using the
data matrix summaries that accompany each example (see p. 3). This is a great way to
learn because you can make mistakes using someone’s data before analyzing your own.
Basically all SEM computer tools accept either a raw data file or a matrix summary
of the data. If a raw data file is submitted, the program will create its own matrix, which
is then analyzed. You should consider the following issues when choosing between a
raw data file and a matrix summary as program input:
taBle 3.1. examples in sPss syntax of statistical analyses Conducted with
summary statistics
Analysis of variance
comment one-way anova with summary statistics.
matrix data variables=GROUP rowtype_ DV/factors=GROUP.
begin data
1 n 50
2 n 55
3 n 65
1 mean 66.25
2 mean 60.25
3 mean 69.30
1 sd 23.50
2 sd 23.25
3 sd 22.95
end data.
oneway DV by GROUP/statistics=descriptives/matrix=in(*).
Multiple regression
comment mr with summary statistics.
matrix data variables=v1 to v4/contents=mean sd n corr
/format=lower nodiagonal.
begin data
10.25 8.50 9.15 5.40
3.45 4.50 7.35 5.30
100 100 100 100
.35
.40 .30
.30 .35 .50
end data.
regression matrix=in(*)/variables=v1 to v4/dependent=v4/enter.

48 CONCEPTS AND TOOLS
1. Some special kinds of analyses require raw data files. One is when non-normal
data are analyzed with an estimation method that assumes normality—this includes
the default method of maximum likelihood (ML)—but test statistics are calculated that
correct for non-normality. You should know that default ML estimation does not handle
incomplete raw data files. However, there are special forms of ML estimation available in
some SEM computer tools—including Amos, EQS, LISREL, and Mplus—for analyzing
incomplete data sets. For analyses that do not involve any of these applications—and
many do not—either the raw data or a matrix summary of them can be analyzed.
2. Matrix input offers a potential economy over raw data files. Suppose that 1,000
cases are measured on 10 variables. The raw data file may be 1,000 lines (or more) in
length, but a matrix summary for the same data might be only 10 lines long.
3. Sometimes one might “make up” a data matrix using theory or results from a
meta-analysis, so there are no raw data, only a matrix summary. A made-up data matrix
can be submitted to an SEM computer tool for analysis. This is also a way to diagnose
certain technical problems that can crop up in SEM. This point is elaborated in later
chapters.
If means are not analyzed, there are two basic types of summaries of raw data—
correlation matrices with standard deviations and covariance matrices. For example,
presented in the top part of Table 3.2 are the correlation matrix with standard devia-
tions (left) and the covariance matrix (right) for the raw data in Table 2.1 on three
variables. (Whenever possible, four-decimal accuracy is recommended for matrix input.
Precision at this level helps to minimize rounding error in computer analysis.) Both of
these matrices in Table 3.2 are in lower diagonal form where only the unique values of
correlations or covariances are reported in the lower-left-hand side of the matrix. Most
SEM computer programs accept lower diagonal matrices as an alternative to full ones,
taBle 3.2. Matrix summaries of the data in table 2.1
Variables Variables
X
1
X
2
Y X
1
X
2
Y
Summaries without means
Correlations, standard deviations Covariances
1.0000 38.5000
.4699 1.0000 42.5000 212.5000
.6013 .7496 1.0000 17.5000 51.2500 22.0000
6.2048 14.5773 4.6904
Summaries with means
Correlations, standard deviations, means Covariances, means
1.0000 38.5000
.4699 1.0000 42.5000 212.5000
.6013 .7496 1.0000 17.5000 51.2500 22.0000
6.2048 14.5773 4.6904 11.0000 60.0000 25.0000
11.0000 60.0000 25.0000

Data Preparation 49
with (redundant) entries above and below the diagonal, and can “assemble” a covariance
matrix given the correlations and standard deviations.
It may be problematic to submit for analysis just a correlation matrix without stan-
dard deviations or specify that all standard deviations equal 1.0, which standardizes
everything.
1
This is because the default method of ML estimation (and most other meth-
ods, too) assumes that the variables are unstandardized. This means that if a correlation
matrix without standard deviations is analyzed, the results may not be correct. This
point is elaborated in Chapter 7 about estimation, but potential problems include the
derivation of incorrect standard errors for standardized estimates if special methods
for standardized variables are not used. Some SEM computer programs give warning
messages or terminate the run if the researcher requests the analysis of a correlation
matrix only with standard ML estimation. Thus, it is generally safer to analyze a covari-
ance matrix or a correlation matrix with standard deviations. Accordingly, covariances
are analyzed for almost all of the examples presented in this book. When a correlation
matrix only is analyzed, I use a special method described in Chapter 7 for standardized
variables. The issues just discussed about the pitfalls of analyzing correlation matrices
without standard deviations explain why you must clearly state in written reports the
specific kind of data matrix analyzed and the estimation method used to do so.
Matrix summaries of raw data must consist of the covariances and means whenever
means are analyzed in SEM. Presented in the lower part of Table 3.2 are matrix sum-
maries of the data in Table 2.1 that include the correlations, standard deviations, and
means (left) and the covariances and means (right). Both of these matrices convey the
same information. Even if your analysis does not concern means, you should neverthe-
less report the means of all variables. You may not be interested in analyzing the means,
but someone else may be. Always report sufficient summary statistics (including the
means) so that others can reproduce your results in a secondary analysis (McDonald &
Ho, 2002).
PosItIve deFInIteness
The data matrix that you submit for analysis to an SEM computer tool should have the
property that it is positive definite (PD), which is required for most estimation meth-
ods. A matrix that lacks this characteristic is nonpositive definite (NPD), and attempts
to analyze such a data matrix will probably fail. A PD data matrix has the properties
summarized next (Wothke, 1993):
1. The matrix is nonsingular, or invertible. In most kinds of multivariate analyses
(SEM included), the computer needs to derive the inverse of the data matrix as part of
linear algebra operations. A matrix that is not invertible is singular.
1
By the same token, it would also be problematic to convert raw scores to z scores and then submit for
analysis the data file of standardized scores.

50 CONCEPTS AND TOOLS
2. All eigenvalues of PD matrices are positive (> 0). An eigenvalue is the variance
of an eigenvector, which is a linear combination of the observed variables where all
the weights are not zero. An eigenvalue is the unstandardized proportion of variance
explained by the corresponding eigenvector, and the variance of that composite (its
eigenvalue) cannot logically be less than zero. The total number of pairs of eigenval-
ues and eigenvectors for a data matrix equals the number of observed variables. For
example, if a covariance matrix is based on 10 variables, then there are a total of 10
eigenvalue-eigenvector pairs.
3. A related property is that the determinant of a PD matrix is greater than zero.
If the determinant is zero, then the matrix is singular. A determinant equals the serial
product (the first times the second times the third, and so on) of the eigenvalues, so if a
determinant is negative, then some odd number of the eigenvalues (1 or 3 or 5, etc.) must
be negative. A negative determinant indicates an NPD matrix.
4. In a PD data matrix, none of the correlations or covariances are out of bounds.
An out-of-bounds matrix element is one that would be mathematically impossible to
derive if all entries were calculated using data from the same cases. This property is
explained next.
The value of the Pearson correlation between two variables X and Y is limited by the
correlations between these variables and a third variable W. Specifically, the value of r
XY
must fall within the following range:
22
( ) (1 ) (1 )
XW YW XW YW
rrrr×±−−
(3.1)
For example, if r
XW
= .60 and r
YW
= .40, then the value of r
XY
must be within the range
.24 ± .73 (i.e., –.49–.97). Any other value for r
XY
would be out of bounds. Another way
to view Equation 3.1 is that it specifies a triangle inequality for values of correlations
among three variables measured in the same sample.
2
In a PD data matrix, the maximum absolute value of cov
XY
, the covariance between
X and Y, must respect the upper limit defined next:
22
max
XY X Y
cov s s≤
(3.2)
where
2
X
s
and
2
Y
s
are, respectively, the sample variances of X and Y. In words, the maxi-
mum absolute value for the covariance between any two variables is less than or equal
to the square root of the product of their variances. Otherwise, the value of cov
XY
is out
of bounds. For example, given
cov
XY
= 13.00,
2
X
s
= 12.00, and
2
Y
s
= 10.00
2
In a geometric triangle, the length of a given side must be less than the sum of the lengths of the other two
sides but greater than the difference between the lengths of the two sides.

Data Preparation 51
then the covariance between X and Y would be out of bounds because
13.00 > (12.00 × 10.00)
1/2
= 10.95
which violates Equation 3.2. The value of r
XY
for this example is also out of bounds
because it equals 1.19. An exercise will ask you to verify this fact.
An NPD data matrix has at least one eigenvalue ≤ 0. Many computer programs for
multivariate statistical analyses, including those for SEM, print eigenvalues in the out-
put, so this sign of trouble is apparent. An eigenvalue of zero indicates that the matrix
is singular. A negative eigenvalue could indicate a few different problems. One is the
presence of an out-of-bounds entry in the data matrix (i.e., Equations 3.1–3.2 do not
hold). Another is perfect collinearity either between a pair of variables (e.g., r
XY
= 1.00)
or between a variable and at least two others (e.g.,
⋅Y XW
R
= 1.00). It can also happen that
near-perfect collinearity (e.g., r
XY
= .95) manifested as positive but near-zero eigenvalues
can cause matrix inversion operations to fail. It is easy to spot bivariate collinearity by
inspecting the correlation matrix. A way to detect multivariate collinearity among three
or more variables is described later in this chapter. See Topic Box 3.1 for more informa-
tion about causes of nonpositive definiteness in the data matrix and possible solutions.
data sCreenIng
Before analyzing in SEM either a raw data file or a matrix summary, the original data file
should be screened for the problems considered next. Some of these potential problems
are causes of NPD data matrices, but others concern distributional assumptions for con-
tinuous outcomes.
Collinearity
Extreme collinearity can occur because what appear to be separate variables actually
measure the same thing. Suppose that X measures accuracy and Y measures speed. If
r
XY
= .95, for example, then variables X and Y are redundant despite their different labels
(speed is accuracy and vice versa). Either one or the other could be included in the same
analysis, but not both. Researchers can inadvertently cause extreme collinearity when
composite variables and their constituent variables are analyzed together. Suppose that
a questionnaire has 10 items and the total score is summed across the items. Although
the bivariate correlations between the total score and each of the individual items may
not be high, the multiple correlation between the total score and the items must equal
1.00, which is collinearity in its most extreme form.
Some methods and statistics to detect collinearity among three or more variables
are summarized next. Most of these are available in regression diagnostics procedures of
programs for general statistical analyses, such as SPSS and SAS/STAT:

52 CONCEPTS AND TOOLS
toPIC BoX 3.1
Causes of nonpositive definiteness and solutions
Many points summarized here are from Wothke (1993).* Some causes of non-
positive definite (NPD) data matrices are listed next. Most can be detected
through careful data screening:
1. Extreme bivariate or multivariate collinearity among the observed vari-
ables.
2. The presence of outliers, especially those that force values of correlations to
be extremely high.
3. Pairwise deletion of cases with missing data.
4. Making a typing mistake when transcribing a data matrix from one source,
such as a table in a journal article, to another, such as a command file for
computer analysis, can also result in an NPD matrix. For example, if the
value of a covariance in the original matrix is 15.00, then mistakenly typing
150.00 in the transcribed matrix could generate an NPD covariance matrix
with elements that violate Equation 3.2. It is so easy to make a typing mis-
take during manual entry of a data matrix that errors are almost guaran-
teed, especially when the number of variables exceeds 10 or so. Follow this
simple but effective advice from Wilkinson and the Task Force on Statistical
Inference (1999) whenever you transcribe a data matrix: look at the data,
that is, carefully compare, entry by entry, the original data matrix with your
transcribed matrix before you attempt to analyze it with the computer.
5. Plain old sampling error can generate NPD data matrices, especially if
the number of cases is relatively small or the sample is unrepresentative.
The former condition can be addressed by increasing the sample size; the
unrepresentativeness may be the result of using a sampling method that
selects atypical cases.
6. Sometimes matrices of estimated Pearson correlations, such as polyserial
or polychoric correlations derived for noncontinuous observed variables
(Chapter 2), are NPD. This may be especially true if polyserial or poly-
choric correlations are estimated in a pairwise manner instead of simul-
taneously estimating the whole correlation matrix. Pairwise calculation of
non-Pearson correlations is an older method that required less computer
memory, but this goal is less relevant given today’s personal computers
with relatively large memory capacities. Modern computer tools, such as
the PRELIS program of LISREL, can simultaneously estimate the whole cor-
relation matrix.
*See also E. Rigdon’s webpage on nonpositive definite matrices in SEM at www2.gsu.
edu/~mkteer/npdmatri.html

Data Preparation 53
1. Calculate a squared multiple correlation (
2
sm c
R
) between each variable and all
the rest. That is, run several multiple regressions, each with a different variable as the
criterion and the rest as predictors. The observation that
2
sm c
R
> .90 for a particular vari-
able analyzed as the criterion suggests extreme multivariate collinearity.
2. A related statistic is tolerance, which equals 1 –
2
sm c
R
and indicates the propor-
tion of total standardized variance that is unique (not explained by all the other vari-
ables). Tolerance values < .10 may indicate extreme multivariate collinearity.
3. Another is the variance inflation factor (VIF). It equals 1/(1 –
2
sm c
R
), the ratio
Here is a tip about diagnosing whether a data matrix is positive definite before
submitting it for analysis to an SEM computer program: Copy the full matrix (with
redundant entries above and below the diagonal) into a text (ASCII) file, such as
Microsoft Windows Notepad. Next, point your Internet browser to a free, online
matrix calculator and then copy the data matrix into the proper window on
the calculating webpage.* Finally, select options on the webpage to derive the
determinant and eigenvalues of the data matrix. Look for outcomes that indicate
nonpositive definiteness, such as near-zero, zero, or negative eigenvalues.
Some SEM computer programs, such as LISREL, offer options for making
a ridge adjustment to an NPD data matrix. The ridge technique iteratively
multiplies the diagonal entries of the matrix by a constant > 1.0 until negative
eigenvalues disappear (the matrix becomes positive definite). For covariance
matrices, ridge adjustments increase the values of the variances until they are
large enough to exceed any out-of-bounds covariance entry in the off-diagonal
part of the matrix (Equation 3.2 will be satisfied). This technique “fixes up” a
data matrix so that necessary algebraic operations can be performed (Wothke,
1993). However, the resulting parameter estimates, standard errors, and model
fit statistics will be biased after applying a ridge correction. For this reason, I do
not recommend that you use a ridge technique to analyze an NPD data matrix
unless you are very familiar with linear algebra (i.e., you know what you are
doing and why). Instead, you should try to solve the problem of nonpositive
definiteness through data screening or increasing the sample size.
There are other contexts where you may encounter NPD matrices in SEM, but
these generally concern (1) matrices of parameter estimates for your model or
(2) matrices of covariances or correlations predicted from your model that could
be compared with those observed in your sample. A problem in the analysis is
indicated if any of these matrices is NPD. We will deal with these contexts in
later chapters.
*www.bluebit.gr/matrix-calculator/