Koren B., Vuik K. (Editors) Advanced Computational Methods in Science and Engineering
Подождите немного. Документ загружается.

Stefan Luding
ε
p
x
x
z
zz
tz(
T
)
z
z
0
f
t
0 /2
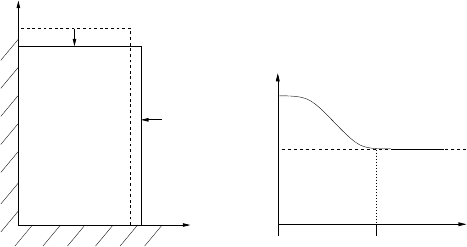
Fig. 6 (Left) Schematic drawing of the model system. (Right) Position of the top-wall as function
of time for the strain-controlled situation.
m
w
¨x(t) = F
x
(t) − p
x
z(t) −
γ
w
˙x(t) , (36)
where m
w
is the mass of the right side wall. Large values of m
w
lead to slow adap-
tion, small values allow for a rapid adaption to the actual situation. Three forces are
active: (i) the force F
x
(t) due to the bulk material, (ii) the force −p
x
z(t) due to the
external pressure, and (iii) a strong frictional force which damps the motion of the
wall so that oscillations are reduced.
6.2.3 Initial configuration and compression
Initially, the particles are randomly distributed in a huge box, with rather low overall
density. Then the box is compressed, either by moving the walls to their desired
position, or by defining an external pressure p = p
x
= p
z
, in order to achieve an
isotropic initial condition. Starting from a relaxed, isotropic initial configuration,
the strain is applied to the top wall and the response of the system is examined. In
Fig. 7, snapshots from a typical simulation are shown during compression.
In the following, simulations are presented with different side pressures p = 20,
40, 100, 200, 400, and 500. The behavior of the averaged scalar and tensor variables
during the simulations is examined in more detail for situations with small and large
confining pressure. The averages are performed such that 10 to 20% of the total
volume is disregarded in the vicinity of each wall in order to avoid boundary effects.
A particle contact is taken into account for the average if the contact point lies within
the averaging volume V.
6.2.4 Compression and dilation
The first quantity of interest is the density (volume fraction)
ν
and, related to it, the
volumetric strain
ε
V
=
∆
V/V . From the averaged data, we evidence compression
478
From Particles to Continuum Theory
ε
zz
= 0
ε
zz
= 0.042
ε
zz
= 0.091
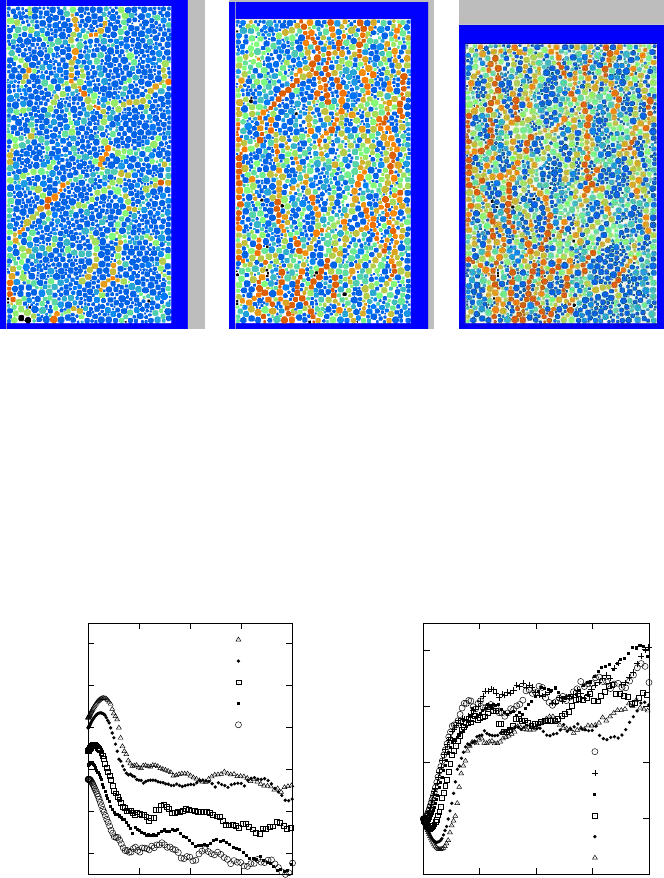
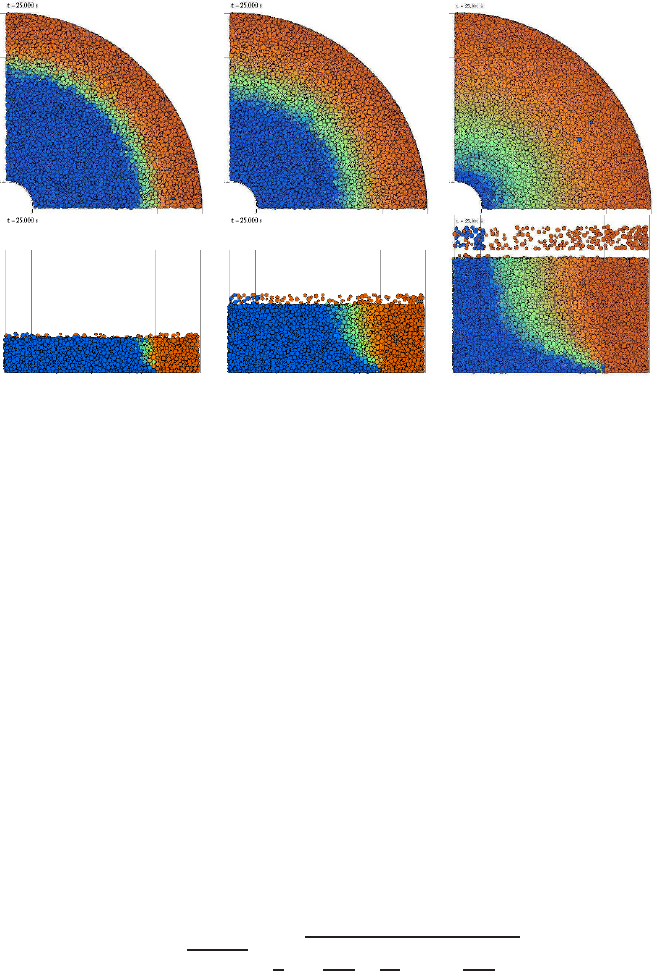
Fig. 7 Snapshots of the simulation at different
ε
zz
for constant side pressure p. The color code
corresponds to the potential energy of each particle, decaying from red over green to blue and
black. The latter black particles are so-called rattlers that do not contribute to the static contact
network.
for small deformation and large side pressure. This initial regime follows strong
dilation, for all pressures, until a quasi-steady-state is reached, where the density is
almost constant besides a weak tendency towards further dilation.
0.82
0.83
0.84
0.85
0.86
0.87
0 0.05 0.1 0.15 0.2
ν
ε
zz
p=500
p=400
p=200
p=100
p=20
-0.01
0
0.01
0.02
0.03
0 0.05 0.1 0.15 0.2
ε
V
ε
zz
p=20
p=40
p=100
p=200
p=400
p=500
Fig. 8 (Left) Volume fraction
ν
=
∑
i
π
a
2
i
/V for different confining pressure p. (Right) Volumetric
strain – negative values mean compression, whereas positive values correspond to dilation.
479

Stefan Luding
An initially dilute granular medium (weak confining pressure) thus shows dila-
tion from the beginning, whereas a denser granular material (strong confining pres-
sure) can be compressed even further by the relatively strong external forces until
dilation starts. The range of density changes is about 0.02 in volume fraction and
spans up to 3 % changes in volumetric strain.
From the initial slope, one can obtain the Poisson ratio of the bulk material, and
from the slope in the dilatant regime, one obtains the so-called dilatancy angle, a
measure of the magnitude of dilatancy required before shear is possible [46, 33].
The anisotropy of the granular packing is quantified by the deviatoric fabric (data
not shown). The anisotropy is initially of the order of a few percent at most – thus the
initial configurations are already not perfectly isotropic - even though isotropically
prepared. With increasing deviatoric deformation, the anisotropy grows, reaches a
maximum and then saturates on a lower level in the critical state flow regime. The
scaled fabric grows faster for smaller side pressure and is also relatively larger for
smaller p. The non-scaled fabric deviator, astonishingly, grows to values around
f
max
D
trF ≈ 0.56 ±0.03, independently of the side pressures used here (data not
shown, see [33, 34] for details). Using the definition f
D
:= devF /trF , the func-
tional behavior,
∂
f
D
∂ε
D
=
β
f
( f
max
D
− f
D
) , (37)
was evidenced from simulations in Ref. [33], with f
max
D
trF ≈ const., and the devi-
atoric rate of approach
β
f
=
β
f
(p), decreasing with increasing side pressure. The
differential equation is solved by an exponential function that describes the approach
of the anisotropy f
D
to its maximal value, 1 −( f
D
/ f
max
D
) = exp
−
β
f
ε
D
, but not
beyond.
6.2.5 Stress tensor
The sums of the normal and the tangential stress-contributions are displayed in Fig.
9 for two side-pressures p = 20 and p = 200. The lines show the stress measured on
the walls, and the symbols correspond to the stress measured via the micro-macro
average in Eq. (31), proving the reasonable quality of the micro-macro transition as
compared to the wall stress “measurement”.
There is also other macroscopic information hidden in the stress-strain curves
in Fig. 9. From the initial, rapid increase in stress, one can determine moduli of
the bulk-material, i.e, the stiffness under confinement p. Later, the stress reaches a
peak at approximately 2.6p and then saturates at about 2p. From both peak- and
saturation stress, one obtains the yield stresses at peak and in critical state flow,
respectively [61].
Note that for the parameters used here, both the dynamic stress and the tangential
contributions to the stress tensor are more than one order of magnitude smaller than
the normal contributions. As a cautionary note, we remark also that the artificial
stress induced by the background viscous force is negligible here (about 2%), when
γ
b
= 10
−3
kg s
−1
and a compression frequency f = 0.1 s
−1
are used. For faster
480

From Particles to Continuum Theory
0
20
40
60
80
0 0.05 0.1 0.15 0.2
σ
n
+σ
t
ε
zz
p=20
p
z
p
x
σ
zz
σ
xx
0
200
400
600
800
0 0.05 0.1 0.15 0.2
σ
n
+σ
t
ε
zz
p=200
p
z
p
x
σ
zz
σ
xx
Fig. 9 Total stress tensor
σ
=
σ
n
+
σ
t
for small (Left) and high (Right) pressure – the agreement
between the wall pressure and the averaged stress is almost perfect.
compression with f = 0.5 s
−1
, one obtains about 10% contribution to stress from
the artificial background force.
The behavior of the stress is displayed in Fig. 10, where the isotropic stress
1
2
tr
σ
is plotted in units of p, and the deviatoric fraction is plotted in units of the isotropic
stress. Note that the tangential forces do not contribute to the isotropic stress here
since the corresponding entries in the averaging procedure compensate. From Fig.
10, we evidence that both normal contributions, the non-dimensional trace and the
non-dimensional deviator behave similarly, independent of the side pressure: Start-
ing from an initial value, a maximum is approached, where the maximum is only
weakly dependent on p.
0
0.5
1
1.5
2
0 0.02 0.04 0.06 0.08 0.1
tr σ
n
/ 2p
ε
zz
p=20
p=40
p=100
p=200
p=400
p=500
0
0.1
0.2
0.3
0.4
0 0.05 0.1 0.15 0.2
dev σ
n
/ tr σ
n
ε
D
p=20
p=40
p=100
p=200
p=400
p=500
Fig. 10 Non-dimensional stress tensor contributions for different p. The isotropic (Left) and the
deviatoric fractions (Right) are displayed as functions of the vertical and deviatoric strain, respec-
tively.
481

Stefan Luding
The increase of stress is faster for lower p. After the maximum is reached, the
stresses decay and approach a smaller value in the critical state flow regime. Us-
ing the definitions s
V
:= tr
σ
/(2p) −1 and s
D
:= dev
σ
/tr
σ
, the maximal (non-
dimensional) isotropic and deviatoric stresses are s
max
V
≈ 0.8 ± 0.1 and s
max
D
≈
0.4 ±0.02, respectively, with a rather large error margin. The corresponding val-
ues at critical state flow are s
c
V
≈ 0.4 ±0.1 and s
c
D
≈ 0.29 ±0.04.
The evolution of the deviatoric stress fraction, s
D
, as function of
ε
D
, is displayed
in Fig. 10. Like the fabric, also the deviatoric stress exponentially approaches its
maximum. This is described by the differential equation
∂
s
D
∂ε
D
=
β
s
(s
max
D
−s
D
) , (38)
where
β
s
=
β
s
(p) is decaying with increasing p (roughly as
β
s
≈ p
−1/2
). For more
details on the deviatoric stress and also on the tangential contribution to the stress,
see [33, 34, 36, 35].
7 Larger computational examples
In this section, several examples of rather large particle numbers simulated with
DEM and ED are presented. The ED algorithm is first used to simulate a freely
cooling dissipative gas in two and three dimensions [45, 56]. Then, a peculiar three
dimensional ring-shear experiment is modeled with soft sphere DEM.
7.1 Free cooling and cluster growth (ED)
In the following, a two-dimensional system of length L = l/d = 560 with N = 99856
dissipative particles of diameter d = 2a is examined [51, 45], with volume fraction
ν
= 0.25 and restitution coefficient r = 0.9. This 2D system is compared to a three-
dimensional system of length L = l/d = 129 with N = 512000 dissipative spheres
of diameter d and volume fraction
ν
= 0.25 with r = 0.3 [56].
7.1.1 Initial configuration
Initially the particles are arranged on a square lattice with random velocities drawn
from an interval with constant probability for each coordinate. The mean total ve-
locity, i.e. the random momentum due to the fluctuations, is eliminated in order
to have a system with its center of mass at rest. The system is allowed to evolve
for some time, until the arbitrary initial condition is forgotten, i.e. the density is
homogeneous, and the velocity distribution is a Gaussian in each coordinate. Then
482
From Particles to Continuum Theory
dissipation is switched on and the evolution of the system is reported for the selected
r. In order to avoid the inelastic collapse, the TC model is used, which reduces dis-
sipation if the time between collisions drops below a value of t
c
= 10
−5
s.
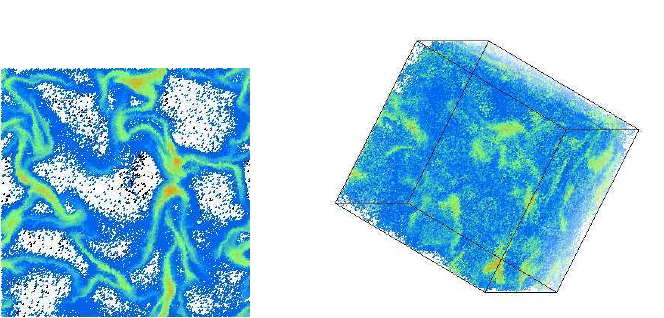
Fig. 11 (Left) Collision frequency of individual particles from a 2D simulation, after about 5200
collisions per particle. (Right) Cluster visualization from a 3D simulation. The colors in both panels
indicate large (red), medium (green), and small (blue) collision rates.
7.1.2 System evolution
For the values of r used here, the system becomes inhomogeneous quite rapidly
[45, 56]. Clusters, and thus also dilute regions, build up and have the tendency to
grow. Since the system is finite, their extension will reach system size at a finite
time. Thus we distinguish between three regimes of system evolution: (i) the initially
(almost) homogeneous state, (ii) the cluster growth regime, and (iii) the system size
dependent final stage where the clusters have reached system size. We note that a
cluster does not behave like a solid body, but has internal motion and can eventually
break into pieces after some time. These pieces (small clusters) collide and can
merge to larger ones.
In Fig. 11, snapshots are presented and the collision rate is color-coded. The
collision rate and the pressure are higher inside the clusters than at their surface.
Note that most of the computational effort is spent in predicting collisions and to
compute the velocities after the collisions. Therefore, the regions with the largest
collision frequencies require the major part of the computational resources. Due to
the TC model, this effort stays limited and the simulations can easily continue for
many thousand collisions per particle.
483
Stefan Luding
7.1.3 Discussion
Note that an event driven simulation can be 10-100 times faster than a soft-particle
DEM code applied to model the same particle number. However, ED is rather lim-
ited to special, simple interactions between the particles.
7.2 3D (ring) shear cell simulation
The simulation in this section models a ring-shear cell experiment, as recently pro-
posed [15, 16]. The interesting observation in the experiment is a universal shear
zone, initiated at the bottom of the cell and becoming wider and moving inwards
while propagating upwards in the system.
In the following, the shear-band will be examined, and the micro-macro transition
from particle quantities, like forces, to continuum quantities, like stresses, will be
performed, leading to a yield stress (or flow function) based on a single simulation.
This is in contrast to the two-dimensional example from the previous chapter, where
the yield stress had to be determined from different simulations with different side
stress p. In the ring shear cell, space- and time-averaging is possible, so that - at
different radial and vertical positions, one obtains data for different density, stress,
velocity gradient, etc.
7.2.1 Model system
The numerical model chosen here is DEM with smooth particles in three dimen-
sions. In order to save computing time, only a quarter of the ring-shaped geometry
is simulated. The walls are cylindrical, and are rough on the particle scale due to
some attached particles. The outer cylinder wall with radius R
o
, and part of the bot-
tom r > R
s
are rotating around the symmetry axis, while the inner wall with radius
R
i
, and the attached bottom-disk r < R
s
remain at rest. In order to resemble the ex-
periment, the geometry data are R
i
= 0.0147 m, R
s
= 0.085 m, and R
o
= 0.110m.
Note that the small R
i
value is artificial, but it does not affect the results for small
and intermediate filling heights.
The slit in the bottom wall at r = R
s
triggers a shear band. In order to examine the
behavior of the shear band as function of the filling height H, this system is filled
with 6000 to 64000 spherical particles with mean radius 1.0 mm and radii range
0.5 mm < a < 1.5 mm, which interact here via repulsive and dissipative forces only.
The particles are forced towards the bottom by the gravity force f
g
= mg here and
are kept inside the system by the cylindrical walls. In order to provide some wall
roughness, a fraction of the particles (about 3%) that are originally in contact with
the walls are glued to the walls and move with them.
484
From Particles to Continuum Theory
7.2.2 Material and system parameters
The material parameters for the particle-particle and particle-wall interactions are
k = 10
2
N/m and
γ
0
= 2.10
−3
kg/s. Assuming a collision of the largest and the small-
est particle used, the reduced mass m
12
= 2.9410
−6
kg, leads to a typical contact
duration t
c
= 5.410
−4
s and a restitution coefficient of r = 0.83. The integration
time step is t
DEM
= 5.10
−6
s, i.e. two orders of magnitude smaller than the contact
duration.
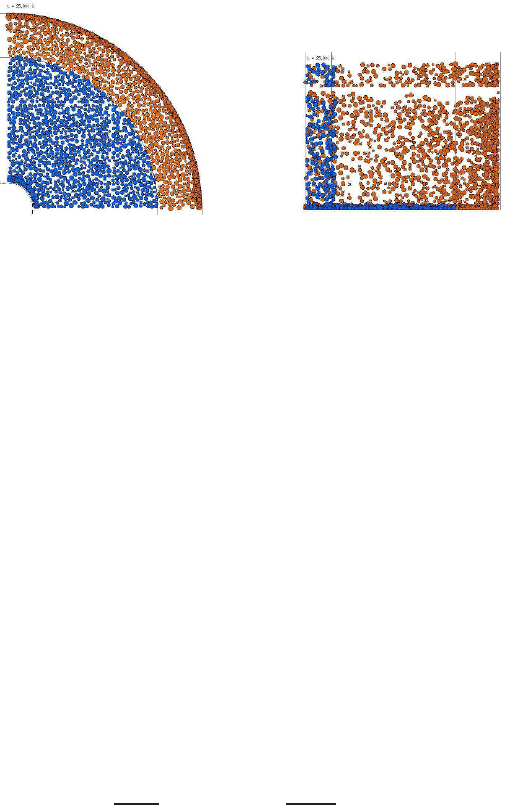
Fig. 12 Snapshots from the quarter-cylinder geometry. Visible are here only those particles glued
to the wall; the cylinder and slit positions are indicated by the lines. (Left) Top-view and (Right)
front-view. The colors blue and red correspond to static and moving wall particles.
The simulations run for 25 s with a rotation rate f
o
= 0.01 s
−1
of the outer cylin-
der, with angular velocity
Ω
o
= 2
π
f
o
. For the average of the displacement, only
times t > 10 s are taken into account. Within the averaging accuracy, the system has
seemingly reached a quasi-steady state after about 8 s. The empty cell is shown in
Fig. 12, while three realizations with different filling height are displayed in Fig. 13,
both as top- and front-view.
7.2.3 Shear deformation results
From the top-view, it is evident that the shear band moves inwards with increasing
filling height, and it also becomes wider. From the front-view, the same information
can be evidenced and, in addition, the shape of the shear band inside the bulk is
visible: The inwards displacement happens deep in the bulk and the position of the
shear band is not changing a lot closer to the surface.
In order to allow for a more quantitative analysis of the shear band, both on
the top and as function of depth, we perform fits with the universal shape function
proposed in [15]:
v
ϕ
(r)
r
Ω
o
= A
1 + erf
r −R
c
W
, (39)
485
Stefan Luding
N = 16467 N = 34518 N = 60977
Fig. 13 Snapshots from simulations with different filling heights seen from the top and from the
front, and the particle number N is given in the inset. The colors blue, green, orange and red denote
particles with rd
φ
≤ 0.5 mm, rd
φ
≤ 2 mm, rd
φ
≤ 4 mm, and rd
φ
> 4 mm, i.e. the displacement
in tangential direction per second, respectively. The filling heights in these simulations are H =
0.018 m, 0.037 m, and 0.061 m (from left to right).
where A is a dimensionless amplitude A = 0.50±0.02, R
c
is the center of the shear-
band, and W its width.
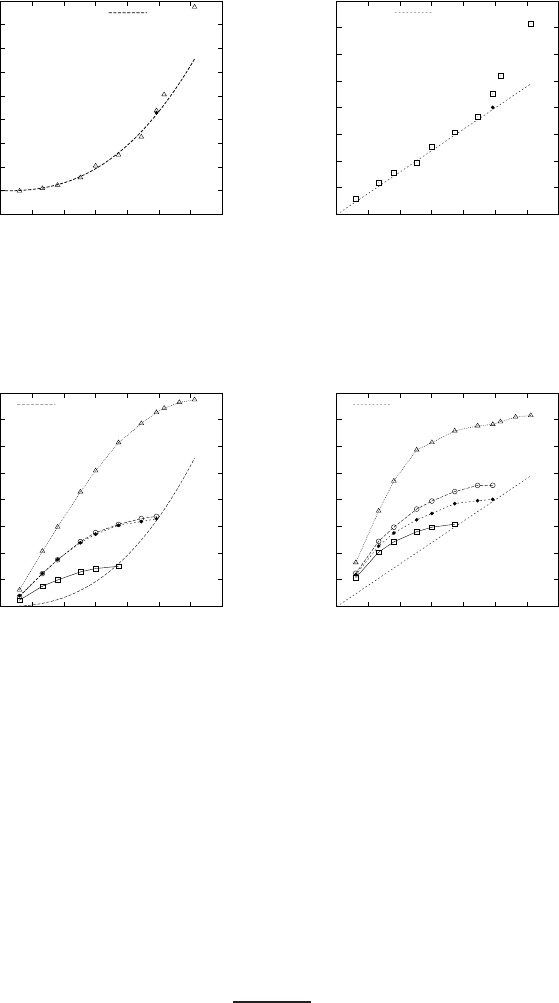
The fits to the simulations confirm qualitatively the experimental findings in so
far that the center of the shear band, as observed on top of the material, see Fig.
14, moves inwards with a R
c
∝ H
5/2
behavior, and that the width of the shear band
increases almost linearly with H. For filling heights larger than H ≈ 0.05 m, de-
viations from this behavior are observed, because the inner cylinder is reached and
thus sensed by the shearband. Slower shearing does not affect the center, but reduces
slightly the width - as checked by one simulation.
Like in the experiments, the behavior of the shearband within the bulk, see Fig.
15, deviates qualitatively from the behavior seen from the top. Instead of a slow
motion of the shear band center inwards, the shear band rapidly moves inwards at
small heights h, and reaches a saturation distance with small change closer to the
surface. Again, a slower rotation does not affect the center but reduces the width.
From the velocity field in the bulk it is straightforward to compute the velocity
gradient tensor and, from this extracting the (symmetric) strain rate:
˙
γ
=
q
d
2
1
+ d
2
2
=
1
2
s
∂
v
φ
∂
r
−
v
φ
r
2
+
∂
v
φ
∂
z
2
, (40)
i.e., the shear intensity in the shear plane [40]. Note that the solid-body rotation
term v
φ
/r comes from the cylindrical coordinate system used. The shear planes are
486
From Particles to Continuum Theory
-0.005
0
0.005
0.01
0.015
0.02
0.025
0.03
0.035
0.04
0 0.01 0.02 0.03 0.04 0.05 0.06 0.07
R
s
-R
c
(m)
H (m)
c
R
H
5/2
0
0.005
0.01
0.015
0.02
0.025
0.03
0.035
0.04
0 0.01 0.02 0.03 0.04 0.05 0.06 0.07
W (m)
H (m)
c
W
H
Fig. 14 (Left) Distance of the top-layer shearband center from the slit, both plotted against the
filling height H. The open symbols are simulation results, the solid symbol is a simulation with
slower rotation f
o
= 0.005 s
−1
, and the line is a fit with constant c
R
= 30. (Right) Width of the
shearband from the same simulations; the line is a fit with c
W
= 2/5.
0
0.005
0.01
0.015
0.02
0.025
0.03
0.035
0.04
0 0.01 0.02 0.03 0.04 0.05 0.06 0.07
R
s
-R
c
(m)
h (m)
c
R
H
0
5/2
0
0.005
0.01
0.015
0.02
0.025
0.03
0.035
0.04
0 0.01 0.02 0.03 0.04 0.05 0.06 0.07
W (m)
h (m)
c
W
H
0
Fig. 15 (Left) Distance of the bulk shearband center from the slit and, (Right) width of the shear-
band, both plotted against the height h. The open symbols are simulation results obtained with
f
o
= 0.01 s
−1
, the solid symbols are obtained with slower rotation f
o
= 0.005 s
−1
. Squares, circles
and triangles correspond to the filling heights H = 0.037 m, 0.049 m, and 0.061 m, respectively.
The curves are identical to those plotted in Fig. 14.
in fact described by a normal unit vector
ˆ
γ
= (cos
θ
,0,sin
θ
), with
θ
=
θ
(r,z) =
arccos(d
1
/
˙
γ
), as predicted [12]. The center of the shear band indicates the direction
of the unit-vector
ˆ
γ
. In the system with friction, we observe that the average particles
spin is also normal to the shear-plane, i.e., parallel to
ˆ
γ
, within the rather strong
fluctuations (data not shown).
From the stress, as computed according to Eq. (31), the shear stress is extracted
(in analogy to the strain rate) as proposed in [12]:
|
τ
| =
q
σ
2
r
φ
+
σ
2
z
φ
. (41)
487