Li S.Z., Jain A.K. (eds.) Encyclopedia of Biometrics
Подождите немного. Документ загружается.


are also a number of minor differences. These are
summarized in Table 1.
Iris Standards Adoption
A number of national and international governments
and organizations have officially adopted iris image
data standards for current and planned programs.
Within the US Department of Homeland Security the
Transportation Security Agency (TSA) has adopted
ISO/IEC 19794-6, in addition to ANSI INCITS stan-
dards for Finger Minutiae, Face Recognition, and the
Common Biometric Exchange Formats Framework
(CBEFF) for its Registered Traveler program. In this
program the iris rectilinear format is used for trans-
mission of enrollment images to a central data center,
and polar format is used for storage of iris image data
on the registered tr aveler card. The International Civil
Aviation Organization (ICAO) has adopted ISO/IEC
standards for face, finger, and iris biometrics, in addi-
tion to the ISO/IEC CBEFF standard, for its Machine
Readable Travel Documents (MRTDs).
Current Iris Standards Activity
Current standards activities related to the iris image
standards include development of conformance
test standards, development of rev isions of the current
standards, and adoption of the international ISO/IEC
standard by various national standards organizations.
Conformance testing is intended to assess commer-
cial products that claim to support the iris standard.
Developers of software applications and biometric
products may interpret the standard differently from
one another, and as a result their implementations of
the specification may differ and not interoperate. Con-
formance to the standard is a necessary prerequisite for
achieving interoperability among implementations;
therefore, there is a need for a standardized, gener-
ally accepted, conformance testing methodology that
would allow implementation of a set of test tools
realizing this methodology. The conformance test stan-
dards are applicable to the development and use of
conformity test method specifications, conformity
test suites for Iris Image Data Record requirements as
specified the ANSI and ISO standards, and confor-
mance testing programs for conforming products.
They are intended primarily for use by testing organi-
zations, but may be applied by developers and users
of test method specifications and test method
implementations.
The international biometric standards committee
ISO/IEC JTC1 SC37 is currently developing a revised
version of ISO/IEC 19794-6 to address needed clarifi-
cation of the original standard, incorporate certain
technolog y innovations, and respond to new customer
requirements. In particular, SC37 is considering both
removal of the requirement for mandatory embedding
of the iris image record within a CBEFF data structure
and elimination of the polar image format.
International standards such as ISO/IEC 19794-6
may be adopted by national standards bodies for use as
national standards. The U.S. has adopted the interna-
tional iris standard as a US standard, and has with-
drawn ANSI INCITS 379, cancelling the revision
project for this standard and the conformance testing
methodolog y standard project.
Summary
The published ANSI INCITS and ISO/IEC standards for
iris image data interchange were developed in a cooper-
ative, collaborative process with participants from nu-
merous commercial entities, government agencies, and
Iris Image Data Interchange Formats, Standardization. Table 1 Comparison of ANSI and ISO versions of iris image
interchange standards
Attribute ANSI INCITS 379 ISO/IEC 19794-6
Image quality field
description
Described as 4 categories with numerical range
1–100
Described as value with numerical range
1–100
Second level header title Feature Header Biometric Subtype Header
CBEFF Product Identifier Contained in Iris Record Header Contained in CBEFF Header
User Identification No. Contained in Iris Record Header Contained in CBEFF Header
800
I
Iris Image Data Interchange Formats, Standardization

academic institutions from the US and other countries.
The standards have been successfully adopted by a num-
ber of US and international organizations that desire to
use iris recognition in operational deployments. The
standards are sufficiently flexible to accommodate the
products of diverse commercial vendors and user orga-
nizations. Ongoing standards development work will
result in more flexible and interoperable standards and
conformance test suites that may be used to effectively
test the compatibility of various products with the
standards.
Related Entries
▶ Biometric Sample Quality, Standardization
▶ Biometric Technical Interface, Standardization
▶ Common Biometric Exchange Framework Formats,
Standardization
▶ Conformance Testing Methodologies for Biometric
Data Interchange Formats, Standardization of
▶ Data Interchange Format, Standardization
▶ Iris Image Quality
▶ Iris Recognition, Overview
References
1. Flom, L., Safir, A.: Iris recognition system, US Patent
No. 4,641,349, United States Patent and Trademark Office,
Washington DC, (1984)
2. Kim, D., Ryoo, J.: Iris identification system and method
of identifying a person through iris recognition, US Patent No.
6,247,813, United States Patent and Trademark Office, (2001)
3. Monro, D., Rakshit, S., Zhang.: DCT-Based Iris Recognition.
IEEE Trans. Pattern Anal. Mach. Intell. 29(4), 586–595 (2007)
4. Wildes, R., Asmuth, J., Hanna, K., Hsu, S., Kolczynski, R.,
Matey, J., McBride, S.: Automated, non-invasive iris recognition
system and method, US Patent No. 5,572,596, United States
Patent and Trademark Office, (1996)
5. Daugman, J.: High confidence visual recognition of persons by a
test of statistical independence. IEEE Trans. Pattern Anal. Mach.
Intell. 15(11), 1148–1160, (1993)
6. Ma, L., Wang, Y., Tan, T., Zhang, D.: Personal identification
based on iris texture analysis. IEEE Trans. Pattern Anal. Mach.
Intell. 25(12), 1519–1533, (2003)
7. Masek, L.: Recognition of human iris patterns for biometric
identification, Bachelor of Engineering thesis, School of Com-
puter Science and Software Engineering, The University of West-
ern Australia, (2003)
8. Tisse, C., Martin, L., Torres, L., Robert, M.: Person identification
technique using iris recognition, In: Proceedings of the 15th
International Conference on Vision Interface, Calgary, Italy,
pp. 294–299 (May 29, 2006)
9. ANSI INCITS 379-2004 Iris image interchange format. Ameri-
can National Standards Institute, (2004)
10. ISO/IEC 19794-6: 2005 Information technology – Biometric
data interchange formats – Part 6: Iris image data, International
Standards Organization, (2005)
11. ISO/IEC 19785-1:2006 Information technology – Common bio-
metric exchange formats framework – Part 1: Data element
specification, International Standards Organization, (2006)
Iris Image Enhancement by
Super-Resolution Method
▶ Iris Super-Resolution
Iris Image Quality
NATALIA A. S CHMID
West Virginia University, Morgantown, USA
Synonyms
Information content of iris images; Iris quality metrics
Definition
Iris image quality evaluation is a procedure of measur-
ing information content of iris imagery at the stage of
iris acquisition or at early processing stage. The infor-
mation content may be decided to be insufficient to be
used for iris identification based on a sing le image. In
this case, the image may be discarded, or combined
with other imagery to improve recognition capabilities
of an iris system. Evaluated quality metrics would be
the guidelines in making decisions regarding further
steps with respect to acquired imagery.
Introduction
Iris image quality assessment is an important research
thrust recently identified in the field of iris biometrics
[1–3]. This research is tightly related to the research on
Iris Image Quality
I
801
I

▶ nonideal iris. Its major role is to determine, at the
stage of data acquisition or at the early stage of proces-
sing, what the amount of information for the purposes
of processing, recognition, and fusion this imagery
contains. Is it informative enoug h for performing fur-
ther processing steps or should be discarded? Is it
informative enough for being combined with other
images and result in improved recognition perfor-
mance? The quality metrics play an important role in
automated biometric systems for three reasons: (1)
system performance (segmentation and recognition),
(2) interoperability, and (3) data enhancement.
The quality metrics play an importan t role in auto-
mated biometric systems for two reasons: (1) system
performance (segmentation and recognition), and (2)
interoperability.
A traditional approach in evaluating iris imag e
quality is to identify a single or a sequence of physical
phenomena that influences formation of query iris
imagery at the image acquisition stage (see the entry
on Image Acquisition). The distortions that identified
physical phenomena introduced are then modeled
mathematically. To evaluate the level of distortion pres-
ent in an iris image, a single or a set of metrics or quality
measures is specified. The metrics can be absolute
measures or relative measures. The abs olute metrics
do not assume comparison of query image with a
reference image. The relative metric measures the pres-
ence of some distortions with respect to a specified
reference image.
The following sections provide a short survey of the
literature on iris image quality, introduce a set of iris
quality measures and suggest a number of techniques
to combine individual quality measures in a single
score.
Survey of Iris Quality Metrics
Previous work on iris image quality can be placed in tw o
categories: local and global analysis. Zhu et al., [4]evalu-
ate quality by analyzing the coefficients of particular areas
of iris’s texture by employing discrete wavelet decompo-
sition.Chenetal.,[5] classify iris qu ality by measuring
the energy of concentric iris bands obtained from 2-D
wavelets. Ma et al., [6] analyze the Fourier spectra of
local iris regions to characterize out-of-focus and mo-
tion blur and occlusions. Zhang and Salganicaff [7]
examine the sharpness of the region between the pupil
and the iris. Daugman [8] and Kang and Park [9]
characterize quality by quantifying the energy of high
spatial frequencies over the entire image region.
Belcher and Du [10] propose a clarity measure by
comparing the sharpness loss within variou s iris
image regions against the blurred version of the same
regions. The major feature of these approaches is that
the evaluation of iris image quality is reduced to the
estimation of a single [5, 7, 8, 9] or a pair of factors [6],
such as out-of-focus blur, motion blur, and occlusion.
A broader range of physical phenomena that can be
observed in nonideal iris imagery was characterized
by Kalka et al., [11, 12]. The proposed factors include
out-of-focus and motion blur, occlusion, specular re-
flection, illumination, off-angle, and pixel count. The
strength of the phenomena and its influence was eval-
uated through modified or newly designed iris quality
metrics. These factors based on the extensive analysis
carried out by the authors affect the segmentation and
ultimately recognition performance of iris recognition
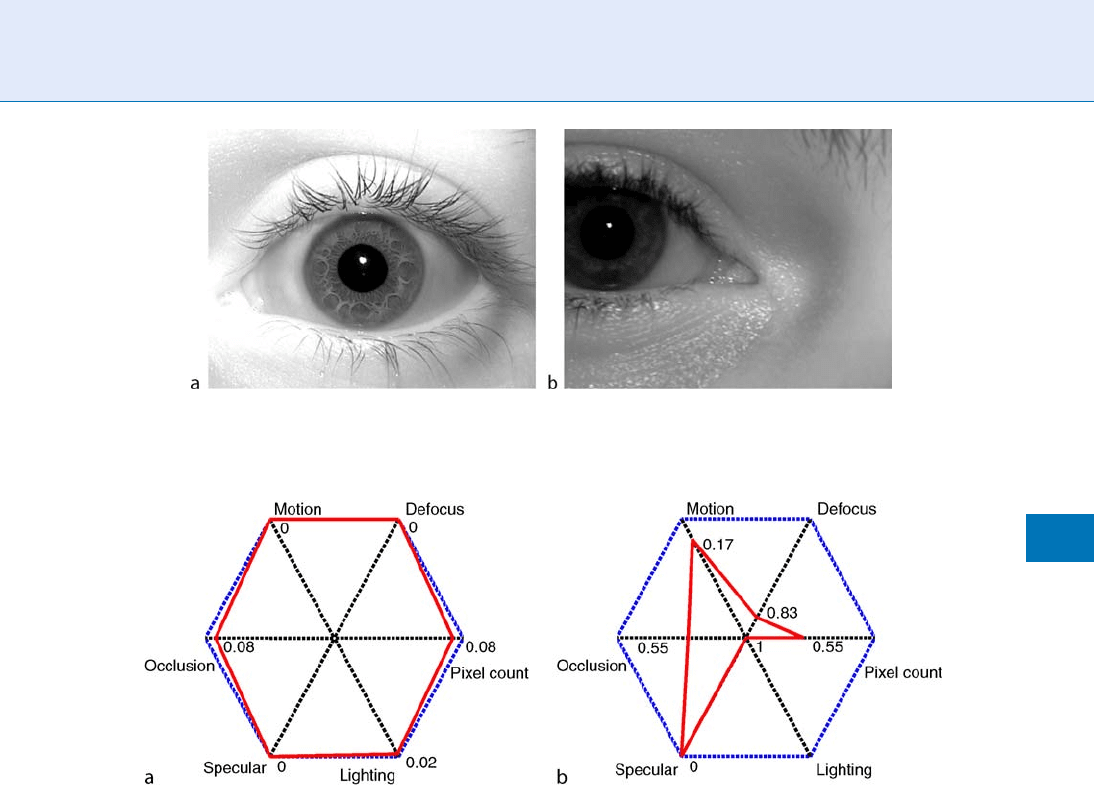
systems. An example of two iris images from ICE
dataset [13] and their corresponding pentagram plots
are displayed in Figure 1 and Figure 2. In a pentagram ,
each axis represents a quality metric. The quality score
is normalized to take values between zero and one. The
value one corresponds to the lowest quality, the value
zero is the highest quality.
Since most of quality metrics contain some com-
mon information (for example, motion and out-of-
focus blurs are physically related; occlusion and pixel
counts usually contain redundant information; illumi-
nation and contrast are also related), they have to be
estimated jointly. However, all recently designed qua-
lity assessing algorithms treat individual quality metrics
as independent and thus evaluate them separately.
While any processing reduces information content
of quality metrics, in some applications it is beneficial
to have a single quality score that characterizes the
overall image quality. In this case we would appeal to
rules of combining scores.
Rules of Combination
The quality factors (metrics) can be used individually
or combined into a single score throug h a simple
static or an adaptive rule. Among static rules the sim-
ple sum rule is a computationally efficient method .
More complex (adaptive) rules such as Bayesian,
802
I
Iris Image Quality
Dempster-Shafer, weighted Sum, or any previously
designed fusion strategy to combine classifiers can
also be used to combine quality metrics into a single
score. These rules are more fundamental and flexible,
but require intensive computations.
Relevance to Recognition
Performance
It is well understood that the capabilities of various
designed metrics to evaluate the quality of iris image s
has to be related to their capabilities to predict recog-
nition performance by quickly analyzing the quality of
imagery. Since in most analyzed cases recognition per-
formance is nonlinearly related to quality metrics, it is
hard to evaluate precision with which quality metrics
and recognition performance are related. It is because
of this reason most of the designed quality metrics are
not highly correlated with one another.
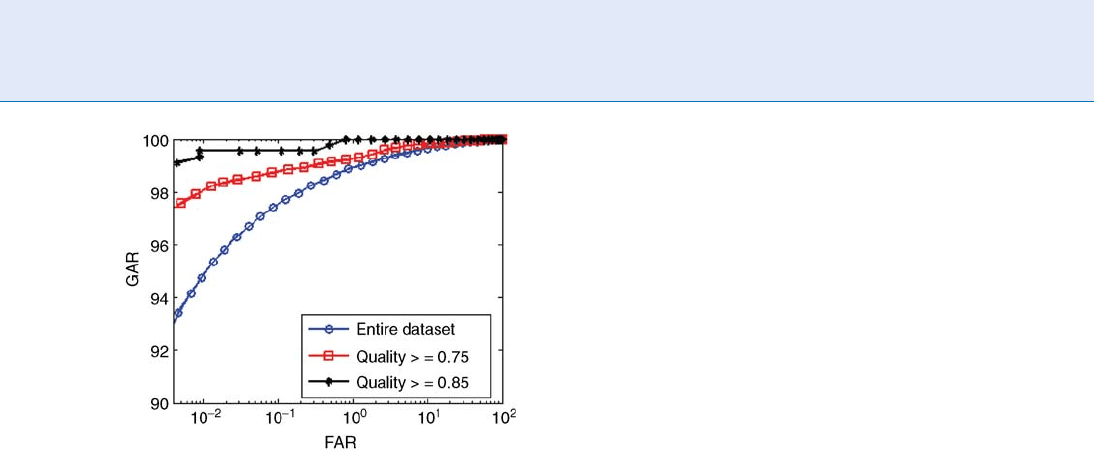
Figure 3 demonstrates the relationship between
the iris quality metrics evaluated by following the
procedure in Kalka et al., and combined through app-
lication of Dempster-Shafer rule and the recognition
performance. The results are obtained using images
from ICE dataset [13]. To obtain the plots in Figure 3,
each image undergoes quality evaluation. The images
are ranked based on their quality score. The receiver
operating curves are plotted for three cases. In the first
case, the entire dataset is used. In the second case, the
images with the quality above the score 0.75 are select-
ed. In the last case, the images with the quality above
the score 0.85 are selected. Note that here the score
value one corresponds to the highest quality. From
Figure 3, the combined metric predicts recognition
performance relatively well.
This indicates that the information extracted fro-
miris imagery is correlated to some degree with the
recognition performance. The question that remains to
be addresses if it is possible to establish an explicit
Iris Image Quality. Figure 2 Pentagram plot of quality for the images in Figure 1.
Iris Image Quality. Figure 1 Sample images from ICE dataset. (a) Good quality image. (b) Poor quality image.
Iris Image Quality
I
803
I
relationship between quality metrics and recognition
(verification) performance.
In practice most of metrics are designed to me asure
signal-to-noise ratio, ratio of powers, directional
power, sharpness of edges, ratio of pixels, empirical
entropy and relative entropy. These metrics are not
explicitly related to probability of recognition error
or receiver operating characteristic (ROC) curve, two
traditional measures of recognition and verification
performance. Furthermore, the degree of nonlinearity
and nonlinear model relating the quality metrics and
recognition performance are hard to evaluate.
The conclusions above are supported by the results
of an extensive research published in the literature on
the topic of feature selection. The problem of feature
selection can be briefly summarized as follows. Due to
suboptimality of an image/signal encoding procedure
(feature extraction procedure) templates contain a cer-
tain number of noisy components or components un-
informative for pattern recognition. Removal of these
components, therefore, often leads to improved recog-
nition performance. In the past, some substantial
efforts have be en made t o find an information measure
that would be capable of evaluating the information
content of a feature and, at the same time, would be
able to predict changes in recognition performance due
to removal of a feature [14, 15]. In spite of long term
efforts, the final conclusions may not look worth of
these efforts: (1) there is a single family of statistical
models (Gaussian family) that allows establishing an
explicit (exponential) relationship between the infor-
mation content of a feature and the recognition per-
formance. Unfortunately for biometrics, only few
types of biometric templates (encoded data) can be
modeled as being Gaussian distributed. (2) The tradi-
tional measures of infor mation suc h as signal-to-
noise-ratio, entropy, relative entropy, and mutual
information, are only asymptotically related to proba-
bility of recognition error [16]. When these measures
are adapted to the problem of empirical evaluation of
the information content of a feature, the relationship
between the empirically evaluated measures and the
probability of recognition error can be established only
under the condition that an increasing amount of data
can be used to evaluate information in features and
provided that the empirical information measures
converge in some sense to the true measures.
Summary
Iris images quality metrics provide us with a fast
way to predict information content of biometric data.
Current quality metrics are designed to evaluate qua-
lity factors individually, that is, separately. These quality
factors may further be combined by invoking static
or adaptive rules applied to individual scores. Since
various quality factors contain redundant infor-
mation about one another, a more optimal solution
to the problem of evaluation of iris image quality
would be to evaluate the quality factors jointly. Also,
identifying the most important quality factors that
influence the recognition performance remains an
open problem.
Related Entries
▶ Iris Segmentation
▶ Iris Recognition
▶ Score Fusion and Normalization Rules
References
1. Biometric quality workshop. national institute of standards and
technology. (2006)
2. Biometric quality workshop ii. national institute of standards
and technology. (2007)
3. Bowyer, K., Hollingsworth, K. Flynn, P.: Image understanding
for iris biometrics: A survey. J Comp Vision and Image under-
standing. 110, 281–307 (2007)
Iris Image Quality. Figure 3 Establishing the relationship
between estimated quality metrics and verification
performance of an iris recognition system. The results are
based on applications of a Gabor-filter based encoding
algorithm to iris images from ICE dataset.
804
I
Iris Image Quality

4. Zhu, X., Liu, Y., Ming, X., Cui, Q.: A quality evaluation method
of iris images sequence based on wavelet coefficients in region of
interest. In: Proceedings of the fourth International Conference
on Computer and Information Technology, pp. 24–27 (2004)
5. Chen, Y., Dass, S., J.A.: Localized iris quality using 2-d wavelets.
In: Proceedings of International Conference on Biometrics,
pp. 373–381. Baltimore, MD (2006)
6. Ma, L., Tan, T., Zhang, Y.W.D.: Personal identification based on
iris texture analysis. IEEE Trans. Pattern Anal. Mach. Intell.
25(12), 1519–1533 (2003)
7. Zhang, G., Salganicoff, M.: Method of measuring the focus of
close-up image of eyes (1999)
8. Daugman, J.: How iris recognition works. IEEE Trans. Circ. Syst
Video Technol. 14(1), 21–30 (2004)
9. Kang, B., Park, K.R.: A study on iris image restoration. In:
Proceedings Audio Video Based Personal Authent., vol. 3546
(2005)
10. Belcher, C., Du, Y.: Information distance based selective feature
clarity measure for iris recognition. In: Proceedings SPIE
Symposium on Defense and Security. Conference on Human
Identification Technology IV., vol. 6494 (2007)
11. Kalka, N.D.: Image quality assessment for iris biometric. https://
eidr.wvu.edu/files/4447/Kalka_Nathan_thesis.pdf (2005)
12. Kalka, N., Zuo, J., Dorairaj, V., Schmid, N., Cukic, B.: Image
quality assessment for iris biometric. In: Proceedings of 2006
SPIE Conference on Biometric Technology for Human Identifi-
cation III. Orlando, FL (2006)
13. Liu, X., Bowyer, K.W., Flynn, P.J.: Iris recognition and verifica-
tion experiments with improved segmentation method. In: pro-
ceedings Fourth IEEE Workshop on Automatic Identification
Advanced Technologies (AutoID) (2005)
14. Ben-Bassat, M.: Use of distance measures, information measures
and error bounds in feature evaluation. Handbook of Statisti-
cal, P.R. Krishnaiah and L.N. Kanal, North-Holland Publishing
Company, pp. 773–791 (1982)
15. Jain, A.K., R.P.W.D., Muo, J.: Statistical pattern recognition: A
review. IEEE Trans on Pattern Analysis and Machine Intelli-
gence. 22, 4–36 (2000)
16. Cover, T.H., Thomas, J.A.: Elements of Information Theory.
Wileg Series in Telecommunications, New York (1991)
Iris Interchange Format Standards
▶ Iris Image Data Interchange Formats ,
Standardization
Iris Localization
Iris localization is one important stage in iris recogni-
tion system. The goal of iris localization is to find the
boundary between iris and sclera and between iris and
pupil. Because the shape of pupil and the shape of iris
look very close to a circle, most of the iris localization
algorithm tries to perform circle fitting on the eye
image. In this way, the results of iris localization can
be expressed as two circles.
▶ Automatic Class ification of Left/Right Iris Image
▶ Iris Super-Resolution
Iris on the Move™
JAMES R. MATEY
Electrical and Computer Engineering Department,
US Naval Academy, Annapolis, MD, USA
Synonyms
Drive-up; Iris at a glance; Minimal constraint iris
recognition; Portal; Walk-through; Walk-up
Definition
Iris on the Move™, commonly referred to as IOM, is
an approach to acquiring iris images suitable for iris
recognition while minimizing the constraints that need
to be placed on the subject. Sarnoff Corporation
developed IOM under contract to the United States
Government: NMA401-02-9-2001.
Multiple implementations of IOM have been
demonstrated; they include: a portal walk-through
system, an on-the-wall walk-up system, an over-the-
door walk-through system and a roadside drive-up
system. The key features of the IOM systems are large
▶ capture volume, large ▶ standoff distances and the
capability of capturing recognition quality iris images
while the subject is in motion [1].
The Panasonic ‘‘Iris at a Glance’’ systems and
the H-box™ from the Hoyos Group are examples of
related technologies.
Introduction
Iris recognition is one of the strongest biometric avail-
able [2–4]. Iris recognition is a strong biometric
Iris on the Move™
I
805
I
because: (1) the human iris is a complex structure with
a high degree of randomness; (2) the iris is protected;
(3) the iris is accessible; and (4) the structures of the
iris that are used for iris recognition are stable, from
early childhood – in the absence of illness or injury that
disrupts the iris t issue.
The first mention of iris patterns as a biometric w as
likely a paper by Bertillon [5]; several others subse-
quently suggested iris patterns as a biometric and the
idea was a plot element in the 1983 James Bond film
Never Say Never Again [6]. However, it was not until
the early 1990s that John Daugman developed a prac-
tical algorithm for iris recognition based on Gabor
wavelets [7]. Minor variants on the Daugman algo-
rithm remain the dominant algorithms in commercial
iris recognition systems as of 2007, though there are
vigorous research efforts into alternative algorithms
[8]. The commonly used name for the Daugman algo-
rithms in current use is iris2pi.
The capability of providing extremely low
▶ false
match rates is one of the great strengths of iris2pi.
Daugman has published credible evidence that iris2pi
can support false match rates of the order of a part in a
trillion [9]. However, the quality of the iris images
required for such results is high. The standards for
iris images published by the ISO [10] call for 100–
200 pixels across the iris and 40 dB signal-to-noise -
ratio (SNR). In the decade following the development
of the Daug man algorithm, Iridian, IrisGuard, LG,
OKI, Panasonic, and Securimetrics all brought iris
recognition cameras to market that could provide
such high quality iris images. Figure 1 is an example
of one of these cameras that provides the full 200 pixels
across the iris.
All these systems require substantial cooperation
from the subjects and impose significant constraints
on them. In general, imposing constraints and requir-
ing cooperation reduces the ease of use of any biomet-
ric system. This may not be a significant issue for
▶ habituated subjects, but it is a concern for nonhabi-
tuated subjects – subjects who do not use the system
on a routine basis.
Iris on the Move™ was developed to relax subject
constraints and make it possible for subjects to use an
iris recognition system with little instruction. The con-
straints of greatest interest are capture volume, stand-
off,
▶ residence time, subject motion, effects of
ambient illumination, and overall ease of use. Capture
volume is the three dimensional volume through out
which the iris camera is capable of acquiring an
acceptable image. Standoff is the distance from the
camera to the subject; in some systems there may be
two standoff distances – subject to camera and subject
to illumination. Residence time is the length of time
that a subject must stay with in the capture volume to
enable collection of an acceptable image. Subject mo-
tion within the capture volume can be characterized in
terms of a velocity – the maximum velocity at which a
subject can move during collection of an acceptable
image. Overall ease of use can be characterized in terms
of the complexity of the instructions that must be
provided to an uninitiated subject to insure acceptable
iris image collection on their first use of a system.
The reader may well ask, ‘‘What is an acceptable iris
image?’’. Operationally an acceptable image is a recog-
nition image that matches well against an enrollment
image taken under ideal circumstances – the enrollment
image meets ISO standards, highly constrained subject,
no time limit, repeated trials available to obtain opti-
mum quality image, and close supervision of the enroll-
ment process by a well trained operator. It is important
to note that iris2pi looks at the local phase of the
iris image in predefined spatial frequency bands (see
the entry on Gabor wavelet iris encoding). Hence, the
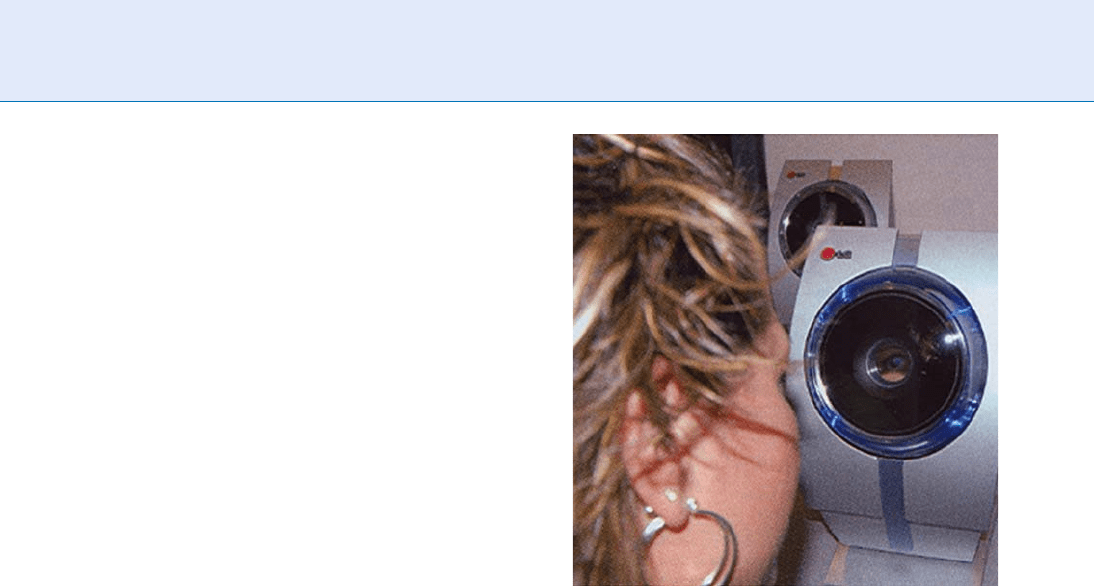
Iris on the Move™. Figure 1 An enrollment quality iris
image capture device, the LG IrisAccess 3000. (Photo
provided courtesy of Mohammed Murad of LG Electronics
USA Inc., Iris Technology Division.)
806
I
Iris on the Move™

image quality metrics that are used for assessing the
visual quality of images in daily life do not map directly
to the quality metrics for an image used for iris recogni-
tionwith iris2pi. For example, a reduction in the contrast
of a properly adjusted television display will almost
always reduce its visual quality – while a reduction in
the contrast of a good quality iris image may have little
impact on its match score against another good image of
the same iris. This can be understood in mathematical
terms: phase and amplitude are orthogonal/independent
coordinates. Human vision is more sensitive to ampli-
tude than phase; iris2pi is more sensitive to phase than
amplitude.
IOM Design Considerations
The single most important IOM design consideration
is the exploitation of asymmetries between enrollment
and recognition. As Daugman points out [9], the
number of degrees of freedom (as measured by the
number of valid bits in an iris2pi template) in an iris
template can vary depending on the quality of under-
lying image. Fewer degrees of freedom translate to a
broader
▶ imposter distribution. This broadening is
taken into account in many systems by adjusting the
Hamming distance of a match based on the number
valid bits compared between two templates to maintain
a constant false match rate for a fixed match criterion in
the presence of such variation. At enrollment, significant
effort can be expended, once per subject, to capture a
pristine image of the iris. Pristine enrollment images
enable us to purge the database of duplicates – even
when the database is large. They also ensure that maxi-
mal use is made of the degrees of freedom available in a
lower quality recognition image.
If there is high quality enrollment, at recognition,
it can afford a reduction in the quality of the image.
The
▶ authentic s distribution will be dominated by
the quality of the recognition images. Reduction
in the quality of the recognition images will broaden
the authentics distribution and increase the
▶ false
non-match rate (FNMR). However, it is possible to
adjust for the increase in the single attempt FNMR
through use of multiple attempts.
IOM systems use high quality images from iris
cameras equivalent to that in Fig. 1 to build a strong
iris database. At each recognition attempt IOM sys-
tems take multiple, lower quality images of the subject
iris and compare them a gainst the database. Let FMR
(1) be the false match rate for a recognition attempt
where only one image is collected, and FNMR(1)
corresponding false non-match rate. Ignoring correla-
tions and some other statistical niceties, the first
order effect of testing N images at each recognition
attempt is to change the performance of the system to
FMR(N) N*FMR(1) and FNMR(N) FNMR(1)
N
.
The important point is that FMR(N) increases slowly
(linearly) with N, whereas the FNMR(N) decreases
much more rapidly (exponentially).
Current implementations of iris2pi can generally
provide a better FMR than is necessary in most recog-
nition applications. Hence, a slightly higher FMR(N)
can be a trade-off for a much lower FNMR(N). This
enables us to use lower quality recognition images.
Lower quality on the recognition image can then
be converted into larger standoffs and larger capture
volumes for a fixed system cost. IOM systems can be
designed to operate at the bottom end of the image
quality standards set by the ISO. In particular
the systems can be designed for 100 pixels across
the iris and somewhat less than 40 dB SNR.
The essay now considers each of the system para-
meters in turn and discusses the relevant tradeoffs.
Capture Volume
Capture volume is the product of two factors: field of
view (an area) and
▶ depth of field (a distance). The
field of view is product of the width and heig ht of
the region in focus for the imager. Field of view is
determined by the pixel count of the camera sensor.
A 2048 2048 pixel camera will give a field of view of
20.48 20.48 cm at a subject iris resolution of 100
pixels/cm. IOM systems achieve a large field of view by
accepting an iris resolution of only 100 pixels/cm and
by using cameras with high pixel counts.
Depth of field is the distance along the axis con-
necting the subject and the camera over which the iris
is in focus – without additional adjustment of the lens.
Depth of field is a characteristic of the lens system and
is discussed in detail elsewhere [11]. Depth of field
increases with increasing F# of the lens, which in turn
reduces the amount of light that gets through the lens
and the SNR of the image. IOM systems achieve effec-
tive depth of fields of the order of 10 cm at standoffs of
2–3 m by providing sufficiently bright illumination
to enable use of higher F#’s while still maintaining a
good signal-to-noise-ratio.
Iris on the Move™
I
807
I

Standoff
Once the pixel size of the imager and subject resolution
are chosen, the magnification of the lens system is
determined by the rules of geometrical optics. The
magnification combined with the camera standoff
determines the focal length of the lens through the
lens equation 1/f = 1/p + 1/q where f is the focal length,
p is the subject distance, and q is the image distance.
The magnification links p and q: M = q/p.
IOM systems achieve camera standoffs of 2 m or
more by using long focal length lenses (200 mm)
with F#’s determined by
▶ diffractio n limits and
depth of field considerations.
Iris recognition systems almost always use some
form of active near IR illumination. Bot h, the illumi-
nation a nd the camera have standoffs. IOM systems
achieve illumination standoffs of 1–2 m by using arrays
of powerful near IR LEDs to deliver irradiance of the
order of 2 mW/cm
2
to the subject. The irradiance at
the subject is limited by safety considerations. The
▶ threshold limit valu es (TLV) for near IR irradiati on
are published by the ACGIH [12]. The TLVs limit both
the subject irradiance (W/cm
2
) and the source radi-
ance (W/cm
2
-sr), which is a characteristic of the LEDs
used in the illuminator.
Residence Time
The product of residence time and the image capture
rate (frame rate) of the camera gives the number of
images captured during a recognition attempt. This
must exceed one – preferably more than one to get
advantage from the multiple attempt tradeoff de-
scribed above.
IOM system use relatively high frame rate cameras
(15–60 fps) to minimize residence time while still
getting enough images to reliably perform recognition.
Subject Motion
Subject motion can be divided into two types: longitu-
dinal motion, along the camera axis, and transverse
motion, perpendicular to the camera axis. Subject mo-
tion has two primary effects on image capture: (1) it
limits the residence time within the capture volume
and (2) it introduces motion blur, which effectively
degrades the image resolution.
If the capture volume is 10 cm thick – set by the
depth of field – and the subject is walking through the
volume with a longitudinal velocity of 1 m/s, he will
transit the volume in 0.1 s; his residence time is 0.1 s.
The product of his residence time and the image cap-
ture rate must be greater than 1, as noted above.
A rough measure of motion blur is the amount of
motion, in pixels, that occurs during the acquisition of
an image. To maintain the resolution of the system this
needs to be less than 1 pixel. Longitudinal velocity, v
L
has a blurring effect that is the result of magnification
change as the subject approaches the camera. The size
of the change is approximately the ratio of the distance
moved to the camera standoff. Since the iris is 100
pixels across, the magnification change must be kept
below 0.01. If the shutter time of the camera is t, and
the camera standoff is d
c
, then 0.01 > v
L
t /d
c
. For a
1 ms shutter, and 2 m standoff, the longitudinal veloc-
ity must be less than 20 m/s – about twice as fast at the
world record (10 s) in the 100 m dash. Hence, the
maximum longitudinal velocity is set by required resi-
dence time, rather than motion blur.
Transverse velocity is a much bigger issue. Motion
perpendicular to the camera subject axis simply moves
the pixels at the iris as much as the motion. For a tran-
sverse velocity v
T
, a shutter time, t, and a subject reso-
lution, d
s
(m/pixel) v
T
t < d
s
is required. For 100 pixels/
cm and a shutter time of 1 ms, v
T
< 0.1 m/s – much
smaller than the longitudinal velocity limit.
The IOM systems use shuttered cameras and
strobed illumination to freeze the subject motion.
However, 1 ms is, at present, a practical limit on the
strobes and shutters. The IOM systems use human
factors engineering to minimize the transverse motion
of the subject as they move toward the camera. The
subject is given a target to walk towards and is
instructed to walk in a straight line.
The strobe and shutter control the amount of light
that reaches the camera sensor. Shorter strobes/shut-
ters at the same peak irradiance reduce the number of
photons reaching the sensor and reduce the SNR. It is
possible to increase the light intensity during the strobe
to recover part of this, but there are limitations im-
posed by the maximum current that can be used to
drive the LEDs and maximum safe radiance and irra-
diance set by the TLVs.
808
I
Iris on the Move™

Ambient Light
Ambient light can interfere with iris recognition sys-
tems in various ways. Bright ambient lights can cause
extreme pupil constriction and can cause subjects to
squint; both of these effects can cause difficulty in
generating a good quality iris template from the
image. However, short of reducing the ambient, there
is little that can be done to ameliorate these physiolog-
ical responses. Bright ambient lights can also cause
specularities on the iris that interfere with the genera-
tion of iris templates. This factor can be ameliorated by
using narrow band illumination w ith narrow band
filtering on the camera. It can also be ameliorated
with the strobed illumination and shuttered camera
used for blur reduction.
IOM systems reduce the effect of ambient illumi-
nation by using optical filters that block a large fraction
of the ambient light while passing the active illumina-
tion and by using strobed illumination and opening
the shutter only during the strobe, thereby rejecting the
ambient light that impinges on the subject during the
time the strobe is off.
Ease of Use
The IOM systems use human factors designed to max-
imize ease of use. People find it relatively easy to walk
down the center of a portal, to walk along a line
painted on the floor, or to walk directly toward a
target from a given starting point. The fields of view
of the IOM systems have been chosen to insure that a
person carrying out such a task will, as a matter of
course, pass their eyes through the capture volume of
the system.
The IOM systems have been designed to take ad-
vantage of the motion of the subject toward the cam-
era, to avoid the need for the subjects to position
themselves at the focus of the system – they will walk
through it naturally as shown in Fig. 2. The instruc-
tions for a subject about to use an IOM portal for the
first time are:
1. Open your eyes
2. Look straight ahead at your reflection in the camera
cover
3. Walk down the center of the portal at a moderate pace
4. Try to be recognized
System Approach
In the world of software engineering, a ‘‘spaghetti
design’’ is anathema – modularity is the mantra –
with each module distinct and independent. In the
IOM systems, photons thread essentially all of the
hardware components. Modularity, in one sense, is
not possible. Changes in the camera sensor will have
unavoidable repercussions for the illumination. The
key to designing an IOM system is to recognize the
need for system wide optimization.
Future Work
Researchers at numerous institutions are working to
expand capture volumes, extend standoff distances,
reduce residence times and decrease the cost of iris
recognition systems. They are also working to reduce
constraints on subject pose, a topic not covered here.
The development of higher resolution camera sensors
with higher sensitivity and higher frame rates and the
development of higher output near IR LEDs will
enable these improvements.
Alternative iris recognition algo rithms are also
being developed, as noted above. It is conceivable
that a new algorithm may enable interesting new tra-
deoffs in the design of iris cameras that will help us
further extend the ease of use of iris recognition.
Iris on the Move™. Figure 2 An Iris on the Move™ portal
system. (Photo provided courtesy of Sarnoff Corporation.)
Iris on the Move™
I
809
I