Lyons W.C. (ed.). Standard handbook of petroleum and natural gas engineering.2001- Volume 1
Подождите немного. Документ загружается.

MWD and LWD
1025
Bit
Wear
and
Rock Type.
Using downhole weight-on-bit and torque the
roller
cone
bit
wear
can be estimated while drilling. The well site computer can be used
to
compute in real-time a dimensionless torque
(T,)
and
a
dimensionless rate
of penetration
(R,)
using the following equation:
T,
=
DToR
x12
DWOB
BD
ROP 12
R,
=
X-
RPM*BD
60
(4-225)
(4-226)
where DTOR
=
downhole torque in klb-ft
ROP
=
rate of penetration ft/hr
RPM
=bit rpm
DWOB
=
downhole weight-on-bit in klb
BD =bit diameter in
in.
For a sharp bit drilling in shale
[
1181
the following expression is used:
T,
=
A,
+
E,
+A,
x
&
(4-227)
where
E,
=
bit efficiency (one for sharp bit; zero for worn
out
bit)
A,
=
dimensionless gouging coefficient
(A,
=
0.07
to 0.12 for milled tooth
A,
=
crushing coefficient
(A,
=
0.07
to 0.15 for milled tooth bit)
bit;
A,
=
0.2
to 0.35 for PDC bits)
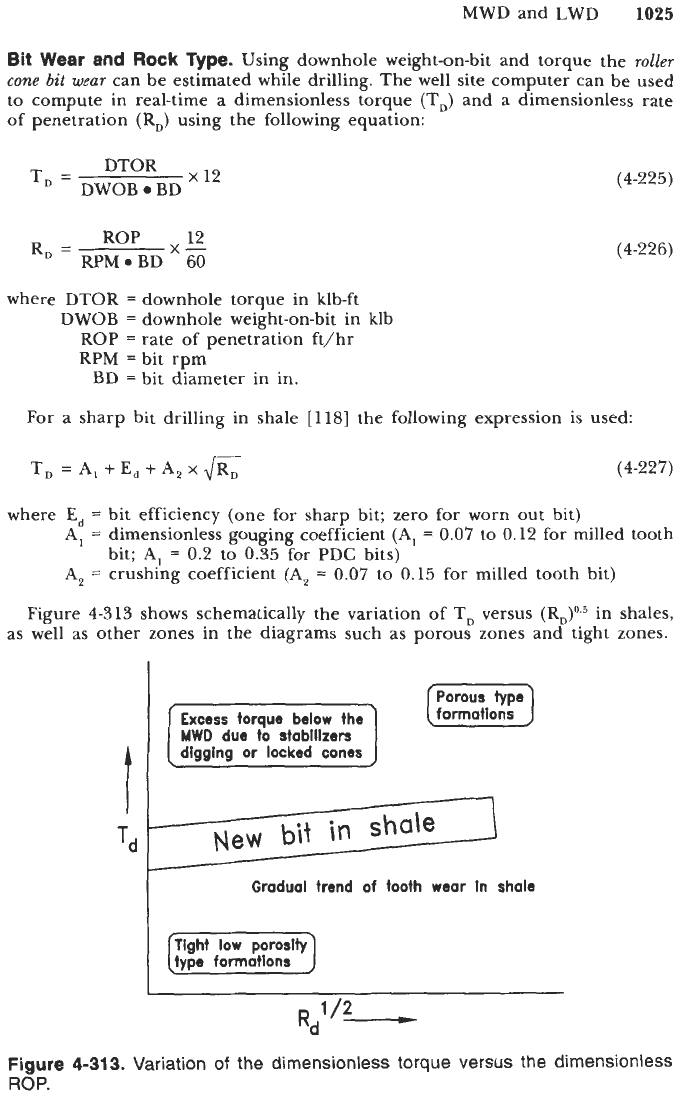
Figure 4-313 shows schematically the variation of T, versus
(R,)0.5
in shales,
as well as other zones in the diagrams such as porous zones and tight zones.
Porous type
formations
MWD
due to stabfllzen
Gradual trend
of
tooth wear
In
shale
Figure
4-313.
Variation
of
the dimensionless torque
versus
the dimensionless
ROP.
1026
Drilling and Well Completions
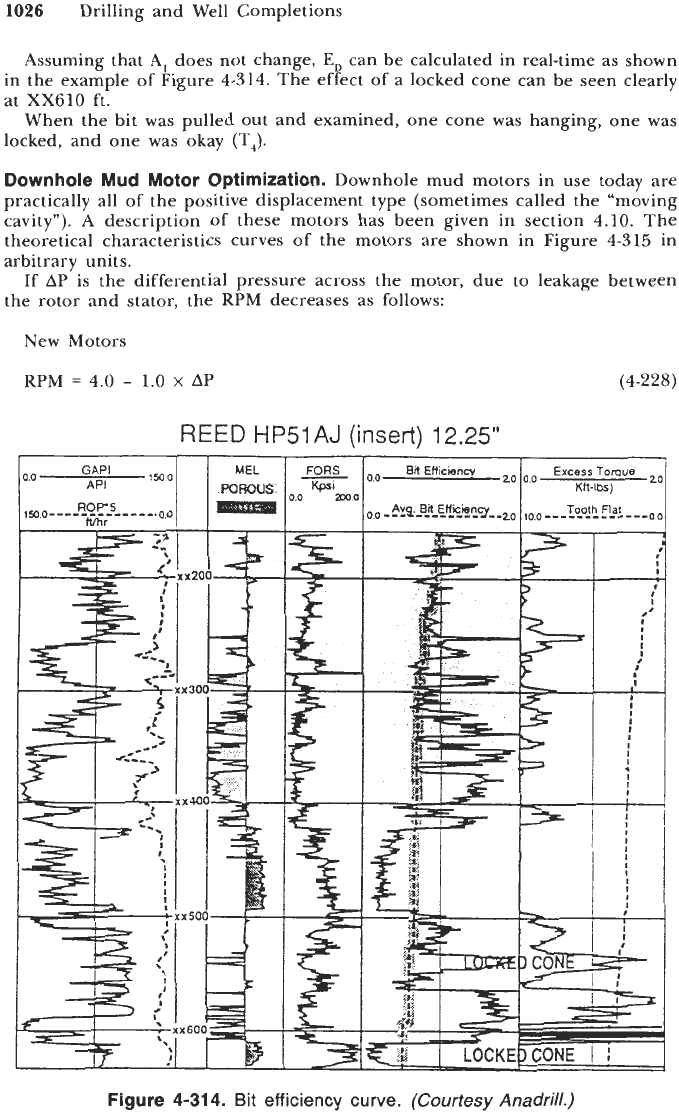
Assuming that
A,
does not change,
E,
can be calculated in real-time as shown
in the example of Figure
4-314.
The effect
of
a locked cone can be seen clearly
at
XX610
ft.
When the bit was pulled out and examined, one cone was hanging, one was
locked, and one was okay (TJ.
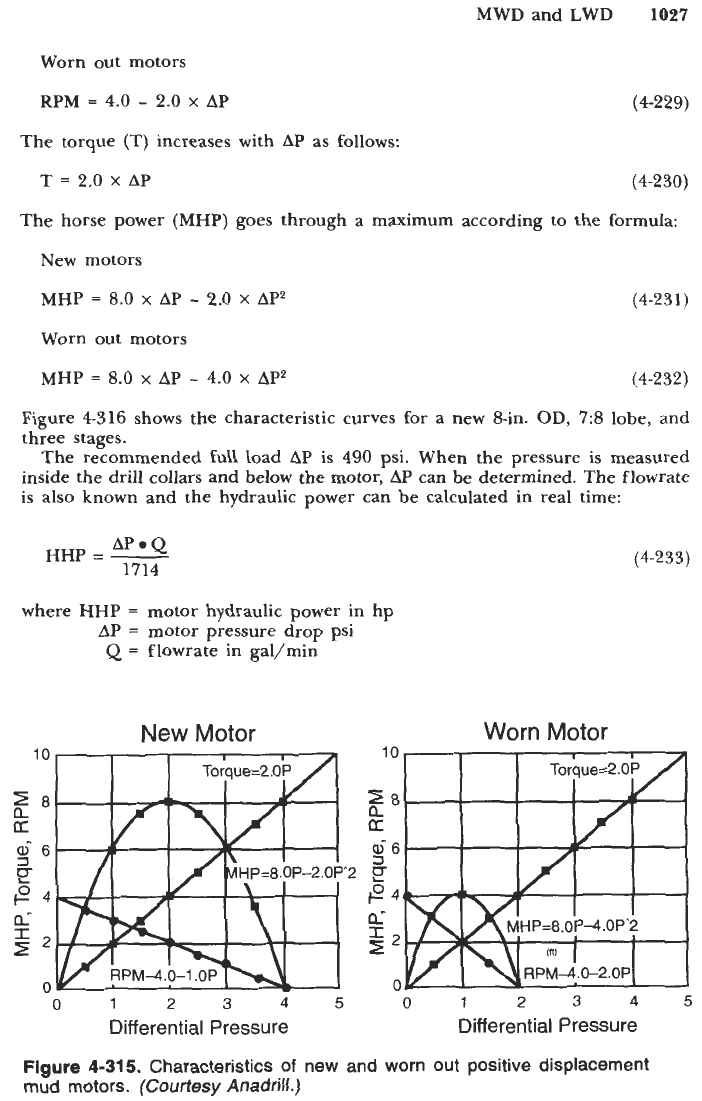
Downhole
Mud
Motor Optimization.
Downhole mud motors in use today are
practically all of the positive displacement type (sometimes called the "moving
cavity"). A description of these motors has been given in section
4.10.
The
theoretical characteristics curves of the motors are shown in Figure
4-315
in
arbitrary units.
If AP is the differential pressure across the motor, due to leakage between
the rotor and stator, the RPM decreases as follows:
New Motors
RPM
4.0
-
1.0
x
AP
REED
HP51
AJ
(insert)
12.25"
FORS
-
0.0
KPsim
(4-228)
Figure
4-314.
Bit
efficiency curve.
(Courtesy
Anadrill.)
MWD
and
LWD
1027
Worn out motors
(4-229)
RPM
=
4.0
-
2.0
X
AP
The torque
(T)
increases with
AP
as follows:
(4-230)
T
=
2.0
x
AP
The horse power
(MHP)
goes through a maximum according to the formula:
New motors
MHP
=
8.0
x
AP
-
2.0
x
AP2
Worn out motors
MHP
=
8.0
x
AP
-
4.0
x
AP2
(4-231)
(4-232)
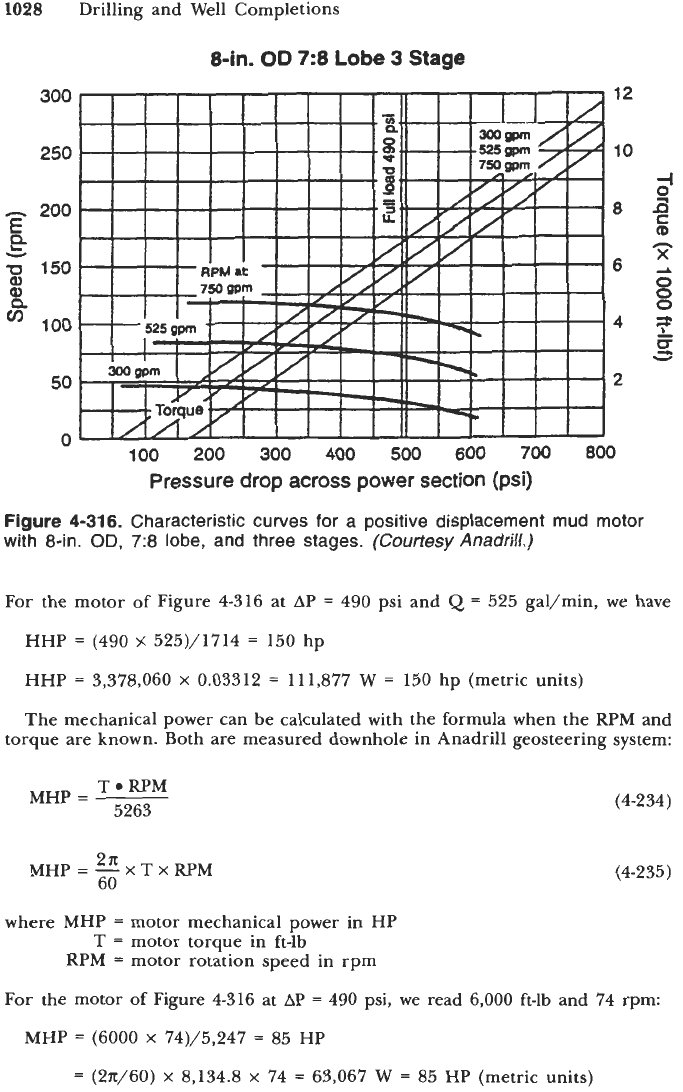
Figure
4-316
shows the characteristic curves
-Jr
a new 8-in.
OD,
7:8 lobe, and
three stages.
The recommended full load
AP
is
490
psi. When the pressure is measured
inside the drill collars and below the motor,
AP
can be determined.
The
flowrate
is also known and the hydraulic power can be calculated in real time:
APeQ
1714
HHP
=
-
where
HHP
=
motor hydraulic power in hp
Q
=
flowrate in gal/min
AP
=
motor pressure drop
psi
(4-233)
New
Motor
Worn
Motor
10
E*
oc
46
P
a-
P4
$2
a
0
1
2
3
45
0
1
23
45
Differential Pressure
Differential Pressure
Figure
4-31
5.
Characteristics
of
new and worn
out
positive displacement
mud motors.
(Courtesy
Anadrill.)
1028
Drilling and Well Completions
8411.
OD
7:8
Lobe
3
Stage
300
250
h
200
E
P
150
a2
0.
100
h
X
50
0
100
200
300
400
500
600
700
800
Pressure
drop
across power section (psi)
Figure
4-31
6.
Characteristic curves for
a
positive displacement mud motor
with 8-in.
OD,
7:8 lobe, and three stages.
(Courtesy
Anadrill.)
For the motor of Figure
4-316
at AP
=
490
psi and
Q
=
525
gal/min, we have
HHP
=
(490
x
525)/1714
=
150
hp
HHP
=
3,378,060
x
0.03312
=
111,877
W
=
150
hp (metric units)
The mechanical power can be calculated with the formula when the RPM and
torque are known. Both are measured downhole in Anadrill geosteering system:
T*RPM
5263
MHP
=
(4-234)
2x
60
MHP
=
-
x
T
X
RPM
(4-235)
where MHP
=
motor mechanical power in HP
T
=
motor torque in ft-lb
RPM
=
motor rotation speed in rpm
For the motor
of
Figure
4316
at AP
=
490
psi, we read
6,000
ft-lb and
74
rpm:
MHP
=
(6000
x
74)/5,247
=
85
HP
=
(2x/60)
x
8,134.8
x
74
=
63,067
W
=
85
HP (metric units)
MWD and LWD
1029
The efficiency of the motor of Figure
4-316
is
MHP
-
85
HHP
150
=
-
-
~
=
56%
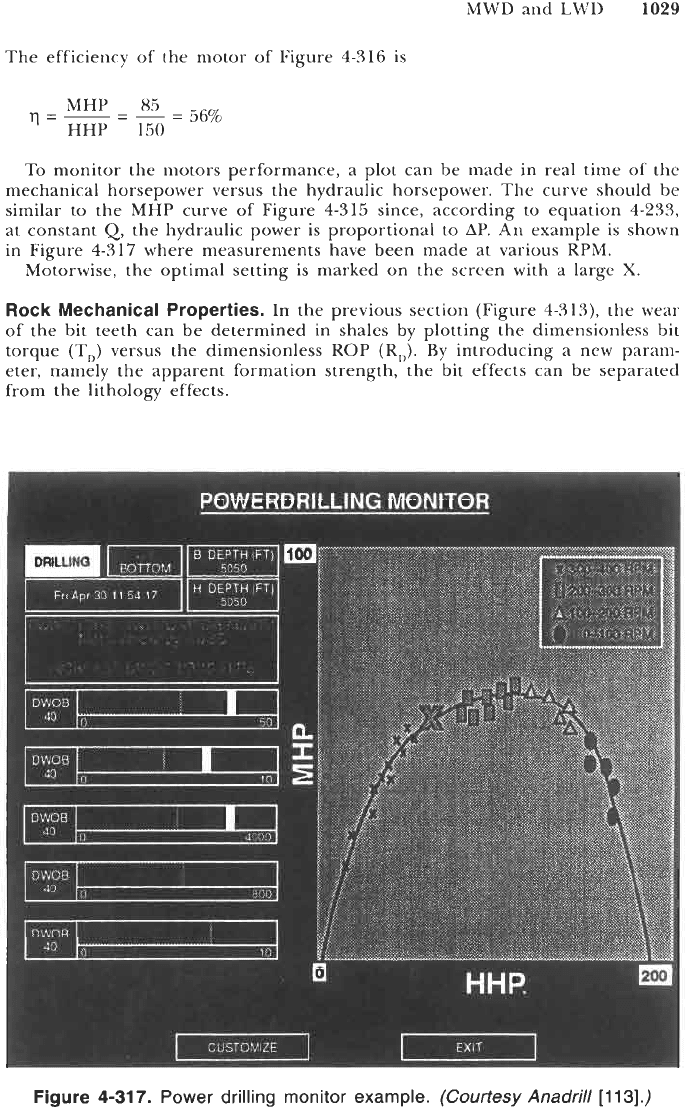
To monitor the motors performance, a plot can be made in real time of the
mechanical horsepower versus the hydraulic horsepower. The curve should be
similar to the MHP curve of Figure
4-315
since, according to equation
4-233,
at constant
Q,
the hydraulic power is proportional to AP. An example is shown
in Figure
4-317
where measurements have been made at various RPM.
Motorwise, the optimal setting is marked on the screen with a large
X.
Rock Mechanical Properties.
In the previous section (Figure
4-313),
the wear
of the bit teeth can be determined in shales by plotting the dimensionless bit
torque
(T,)
versus the dimensionless ROP (RD). By introducing a new param-
eter, namely the apparent formation strength, the bit effects can be separated
from the lithology effects.
Figure
4-317.
Power drilling monitor example.
(Courtesy
Anadrill
[113].)
1030
Drilling and Well Completions
The apparent formation strength (FORS) is calculated with the following
equation:
DWOB
x
RPM
x
A,
x
E,
ROP
x
BD
FORS
=
40~
(4-236)
where FORS
=
apparent formation strength in psi
DWOB
=
downhole weight-on-bit in lb
RPM
=
bit rotation per minute
A,
=
dimensionless gouging coefficient
(A,
=
0.07
to
0.12
for milled
E,
=
bit efficiency (one for a sharp bit, zero for a worn bit)
tooth bit,
A,
=
0.2
to
0.35
for PDC bits)
ROP
=
rate of penetration in ft/hr
BD
=
bit diameter in in.
This equation produces a formation strength that is independent of the wear
state of the bit and other measurable drilling variables. Figure
4-318
is a
schematic plot of the dimensionless torque
(T,)
versus the apparent formation
strength (FORS).
Once the shale line has been established for a certain drill bit, the porous
and tight zones can be determined regardless of bit condition.
0
K
0
c
s
1.0
0.8
0.6
0.4
I
-
tight
0.2
0.0
8
I
I
1
0 50
IO0
150
roo
FORS (kpsi)
Figure
4-318.
Schematic plot
of
the dimensionless torque
T,
versus the
apparent formation strength.
MWD and LWD
1031
Demonstration.
If DWOB
=
14,000
lb, RPM
=
100,
A,
=
0.1,
E,
=
1
(new bit),
ROP
=
80
ft/hr,
BD
=
8.5
in.
FORS
=
8,235
psi. Typical shallow Gulf Coast formations.
The techniques described provide the following answers at the rig site,
in
real-time:
rock strength
wear state of the bit teeth in shales
lithological correlations
excess torque or cone locking
This last point is illustrated in Figure
4-314
where FORS
=
190
kpsi, when the
cones lock.
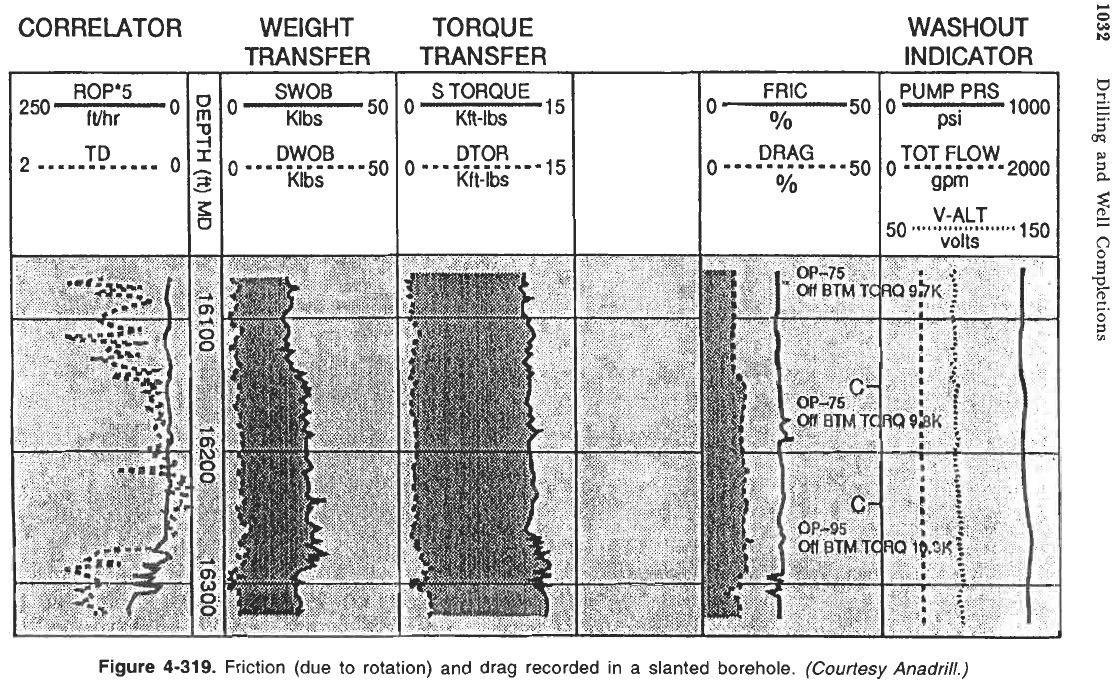
Example
20:
Drag and Friction Coefficients
Figure
4-319
shows the friction (due to rotation) and the drag recorded in a
slanted borehole.
Borehole data:
Average inclination:
24"
KOP
at
3,000
ft
Mud weight:
16
lb/gal
Drillstring data:
Drillpipe
OD:
44
in.
weight:
22
lb/ft
metal displacement:
0.2855
gal/ft
weight:
223
lb/ft
length:
1,000
ft
Drill collars
OD:
8
in.
metal displacement:
2.2882
gal/ft
1.
Compute the drag coefficient at
16,200
ft.
2.
Compute the friction coefficient at
16,200
ft.
3.
Compare with the data computed and recorded at
16,200
ft.
Solution
1.
Length of inclined drillpipes:
16,200
-
3,000
-
1,000
=
12,200
ft.
Weight of drillpipes in air:
12,200
x
22
=
268.4
klb.
Weight of displaced mud:
0.2855
x
12,200
x
16
=
55.73
klb.
Weight of drillpipes in mud:
268.4
-
55.73
=
212.67
klb.
Weight
of
drill collars in air:
223
x
1,000
=
223
klb.
Weight of displaced mud:
2.2882
x
1,000
x
16
=
36
klb.
Weight of drill collars in mud:
223
-
36
=
187
klb.
Total weight of inclined pipe and drill collars:
212.67
+
187
=
399.6'7
klb
Surface weight-on-bit:
23
klb
Downhole weight-on-bit:
5
klb
Using Equation
4-218
(-400
klb).
CORRELATOR WEIGHT
TRANSFER
SWOB
Klbs
v
=P
Klbs
5o
ROP'5
ftlhr
TD
I
DWOB
5o
2
...m...-....
0
O............
'0
-I
5
TORQUE
TRANSFER
Kft-lbs
SToRQUE
151
50
FRlC
WASHOUT
INDICATOR
O
looo
PUMPPRS
psi
TOT
FLOW
2ooo
o..........
QPm
V-ALT
volts
150
50
Figure
4-319.
Friction (due to rotation) and drag recorded in
a
slanted borehole.
(Courtesy
Anadrill.)
MWD and LWD
1033
DRAG
=
23-5
=
0.11
=
11%
400 x
sin
24
2.
Surface torque:
11.1
kft lb
1.5
kft lb Downhole torque:
Using Equation
4-2 19
(11.1-
1.5)~12
FRIC
=
=
0.23
=
23%
sin
24
x
(212.67 x 2.25
+
187 x 4)
3.
The values read on Figure
4-319
DRAG
=
11%
FRIC
=
22%
The algorithms used for computing the values of Figure
4-319
are identical
to those used in questions
1
and
2.
Example
21
:
Drag and Friction Coefficients
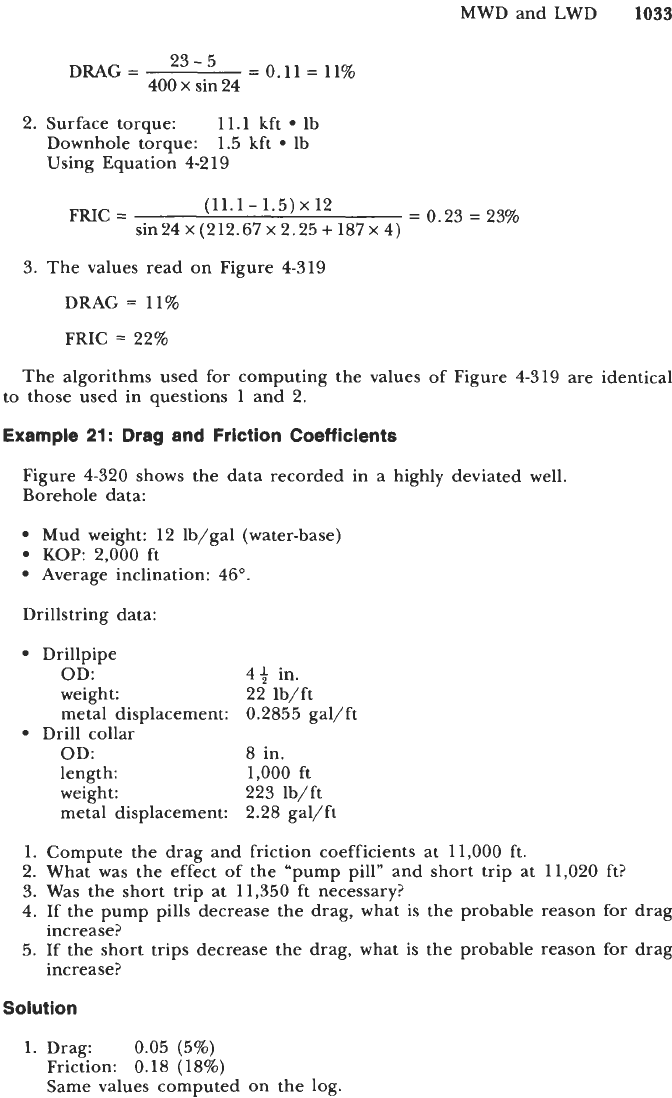
Figure
4-320
shows the data recorded in a highly deviated well.
Borehole data:
Mud weight:
12
lb/gal (water-base)
KOP:
2,000
ft
Average inclination:
46”.
Drillstring data:
Drillpipe
OD:
4+
in.
weight:
22
lb/ft
metal displacement:
0.2855
gal/ft
OD:
8
in.
weight:
223
lb/ft
metal displacement:
2.28
gal/ft
Drill collar
length:
1,000
ft
1.
Compute the drag and friction coefficients at
11,000
ft.
2.
What was the effect of the “pump pill” and short trip at
11,020
ft?
3.
Was the short trip at
11,350
ft necessary?
4.
If the pump pills decrease the drag, what is the probable reason for drag
5.
If the short trips decrease the drag, what is the probable reason for drag
increase?
increase?
Solution
1.
Drag:
0.05
(5%)
Friction:
0.18 (18%)
Same values computed on the log.
1034
Drilling and Well Completions
Pump pill
'
Short
trip
11
stands
Circulate
bottoms
up
Pump pill
Short
trip
15
stands
Short
trip
17
stands
.
Short trip
19
stands
Pump
problems
Pump pill
Figure
4-320.
Example
of
drilling data recorded in a highly slanted borehole.
(Courtesy
Anadrill.)
2.
It decreased the drag from 5 to 0.5% for the next 200 ft of drilling. Cutting
3.
Probably not.
4.
Probably cutting buildup.
5.
Probably stabilizers hanging.
Example
22:
Shocks Recording
Figure
4-321
shows the data recorded in a borehole. Shocks have been
monitored. The curve at the right shows the number of shocks per second with
an amplitude greater than 25 g.
buildup may be the problem.