Lyons W.C. (ed.). Standard handbook of petroleum and natural gas engineering.2001- Volume 1
Подождите немного. Документ загружается.

MWD and LWD
1045
In
1971,
Rehm and McClendon
[121]
introduced the
corrected
&exponent,
dc5,
for mud weight.
d,,
=
-
xd
ECW
(4-246)
where G
=
normal gradient
ECW
=
equivalent weight with the mud used
d
=
d-exponent
The dc, exponent is mostly used in Eaton's equation for a quantitative estima-
tion of the pore pressure using the following equation
[122]:
(4-247)
where
P
=
formation pore pressure in psi
=
true vertical depth in ft
Pob
=
overburden pressure in psi
do,
=
extrapolated normal corrected d-exponent, in normally compacted
(P,/Zv),
=
normal gradient in psi/ft
shales, not overpressured
dcS
=
observed corrected d-exponent
Eaton's equation is the most commonly used relationship in the industry. It
has provided good results in many areas of the world, even though the basic theory
remains questionable. Bit wear corrections were attempted, but since bit wear
could not be quantified prior to Anadrill
TdR,
technique (see Equations
4-225
and
4-226),
the bit wear correction in the dcS technique is rarely used.
Another technique used for interpreting the dCs curve is the
equivalent
depth
method.
The concept is as follows. The porosity, thus do, observed in the
overpressure section at a given depth,
Z,,
is the same as would be expected at
a shallower depth,
Z,,
in a normal pressure environment. Terzaghi's relation
(Equation
4-243)
can be written at both depths with
P
=
1.
Pobl
=
ov,
+
P,,
at depth
Z,
Pob2
=
ov2
+
P,
at depth
Z2
Since an equal dc, implies equal
ov
we have
(4-248)
An example will be worked out later.
Other attempts to develop a pore pressure evaluation method from different
drilling equations were made by Combs, by Bourgoyne and Young and by Bellotti
and Giacca
[loll.
The three models follow the same general approach: a drilling
equation is developed assuming that all variables are independent. The
ROP
is
then normalized to eliminate the effect of each variable but the pore pressure.
These equations attempt to take more variables into account.
1046
Drilling and Well Completions
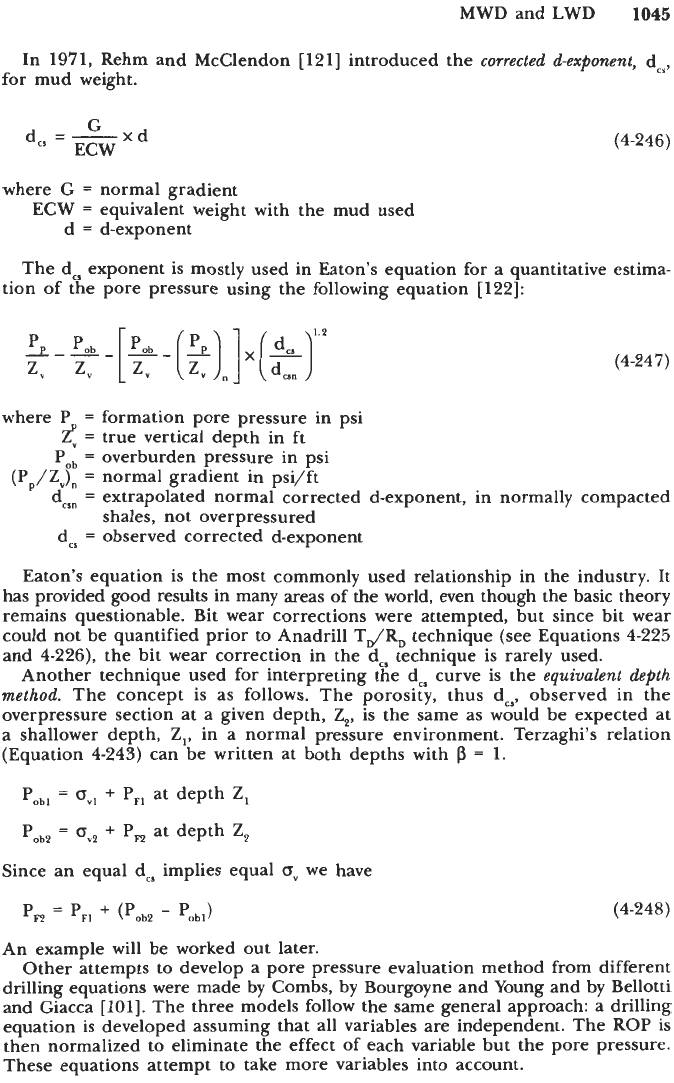
Demonstration.
Using the example in Figure
4-327,
we will plot the corrected
d-exponent data, expressed in d-units, in a linear scale, and a logarithmic scale
[loll.
Both scales give the same results; however, the correlations in normally
Dressure shales mav be easier in the logarithmic scale. Applying Eaton’s equation
13,000
ft, with a normal gradient of
0.465
psi/ft, an
of
1
psi/ft, dcln
=
1.64
and
dCs
=
1.17,
we find
-
?Equation
4-247)
’at
overburden gradient
P
1
=
0.643
psi/ft
z,
Pp
=
8,362
psi
(Ppn
=
6,045
psi)
At
16,000
ft, where do,
=
1.8
and dcS
=
0.8,
P
=
0.797
psi/ft
z,
MODIFIED
d
-
EXPONENT
(d-UNITS)
YOOlFlEO
d
-
EXPONEW
1
d-UNITS)
Figure
4-327.
d,
plots
for a
US.
Gulf Coast well in shales: (a) linear
scale;
(b)
logarithmic
scale.
(Courtesy
SPE
[loll.)
MWD
and
LWD
1047
Pp
=
10,371
psi
(Ppn
=
7,440
psi)
Applying the equivalent depth technique at 13,000 ft, the same dCs is read
on
the extrapolated normal trend at 4,000
ft.
This gives
P,,
=
1,860
psi
P,,
=
13,000
psi
POb,
=
4,000
psi
P,,
=
10,860
psi
This technique is probably less accurate than the technique using Eaton’s equa-
tion. This equation has been established statistically in the Gulf Coast.
No
independent pressure measurements are available for this demonstration
calculation.
When
downhole
drilling
measurements
are available, the techniques based on
weight-on-bit, can be implemented with a better accuracy since the drag is elimi-
nated. However, they are still based on a trend line determined in non-overpressured
shales. Sometimes, such shales do not exist. Changes in lithology may affect the
trend line determination. Early
or
real-time pressure detection can be made using
the formation strength parameter
FORS
discussed previously (Equation
4-236).
FORS is first normalized to a 9-lb/gal mud and
0
psi pressure using
lx
1
2wtd
0.O02PM
+
1.0
FORS,,,
=
FORS
x
-
-
1.0
9
(4-249)
where FORS,,
=
FORS with
9
Ib/gal and
0
psi
FORS
=
measured formation strength
W,
=
mud weight in Ib/gal
P,
=
mud pressure in psi
FORS,,, is used to determine the excess effective porosity in the formation
using an equation greatly simplified here:
(Pop
=
A
-
(B
FORS,,,)
A and
B
are functions of many parameters such as non-shale-rock strength,
volume of shale, shale rock strength, effective porosity, and overpressured shale
rock strength. These parameters are first initialized with local knowledge, for
example, the volume
of
shale,
Vc,,
of
65%
sandstone
FORS,
etc. The calculated
pore pressure is referred to as the “bit pore pressure.” Petrophysical data coming
later during drilling (gamma ray, resistivity, neutron density) are used to refine
the parameter values for a more accurate pressure evaluation. The technique
will be described in more detail later on. The total pore pressure is derived
with the following equation:
(4-250)
1048
Drilling and Well Completions
where
Pp
=
pore pressure in the overpressured zone
P,
=
normal formation pressure
oV
=
vertical stress
aOp
=
excess effective porosity
an
=
normal shale porosity at the depth of burial (well depth)
k
=
constant
No
trend line is needed to determine the formation pressure. However, petro-
physical data are required to refine the results. A computer is mandatory to
implement the technique.
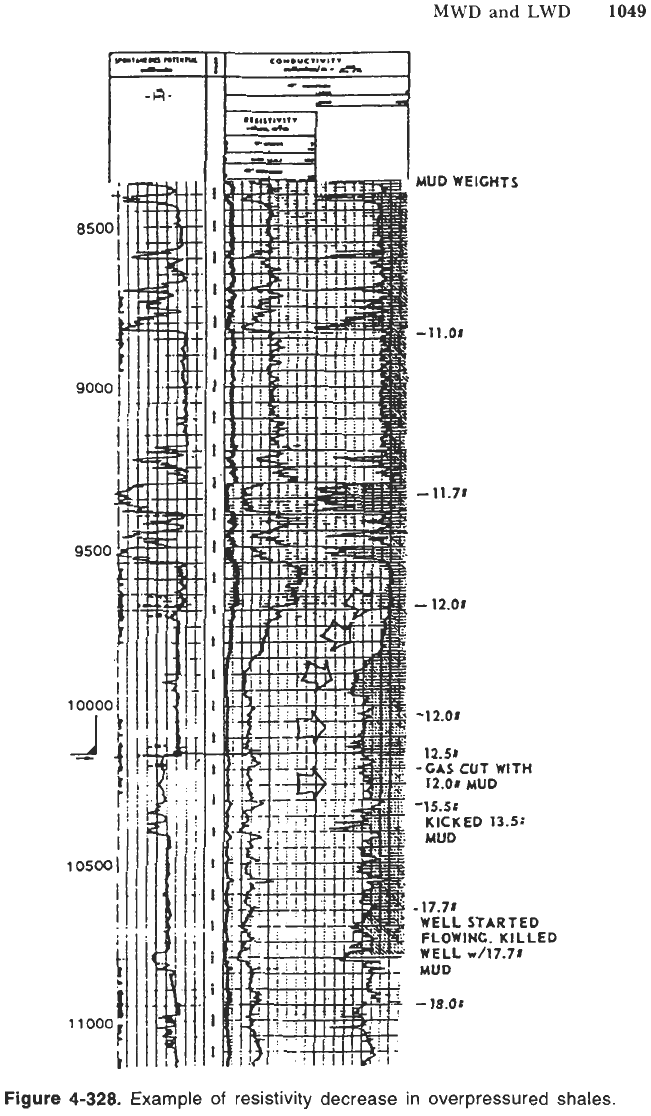
Abnormal Formation Pressure Detection with Logging Parameters.
The first
logging parameter used for detecting overpressure zones is the
shale
resistivity.
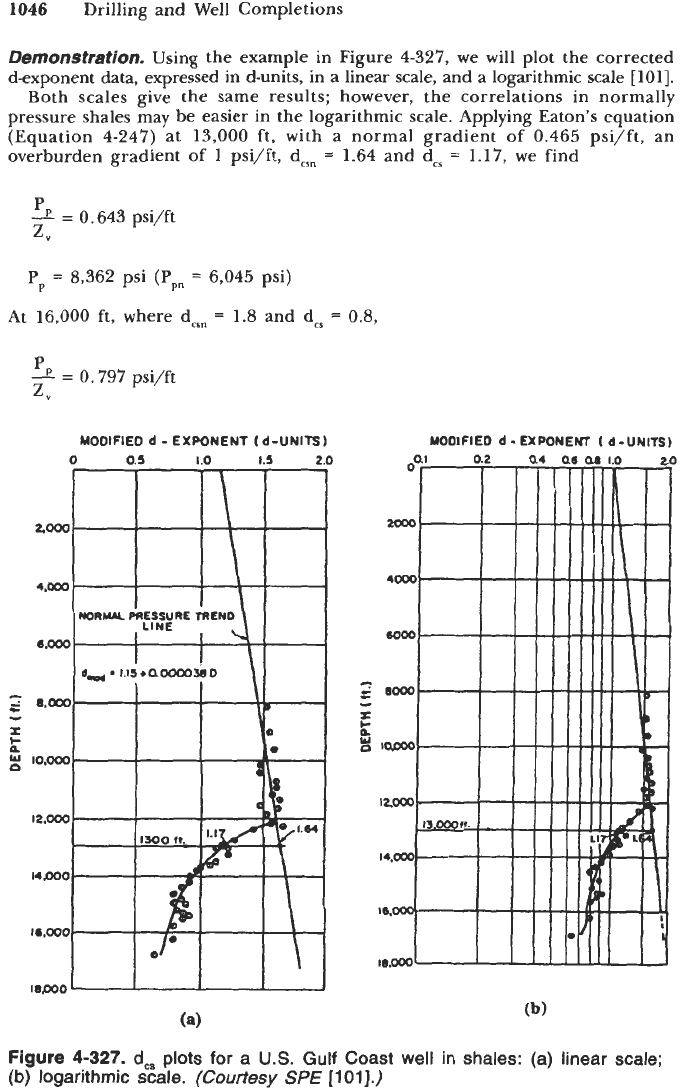
The first observation of the shale resistivity decrease in overpressured zone was
made by Hottman and Johnson [123]. A normal resistivity increase trend exists in
normally pressured shales. In overpressured shales the resistivity decreases sharply
as shown in Figure 4-328. The shale resistivity, as seen in the amplified short
normal, decreases from approximately
1
R
m at 9,000 ft to about 0.5
R
m at
10,000 ft. After setting casing at 10,150 ft, the mud weight had to be raised
progressively to
18
lb/gal to keep the well under control.
Hottman and Johnson developed an empirical correlation to relate the ratio
of resisitivities to the pore pressure gradient. In 1972, Eaton developed an
empirical relationship that he modified in 1975 to the following [122]:
(4-251)
where
P
=
formation pressure in psi
<
=
true vertical depth in ft
Po,
=
overburden pressure in psi
Rs,
=
observed shale resistivity in
a
m
(P,/ZV)"
=
normal gradient in psi/ft
Rshn
=
extrapolated shale resistivity in normally compacted shales in
Q
m
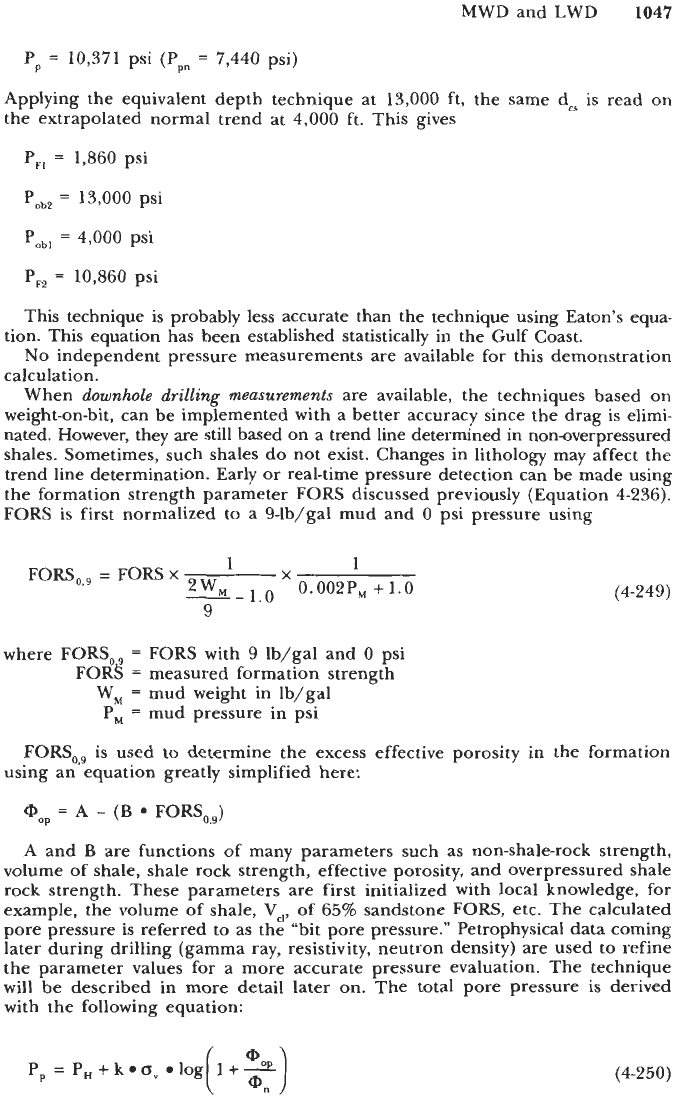
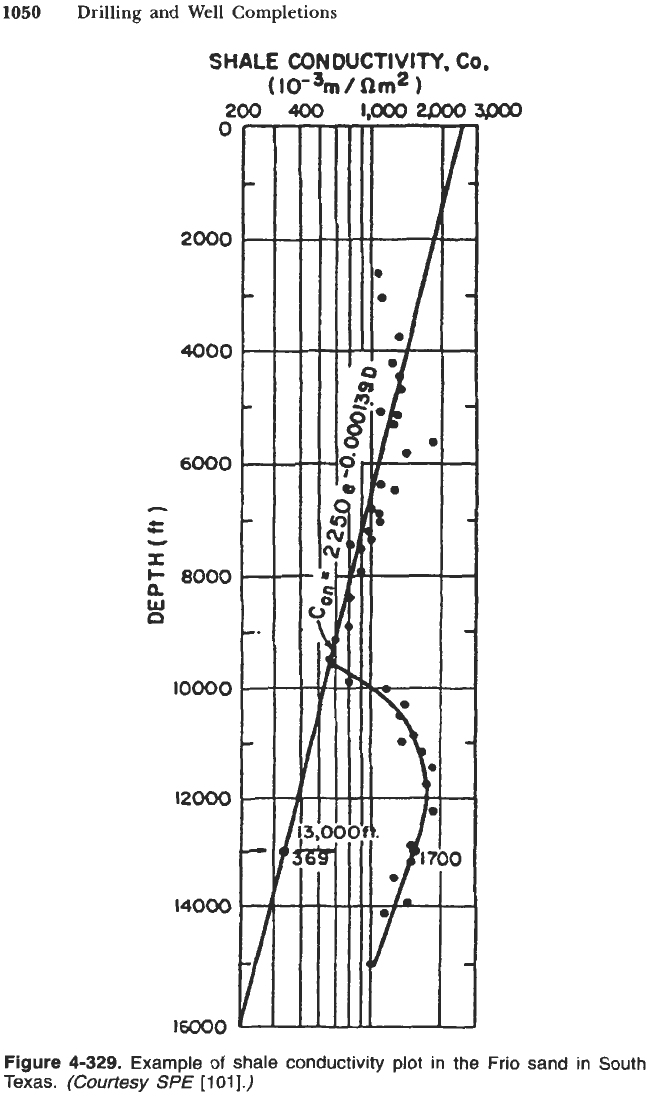
In another example from Bourgoyne, the shale conductivity (inverse of
resistivity) was plotted as shown in Figure 4-329 [loll.
Demonstration.
Both resistivity and conductivity scales have been used with
approximately the same success. At 13,000 ft, C,
=
1,700 mS/m and CIhn
=
369 mS/m. Assuming a normal gradient of 0.465 psi/ft and an overburden
gradient of
1
psi/ft, we get
P
9
=
0.92 psi/ft
z,
Pp
=
11,960 psi
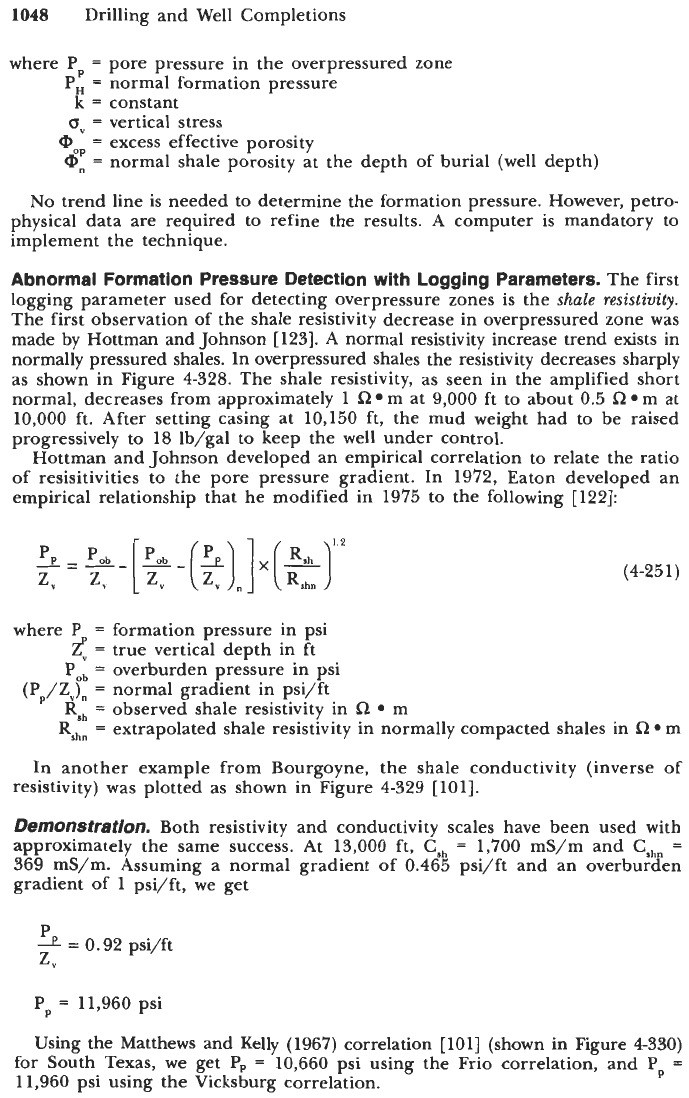
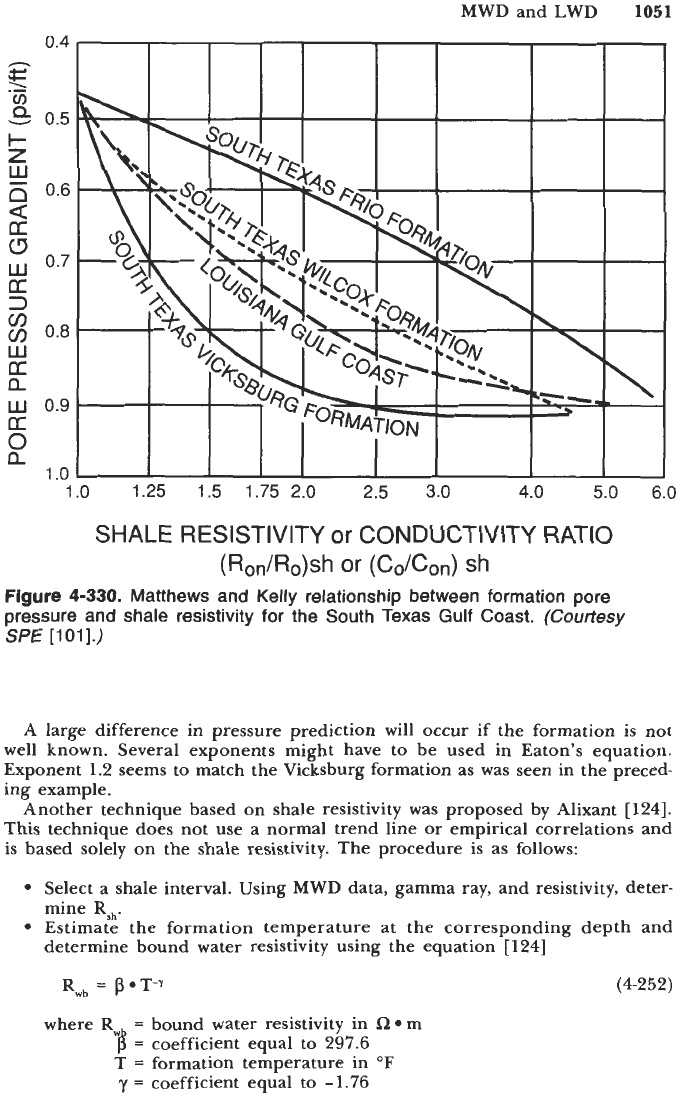
Using the Matthews and Kelly (1967) correlation [loll (shown in Figure 4330)
for
South Texas, we get
P,
=
10,660 psi using the Frio correlation, and
P,
=
11,960 psi using the Vicksburg correlation.
MWD
and
LWD
1049
-4-
8500
9000
t
i
I
I
I
I
I
I
I
I
I
1
I
I
I
I
i
i
I
I
-
MUD WEIGHTS
-11.08
-11.78
-
12.08
-12.08
12.58
-GAS CUT WITH
12.01
MUD
-15.5:
KICKED
13.53
MUD
-
17-71
WELL STARTED
FLOWING. KILLED
WELL
rA7.78
MUD
-
18.0:
Figure
4-328.
Example
of
resistivity decrease in overpressured shales.
1050
Drilling
and
Well Completions
SHALE
CONDUCTIVITY.
Co.
(
io-%/
Qm2
200
400
l.ooo20003P00
0
2000
4000
6000
c
c
.c
-
I
W
Q
8000
10000
12Ooo
14000
16000
Figure
4-329.
Example
of
shale conductivity
plot
in the Frio sand in South
Texas.
(Courtesy
SPE
[lo1
J.)
MWD
and
LWD
1051
0.4
h
+
cc
\
.-
v)
Q
v
0.5
I-
Z
W
E
0.6
U
(3
U
3
$
0.8
w
U
n
w
0.9
U
0
n
a
0.7
1
.o
1
SHALE RESISTIVITY
or
CONDUCTIVITY RATIO
(Ron/Ro)Sh
or
(Co/Con)
Sh
Figure
4-330.
Matthews and Kelly relationship between formation pore
pressure and shale resistivity for the South Texas Gulf Coast.
(Courtesy
SPE
[loll.)
A large difference in pressure prediction will occur if the formation is not
well known. Several exponents might have to be used in Eaton’s equation.
Exponent
1.2
seems to match the Vicksburg formation as was seen in the preced-
ing example.
Another technique based on shale resistivity was proposed by Alixant
[124].
This technique does not use a normal trend line
or
empirical correlations and
is based solely on the shale resistivity. The procedure is as follows:
Select a shale interval. Using
MWD
data, gamma ray, and resistivity, deter-
mine
R,,.
Estimate the formation temperature at the corresponding depth and
determine bound water resistivity using the equation
[
1241
Rw,
=
p.T-7
(4-252)
where
Rw
=
bound water resistivity in
LI
m
6
=
coefficient equal to
297.6
T
=
formation temperature in
OF
y
=
coefficient equal to
-1.76
1052
Drilling and Well Completions
Calculate the formation factor using
Calculate the shale porosity using the Perez-Rosales equation
[124]
(4-253)
(4-254)
where F
=
formation factor
M
=
geometrical factor, usually
1.85
Q,
=
porosity in fraction
Qr
=
residual porosity in fraction, usually
0.1
Determine the vertical effective stress, using the void ratio [e
=
@/(l
-
Q,)]
with the equation
(T,
=
1o(e-9)/cv
(4-255)
where
=
vertical stress
e
=
void ratio
ei
=
void ratio for
csV
=
1
psi
cc
=
average constant compression index
Numerically:
Apply the Terzaghi relationship (Equation
4243)
to determine the formation
pressure.
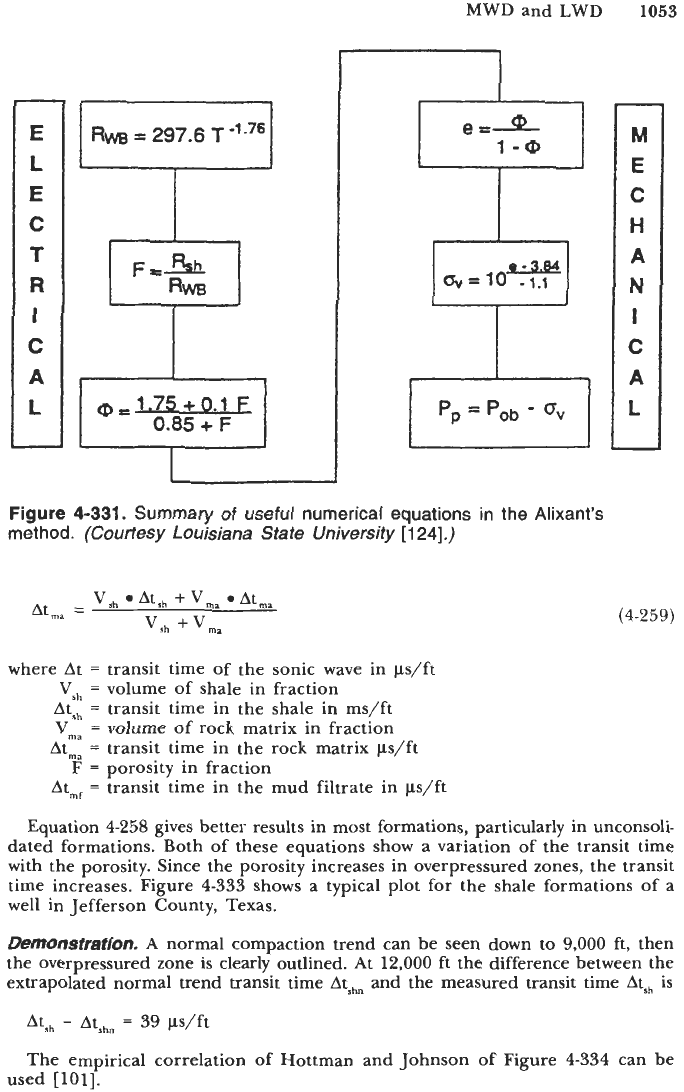
The procedure is summarized in Figure
4-331.
The technique has been tried in various areas of the world with good results
provided that the shales are very clayey. Silt, sand
or
carbonates will lead to
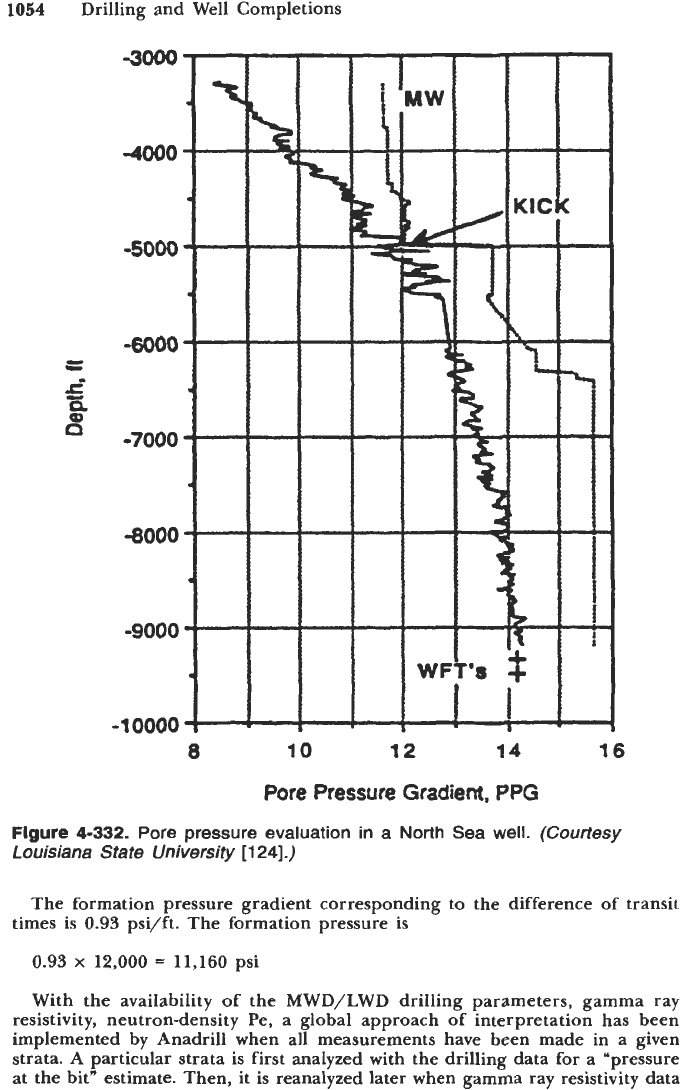
erroneous results. Figure
4-332
is an example of calculation in a North Sea well.
A
good formation pressure agreement is seen at
9,500
ft with the wireline
formation tester data.
The
sonic
log
can also
be
used to detect overpressured zones. The sonic
measurements until recently were available only on wireline. Now, MWD sonic
tools have been developed adding one more parameter for overpressure detec-
tion while drilling. TWO equations relating the formation porosity to the transit
time are used:
The Wyllie equation (simplified form)
[125]
At
=
Vs,
Atsh
Vma
Atrna
+
Q,
Atrnf
The Hunt-Raymer-Gardner equation
[
1261
(4-257)
1
1
@
At
At-
0.625.Atm
_-
(4-258)
1053
e
=AL
1
-@
-
E
L
E
C
T
R
I
C
A
L
-
1
Rm
=
297.6
T
+,
I
0,1.75+0.1
F
0.85
+
F
G=lO
-1.1
7
Figure
4-331.
Summary of useful numerical equations in the Alixant’s
method.
(Courtesy Louisiana State University
[124].)
-
M
E
C
H
A
N
I
C
A
L
(4-259)
where
At
=
transit time of the sonic wave in p/ft
Vsh
=
volume of shale in fraction
Atsh
=
transit time in the shale in ms/ft
Vma
=
volume of rock matrix in fraction
Atm,
=
transit time in the rock matrix
p/ft
Atrnf
=
transit time in the mud filtrate in ps/ft
F
=
porosity in fraction
Equation
4-258
gives better results in most formations, particularly in unconsoli-
dated formations. Both
of
these equations show a variation of the transit time
with the porosity. Since the porosity increases in overpressured zones, the transit
time increases. Figure
4-333
shows a typical plot for the shale formations
of
a
well in Jefferson County, Texas.
Demonstration.
A
normal compaction trend can be seen down to
9,000
ft,
then
the overpressured zone
is
clearly outlined. At
12,000
ft the difference between the
extrapolated normal trend transit time Atshn and the measured transit time Atsh is
Ats,,
-
Atshn
39
pS/ft
The empirical correlation of Hottman and Johnson
of
Figure
4-334
can be
used
[loll.
1054
Drilling and Well Completions
c
i
E
3
-4000
-5000
-6000
-7000
-8000
-9000
-1
0000
8
10
12
14
16
Pore
Pressure
Gradient,
PPG
Figure
4-332.
Pore pressure evaluation in a
North
Sea well.
(Courtesy
Louisiana State University
[124].)
The formation pressure gradient corresponding to the difference of transit
times is
0.93
psi/ft. The formation pressure is
0.93
x
12,000
=
11,160
psi
With the availability
of
the MWD/LWD drilling parameters, gamma ray
resistivity, neutron-density Pe, a global approach of interpretation has been
implemented by Anadrill when all measurements have been made in a given
strata.
A
particular strata is first analyzed with the drilling data for a "pressure
at the bit" estimate. Then, it
is
reanalyzed later when gamma ray resistivity data