Lyons W.C. (ed.). Standard handbook of petroleum and natural gas engineering.2001- Volume 1
Подождите немного. Документ загружается.

MWD and
LWD
1005
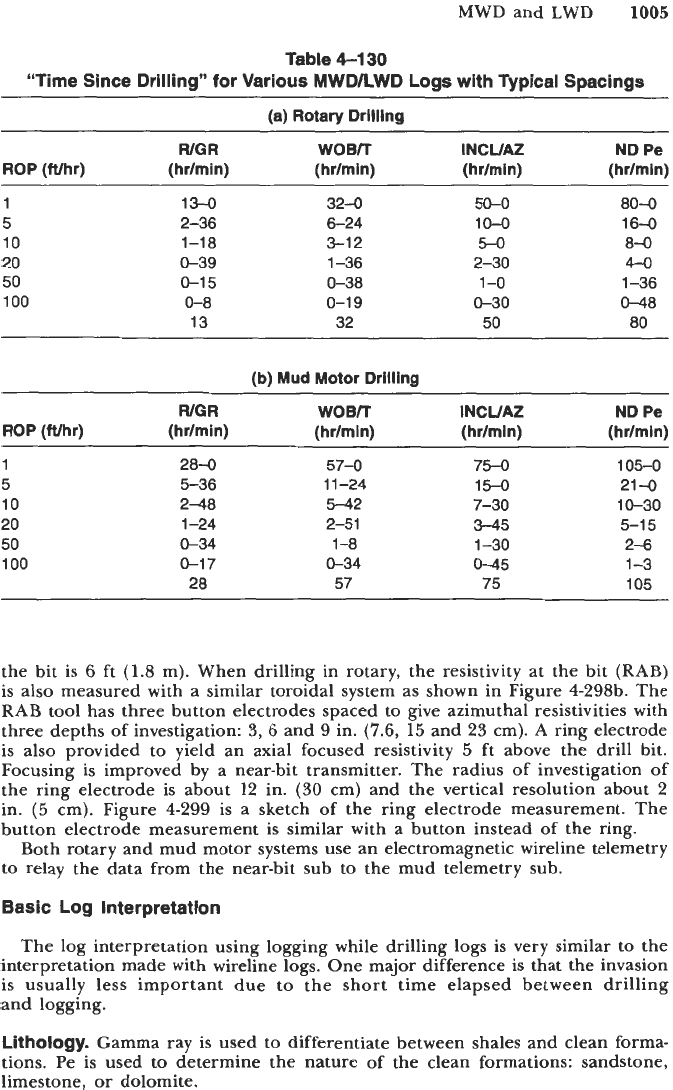
Table
4-130
“Time Since Drilling” for Various MWDAWD Logs with Typical Spacings
(a)
Rotary Drllilng
WGR
WOBR
INCUAZ ND
Pe
ROP
(Whr) (hrlmin) (hrlmin) (hrlmin) (hrlmln)
1
5
10
20
50
100
13-0
32-0 50-0 80-0
2-36 6-24 10-0
1
6-0
1-18
3-1
2 5-0 8-0
0-39 1-36 2-30 4-0
0-1
5 0-38 1-0 1-36
0-8
0-1 9 0-30 0-48
13 32 50 80
(b)
Mud
Motor Drilling
WGR
WOBlT
INCUAZ
ROP
(Whr) (hrlmin) (hrlmln) (hrlmin)
1
28-0 57-0 75-0
5 5-36
1
1-24 15-0
10
248
5-42 7-30
20 1-24 2-51 3-45
50 0-34 1-8 1-30
100
0-1
7 0-34 0-45
28 57 75
ND
Pe
(hrlmln)
105-0
21-0
10-30
5-1 5
2-6
1-3
105
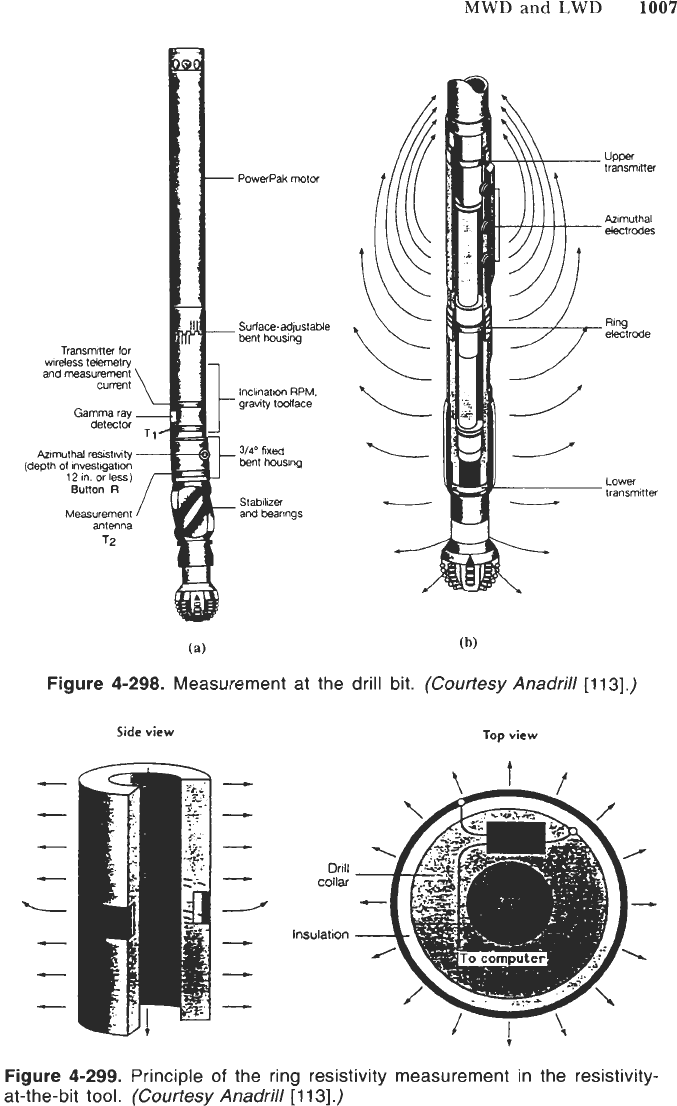
the bit is
6
ft
(1.8
m). When drilling in rotary, the resistivity at the bit
(RAB)
is also measured with a similar toroidal system as shown in Figure 4-298b. The
RAB
tool has three button electrodes spaced to give azimuthal resistivities with
three depths of investigation: 3,
6
and 9 in.
(7.6,
15
and 23 cm).
A
ring electrode
is also provided to yield an axial focused resistivity
5
ft above the drill bit.
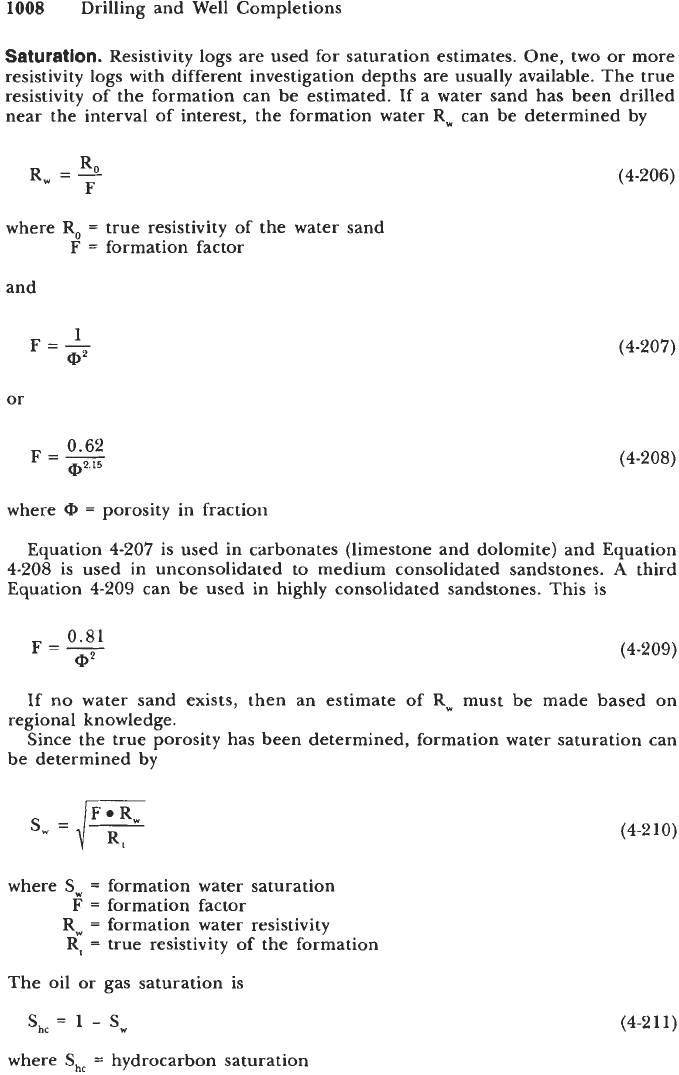
Focusing is improved by a near-bit transmitter. The radius
of
investigation of
the ring electrode is about
12
in. (30 cm) and the vertical resolution about 2
in.
(5
cm). Figure 4-299 is a sketch of the ring electrode measurement. The
button electrode measurement is similar with a button instead of the ring.
Both rotary and mud motor systems use an electromagnetic wireline telemetry
to relay the data from the near-bit sub to the mud telemetry sub.
Basic Log Interpretation
The log interpretation using logging while drilling logs is very similar to the
interpretation made with wireline logs. One major difference is that the invasion
is usually less important due
to
the short time elapsed between drilling
and logging.
Lithology.
Gamma ray is used to differentiate between shales and clean forma-
tions. Pe is used to determine the nature of the clean formations: sandstone,
limestone, or dolomite.
1006
Drilling and Well Completions
Gam
Azimuthal
PowerPak
PDM
Azimuthal
Res
Gamma
Ray,
Inch
~-
~
3/4O
Fixed
Bent-housing
Stabilizer
Bearings
+
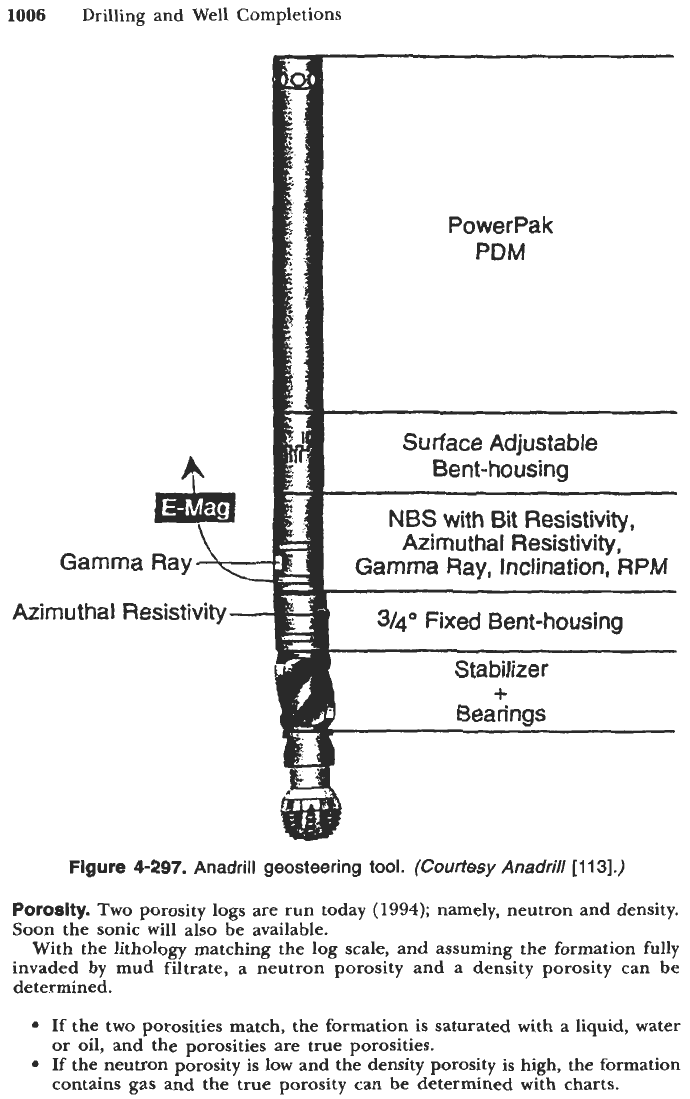
Figure
4-297.
Anadrill geosteering
tool.
(Courtesy
Anadrill
[113].)
Porosity.
Two porosity logs are run today
(1994);
namely, neutron and density.
Soon the sonic will also be available.
With the lithology matching the log scale, and assuming the formation
fully
invaded by mud filtrate, a neutron porosity and a density porosity can be
determined.
If the two porosities match, the formation
is
saturated with a liquid, water
If the neutron porosity is low and the density porosity
is
high, the formation
or
oil,
and the porosities are true porosities.
contains gas and the true porosity can be determined with charts.
MWD
and
LWD
1007
Transmmer
for
wiretess tebmetry
and measurement
current
Gamma
ray
detectw
Azimuthal
mstiuty
(depth
of
inestigatim
12
in. or less)
Bunon
R
Measurement
antenna
T2
-
PowerPak
motw
-
Surface-adjustable
bent housing
lnclinattcm RPM.
grauty Idace
3/40
fixed
bent
housing
t
f
r
2TEZngs
I
Upper
transmlner
Azimuthal
'electrodes
.
Ring
eiectrcde
Lower
transmmer
(a)
(b)
Figure
4-298.
Measurement at the drill bit.
(Courtesy
Anadrill
[113].)
Side
view
Top
view
Figure
4-299.
Principle
of
the ring resistivity measurement in the resistivity-
at-the-bit tool.
(Courtesy
Anadrill
[113].)
1008
Drilling and Well Completions
Saturation.
Resistivity logs are used for saturation estimates. One, two
or
more
resistivity logs with different investigation depths are usually available. The true
resistivity
of
the formation can be estimated. If a water sand has been drilled
near the interval of interest, the formation water R, can be determined by
R
"F
R
=A
where
R,
=
true resistivity of the water sand
F
=
formation factor
and
1
(P2
F=-
or
(4-206)
(4-207)
(4-208)
where
0
=
porosity in fraction
Equation
4-207
is used in carbonates (limestone and dolomite) and Equation
4-208
is used in unconsolidated to medium consolidated sandstones.
A
third
Equation
4-209
can be used in highly consolidated sandstones.
This
is
0.81
(P2
F=-
(4-209)
If no water sand exists, then an estimate of
Rw
must be made based on
Since the true porosity has been determined, formation water saturation can
regional knowledge.
be determined by
where
Sw
=
formation water saturation
F
=
formation factor
R,
=
formation water resistivity
R,
=
true resistivity of the formation
The oil or gas saturation is
ShC
=
1
-
S"
(4-2
10)
(4-2
1
1)
where
ShC
=
hydrocarbon saturation
MWD and LWD
1009
The volume of hydrocarbons in place at reservoir conditions is
Q,
=
7758
9
Q,
ShC
h
where
Q,
=
volume
of
hydrocarbons in bbl/acre
CP
=
porosity in fraction
h
=
formation thickness in ft
ShC
=
hydrocarbon saturation in fraction
(4-2 12)
Apparent Water
Reslstlvlty
R,.
Some MWD/LWD log sets display a curve
labeled
R,. Rwa
is computed using Equation
4-210
assuming that
S,
=
1
(100%).
Consequently
we
have
R
t
R,
=
R,
=
-
F
Since
(4-213)
(4-214)
where F
=
formation factor
a
=
constant depending on the formation, generally
1
or
0.81
or
0.62
m
=
cementation factor, generally
2
or
2.15
Finally,
Rt
cpm
R,
=
-
a
(4-2 15)
The true porosity
@
is determined with the neutron-density Pe logs.
Rt
is
generally given by the deep investigation resistivity curve.
Rwa
equals
R,
in the
water formations. It increases rapidly in hydrocarbon saturated formations.
Permeablllty.
Permeable zones can be identified with the resistivity measure-
ments made with different radius of investigation.
A
departure between the
curves of deep and shallow investigation is a qualitative indication of permeability.
The charts mentioned in the section titled “Measuring While Tripping: Wiper
Logs” can be used to estimate quantitatively the permeability if several measure-
ments during tripping are made with resistivity devices that can give the inva-
sion diameter.
Surface measurements on the mud can be used to estimate the mudcake
characteristics. If the formation pressure is known, the differential pressure can
be calculated, and a chart similar to Figures
4-293a
and b can be plotted.
The invasion diameters at various times should follow one of the permeability
curves. Note that the permeability effect is seen only for formations with
1
md
or less permeability. Above
1
md, the invasion diameter is dependent mostly
on porosity.
Log
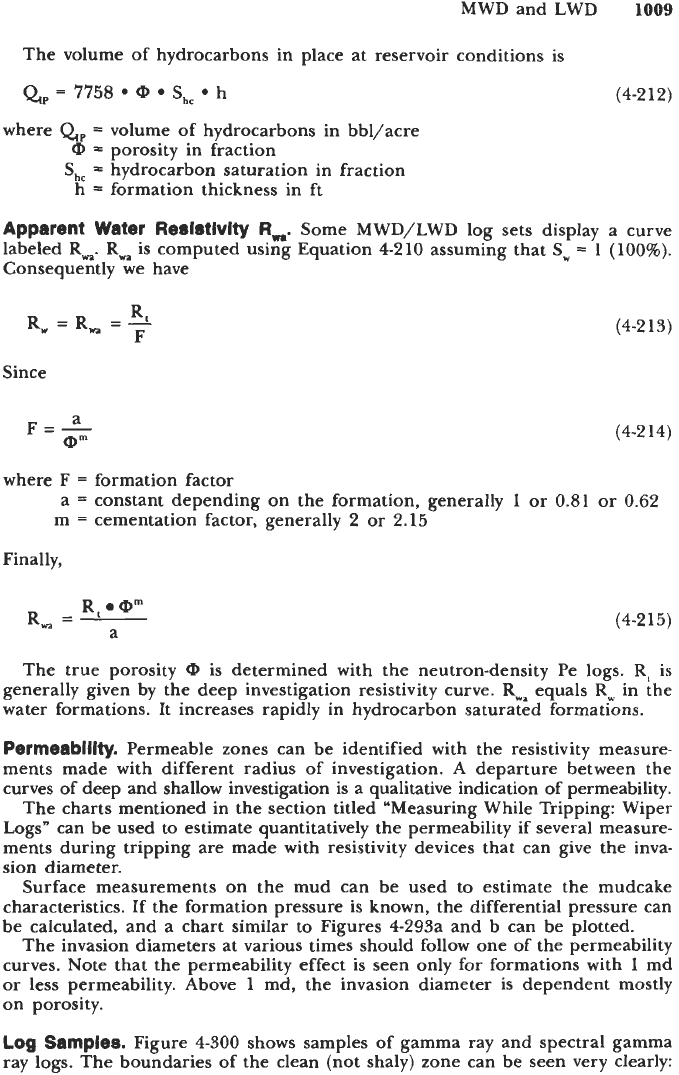
Samples.
Figure
4-300
shows samples
of
gamma ray and spectral gamma
ray logs. The boundaries of the clean (not shaly) zone can be seen very clearly:
1010
Drilling and Well Completions
MWDlLWD
logs
I500
ROP
Whr)
01
WOR
(ppm)
401
0
POTA
(%]
10
MWDlLWD
logs
Figure
4-300.
Sample
of
MWD/LWD
logs.
2,256-2,274
ft shale
2,274-2,356
ft
clean zone
2,356-2,388
ft
shale
Shale streaks are visible in most of the lower part of the clean section.
A
high radioactivity peak can be seen at
2388
ft. Looking at the spectral log
it can be seen that this peak is due to a high uranium content. Other radioactive
elements’ concentration is normal.
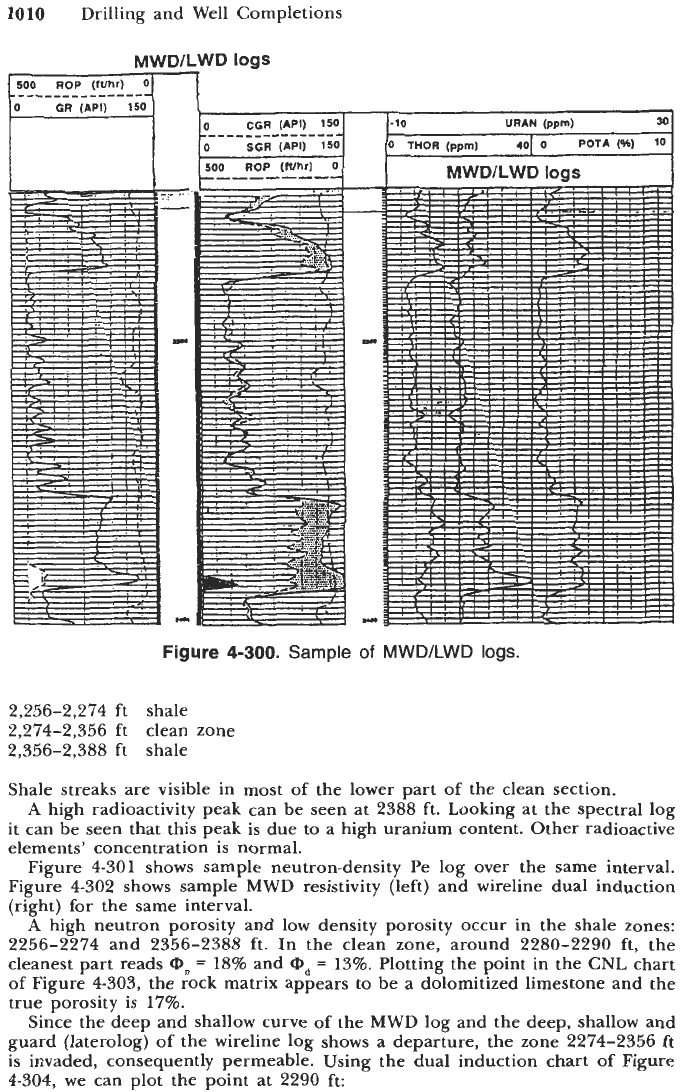
Figure
4-301
shows sample neutron-density Pe log over the same interval.
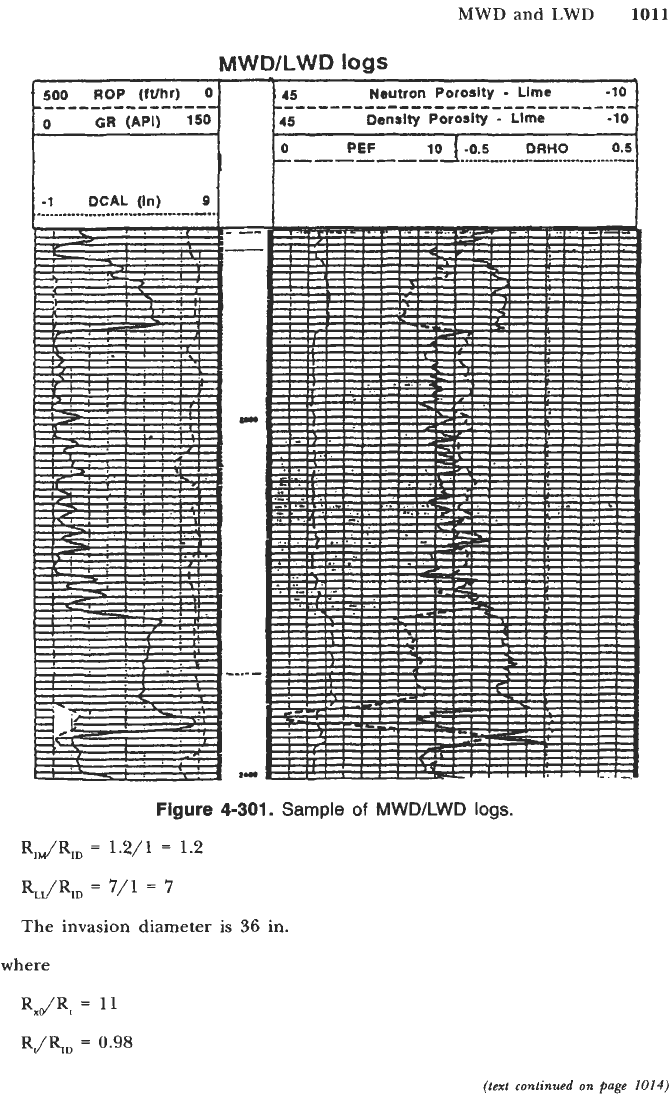
Figure
4-302
shows sample MWD resistivity (left) and wireline dual induction
(right) for the same interval.
A
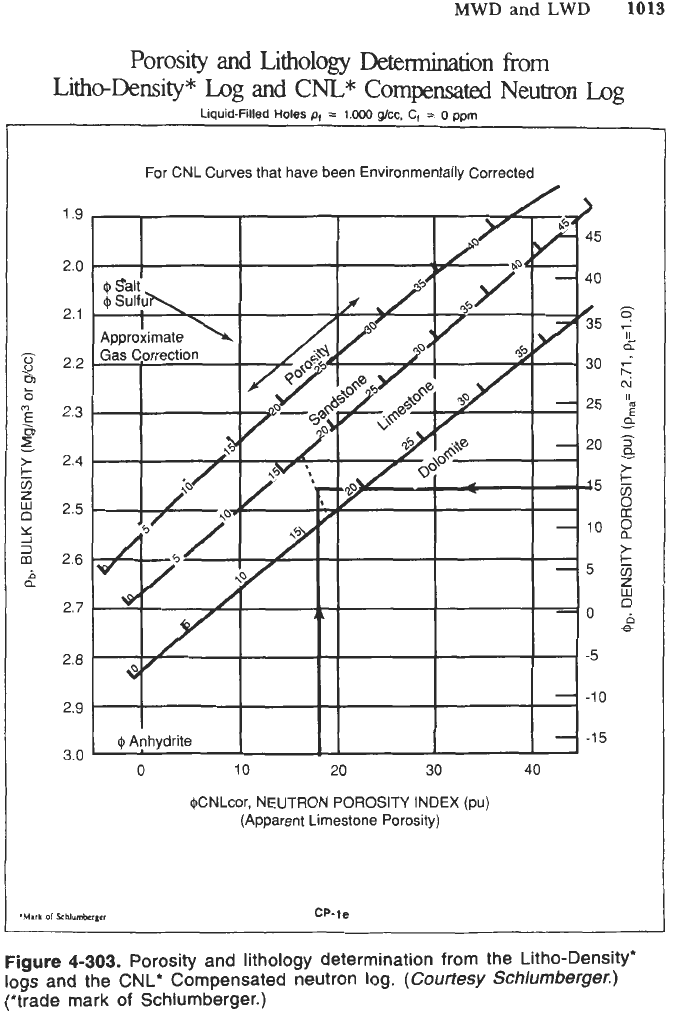
high neutron porosity and low density porosity occur in the shale zones:
2256-2274
and
2356-2388
ft. In the clean zone, around
2280-2290
ft, the
cleanest part reads
mn
=
18%
and
=
13%.
Plotting the point in the CNL chart
of Figure
4-303,
the rock matrix appears to be a dolomitized limestone and the
true porosity is
17%.
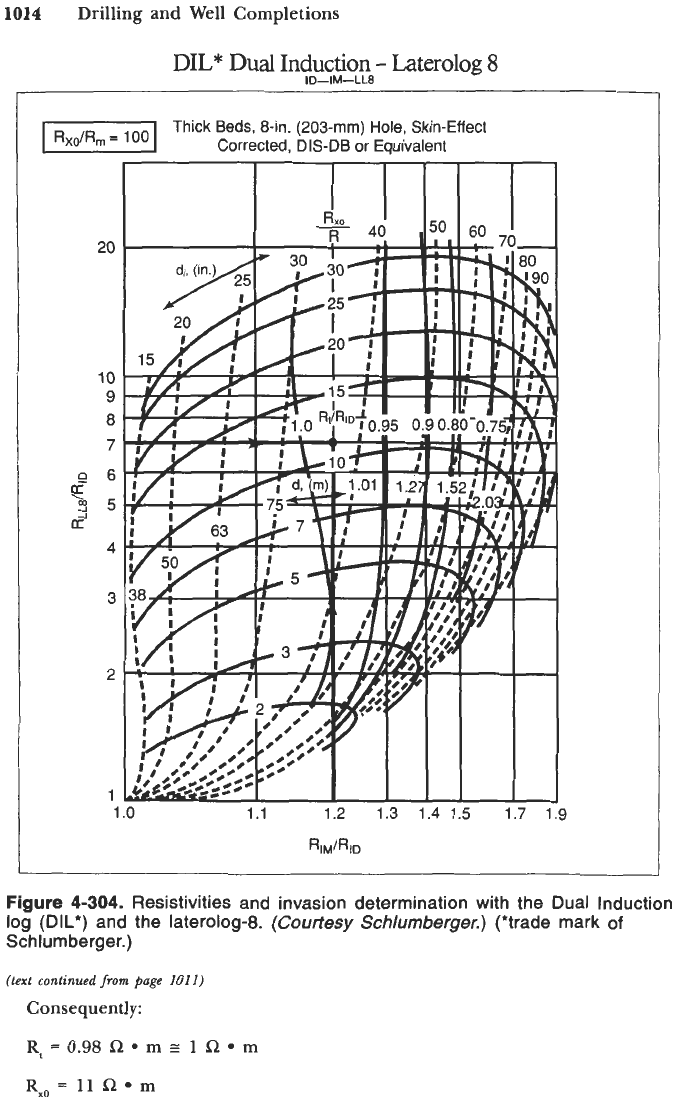
Since the deep and shallow curve of the MWD log and the deep, shallow and
guard (laterolog) of the wireline log shows a departure, the zone
2274-2356
ft
is invaded, consequently permeable. Using the dual induction chart of Figure
4-304,
we can plot the point at
2290
ft:
MWD
and
LWD
1011
I.
.
*l.
..
.-.--
I..)
Figure
4-301.
Sample
of
MWD/LWD
logs.
R,JR,,
=
1.2/1
=
1.2
RJR,,
=
7/1
=
7
The invasion diameter is
36
in.
where
RxdRt
=
11
R/q,
=
0.98
(text
continued
on
page
1014)
1012
Drilling and Well Completions
s
I€
I
I
Figure
4-302.
Sample
of
MWD/LWD
logs.
MWD
and
LWD
1013
Porosity
and
Lithology
Detmnination
from
Litho-Density*
Log
and
CNL*
Compensated
Neutron
Log
Liquid-Filled
Holes
p,
=
1.ooO
gee,
C,
=
0
ppm
For CNL Curves that have been Environmentally Corrected
1.9
2.0
2.1
2.2
2.3
2.4
2.5
2.6
2.7
2.8
2.9
3.0
0
10
20 30
40
(CNLcor, NEUTRON POROSITY INDEX (pu)
(Apparent Limestone Porosity)
Figure
4-303.
Porosity and lithology determination from the Litho-Density*
logs and the CNL' Compensated neutron log.
(Courtesy
Schlumberger.)
(*trade mark of Schiumberger.)
1014
Drilling and Well Completions
DIL* Dual Induction
-
Laterolog
8
ID-IM-LL8
Thick Beds, 8-in. (203-mm) Hole, Skin-Effect
1-
Corrected, DIS-DB or Equivalent
20
10
9
8
7
06
c
95
a'
4
3
2
1
Figure
4-304.
Resistivities and invasion determination with the Dual Induction
log
(DIL*)
and the laterolog-8.
(Courtesy
Schlumberger.)
(*trade mark
of
Schlum berger.)
(text
continued
from
page
1011)
Consequently:
Rt=0.9SR*mz
1R.m
Rx,
=
11
R
m