Lyons W.C. (ed.). Standard handbook of petroleum and natural gas engineering.2001- Volume 1
Подождите немного. Документ загружается.

MWD and LWD
1075
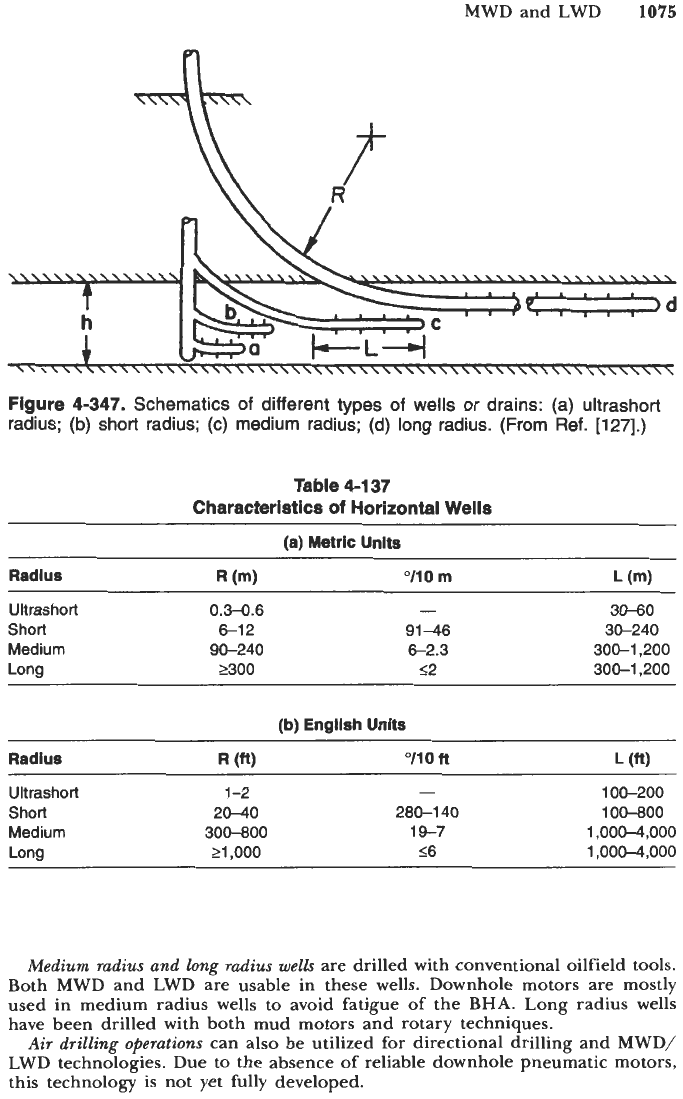
Figure 4-347.
Schematics
of
different types
of
wells or drains: (a) ultrashort
radius; (b) short radius; (c) medium radius;
(d)
long radius. (From Ref.
[127].)
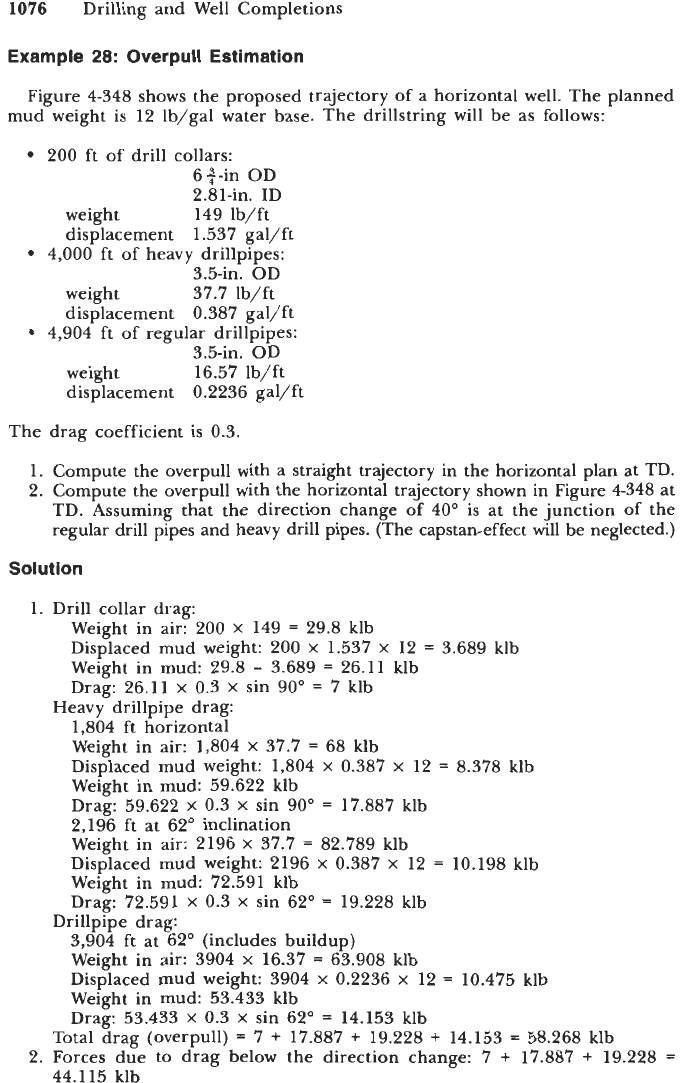
Table
4-1
37
Characteristics of Horizontal
Wells
(a)
Metric Units
Radius
R
(m)
VI0
m
L
(m)
Ultrashort
0.3-0.6
-
30-60
Short
6-1
2 91-46 30-240
Medium
90-240 6-2.3 300-1,200
Long
2300 52 300-1,200
(b)
English Units
Ultrashort
1-2
-
100-200
Short
20-40 280-1 40
100-800
Medium
300-800
1
9-7
1,000-4,000
Long
21,000
16
1,000-4,000
Medium radius and long radius wells
are drilled with conventional oilfield tools.
Both MWD and LWD are usable in these wells. Downhole motors are mostly
used in medium radius wells to avoid fatigue of the BHA. Long radius wells
have been drilled with both mud motors and rotary techniques.
Air drilling operations
can also be utilized for directional drilling and MWD/
LWD technologies. Due to the absence of reliable downhole pneumatic motors,
this technology is not yet fully developed.
1076
Drilling and Well Completions
Example
28:
Overpull Estimation
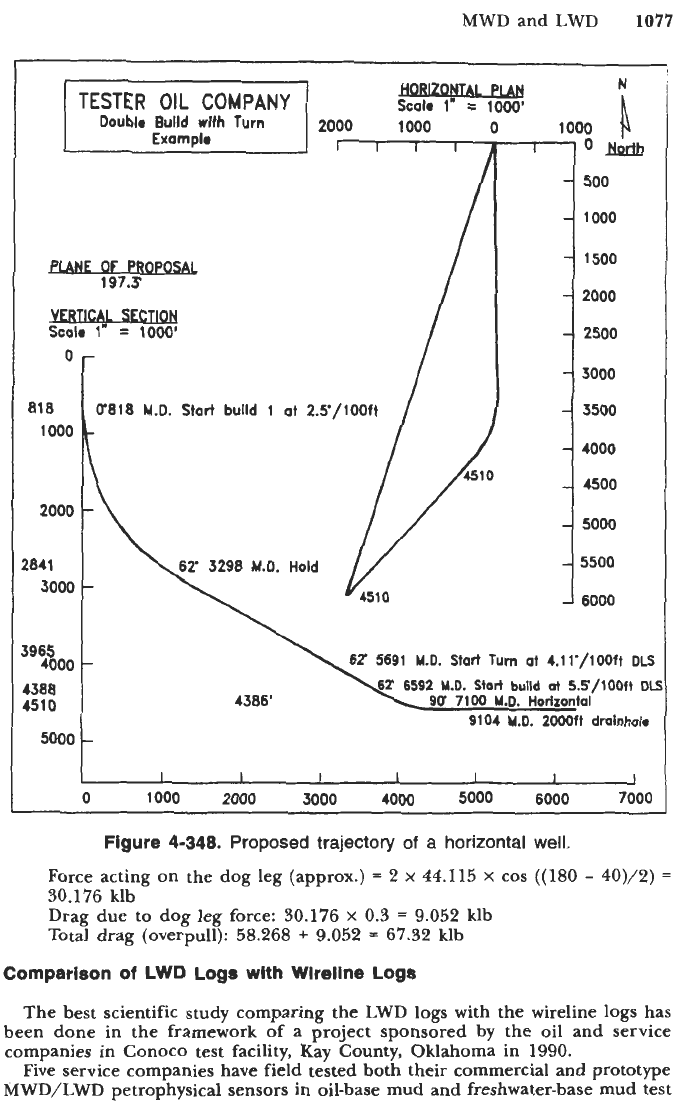
Figure 4-348 shows the proposed trajectory of a horizontal well. The planned
mud weight is 12 lb/gal water base. The drillstring will be as follows:
200
ft of drill collars:
6+-in OD
2.81-in.
ID
weight 149 lb/ft
displacement 1.537 gal/ft
4,000 ft of heavy drillpipes:
3.5-in.
OD
weight 37.7 lb/ft
displacement 0.387 gal/ft
4,904 ft of regular drillpipes:
3.5-in.
OD
weight 16.57 lb/ft
displacement 0.2236 gal/ft
The drag coefficient is 0.3.
1.
Compute the overpull with a straight trajectory in the horizontal plan at TD.
2. Compute the overpull with the horizontal trajectory shown in Figure 4-348 at
TD. Assuming that the direction change of 40" is at the junction
of
the
regular drill pipes and heavy drill pipes. (The capstan-effect will be neglected.)
Solution
1.
Drill collar drag:
Weight in air: 200
x
149
=
29.8 klb
Displaced mud weight: 200
x
1.537
x
12
=
3.689 klb
Weight in mud: 29.8
-
3.689
=
26.11 klb
Drag: 26.11
x
0.3
x
sin 90"
=
7 klb
Heavy drillpipe drag:
1,804 ft horizontal
Weight in air: 1,804
x
37.7
=
68 klb
Displaced mud weight: 1,804
x
0.387
x
12
=
8.378
klb
Weight in mud: 59.622 klb
Drag: 59.622
x
0.3
x
sin 90"
=
17.887 klb
2,196 ft at 62" inclination
Weight in air: 2196
x
37.7
=
82.789 klb
Displaced mud weight: 2196
x
0.387
x
12
=
10.198 klb
Weight in mud: 72.591 klb
Drag: 72.591
x
0.3
x
sin 62"
=
19.228 klb
3,904 ft at 62" (includes buildup)
Weight in air: 3904
x
16.37
=
63.908 klb
Displaced mud weight: 3904
X
0.2236
x
12
=
10.475 klb
Weight in mud: 53.433 klb
Drag: 53.433
x
0.3
x
sin 62"
=
14.153 klb
Drillpipe drag:
Total drag (overpull)
=
7
+
17.887
+
19.228
+
14.153
=
58.268 klb
44.115 klb
2.
Forces due
to
drag below the direction change:
7
+
17.887
+
19.228
=
MWD and LWD
1077
N
b
Scalr
v
1
-
1000'
Double
Bulld
wlth
Turn
2000 1000
0
1000
~
1
Exarnplr
r~
i
i
-
197.5
SECTM
m
=
1000'
0
818
1000
2000
2841
3000
3965
4388
4510
4000
5000
/
1
o&
500
1000
1500
2000
2500
3000
3500
4000
4500
5000
5500
6000
62'
5691
M.D.
Start
Turn
at 4.11'/100ft
DLS
9(r
7100
Y.D.
Horizontal
4386'
9104
M.D.
2000ft
dminhol.
0 1000
2000
3000
4000
5000
6000
7000
Figure
4-348.
Proposed trajectory
of
a
horizontal
well.
Force acting on the dog leg (approx.)
=
2
x
44.115
x
cos ((180
-
40)/2)
=
30.176 klb
Drag due to dog leg force: 30.176
x
0.3
=
9.052 klb
Total drag (overpull): 58.268
+
9.052
=
67.32
klb
Comparison
of
LWD Logs
wlth
Wlrellne Logs
The best scientific study comparing the LWD logs with the wireline logs has
been done in the framework of
a
project sponsored by the
oil
and service
companies in Conoco test facility, Kay County, Oklahoma in 1990.
Five service companies have field tested both their commercial and prototype
MWD/LWD petrophysical sensors in oil-base mud and freshwater-base mud test
1078
Drilling and Well Completions
wells. The data recorded were compared to equivalent wireline measurements. The
effect of the rate of penetration
(ROP)
on some devices was investigated. The water-
base mud well was drilled to
3.035
ft with
7
f-in. bit. The oil-base mud well was
drilled to
2,400
ft with an 8q-in. bit.
Each MWD company ran a full suite of MWD/LWD logs that were compared
to “benchmark” wireline logs obtained by averaging the wireline logs with the
least standard deviation errors. The data have been analyzed in the oil and
service companies
[128]
and at Louisiana State University (LSU) where two
master of science theses were completed utilizing this data
[129,130].
The general
conclusions of the LSU studies are as follows:
Gamma Ray.
A
linear relationship is generally established when comparing LWD
and wireline gamma ray logs. Therefore, the LWD gamma ray data can be used
with confidence as a replacement of wireline gamma ray for formation evalua-
tion. Furthermore, LWD gamma ray logs generally have a better bed resolution
than their wireline equivalent.
Resistivity.
The 2-MHz LWD amplitude and phase-shift resistivity logs match
the wireline deep and medium induction very well. Excellent results are obtained
when the invasion is not severe (less than
40
in. in diameter) and in formations
20
i2.m or less.
The focused resistivity log offered by one of the service companies is very
sensitive to borehole diameter and can be used only in a qualitative manner in
its present form.
Neutron.
The neutron porosity values recorded with most tools match closely
the wireline thermal neutron logs in the lower porosity ranges (under
25
porosity
units). In high porosity zones, the LWD neutron porosities lie between thermal
and epithermal wireline values.
In all zones the discrepancies between LWD and wireline porosity data are
in the range of one to five porosity units. Thus, the LWD neutron data are
suitable for formation evaluation.
Density.
The best data are obtained with stabilizer-type tools. In good borehole
sections, a close match between the LWD data and the wireline data was found.
Discrepancies of less than
0.05
g/cm3 were generally noticed.
Washouts, rugosity, and drillstring wobbling (or vibration) will affect the LWD
density readings. However, the LWD density data are generally suitable for
formation evaluation.
Photoelectric Effect (Pe).
Only one service company was offering a commercial
Pe log. The readings of the LWD tool were very sensitive to washouts. For a
qualitative lithology identification of the strata, the LWD Pe curve is satisfactory.
In conclusion, the logs available now with LWD are perfectly suitable for a
good basic formation evaluation in all types
of
formations. It should be possible
to complete a well successfully with LWD data alone in most instances.
Comparison of MWD Data with Other Drilling Data
Before MWD, most drilling data were recorded at the surface. Mud logging
data, the only downhole data, were available with a time delay corresponding
to the time required by the mud to reach the surface.
Directional Drilling
1079
Drilling surface data such as weight-on-bit and torque were difficult to
interpret because they were loosely related to downhole values. MWD for the
first time in the history of drilling gives values of parameters measured at the
bit or close by. Rock strength, bit wear, drag and friction can be calculated in
real time. Shocks, temperature and pressure can also be measured.
Sophisticated programs and codes are now available to interpret all these data
in real time. The result is a more efficient and safer drilling process.
DIRECTIONAL DRILLING
Glossary
of
Terms Used in Directional Drilling
The glossary of terms used in directional drilling
[131]
has been developed by
the API Subcommittee on Controlled Deviation Drilling under the jurisdiction of
the American Petroleum Institute Production Department's Executive Committee
on Drilling and Production Practice.
The most frequently used terms are listed below.
Angle of buildup
Angle dropoff
Angle of inclination (angle of drift)
Rate of change
('/lo0
ft) of the inclination angle in the
section of the hole where the inclination from the vertical is increasing.
Rate
of
change
(O/lOO
ft) of the inclination angle in the section
of the wellbore that is decreasing toward vertical.
The angle, in degrees, taken at one or at
several points of variation from the vertical as revealed by a deviation survey;
sometimes called the inclination
or
angle of deviation.
The azimuth change through which the drillstring must be
turned to offset the twist caused by the reactive torque of the downhole motor.
Stratified
or
anisotropic formations are assumed
to possess different drillabilities parallel and normal to the bedding planes
with the result that the bit does not drill in the direction of the resultant force.
Direction
of
a course measured in
a
clockwise direction from
0"
to
360"
as North; also bearing.
Angle of twist
Anisotropic formation theory
Azimuth
Back-torque
Bent sub
Torque on a drillstring causing a twisting of the string.
Sub used on top of a downhole motor to give a nonstraight bottom
assembly. One of the connecting threads is machined at an angle to the axis
of the body of the sub.
Big-eyed bit
Bit stabilization
Borehole direction
Borehole directional survey
Refers to the measurements of the inclinations,
azimuths and specified depths of the stations through a section of borehole.
Bottom-hole assembly (BHA)
Assembly composed of the rock bit, stabilizers,
reamers, drill collars, subs, etc., used at the bottom of the drillstring.
Bottomhole location
Position of the bottom of the hole with respect to some
known surface location.
Bottomhole orientation sub (BHO)
A
sub in which a free-floating ball rolls
to the low side and opens a port indicating an orientation position.
Build-and-hold wellbore
A
wellbore configuration where the inclination is
increased to some terminal angle of inclination and maintained at that angle
to the specified target.
That portion
of
the hole
in
which the inclination angle is increased.
Drill bit with one large-sized jet nozzle, used for jet deflection.
Refers to stabilization of the downhole assembly near the bit;
a stabilized bit is forced to rotate around its own axis.
Refers to the azimuth in which the borehole is heading.
Buildup
1080
Drilling and Well Completions
Clearance
Space between the outer diameter
of
the tool in question and the
side of the drilled hole; the difference in the diameter of the hole and
the tool.
Clinograph
Closed traverse
Term used to indicate the closeness of two surveys; one survey
Corrective jetting
runs
Action taken with a directional jet bit to change the
Course
Course bearing
Crooked hole
Wellbore that has been inadvertently deviated from a straight hole.
Crooked-hole area
An area where subsurface formations are
so
composed
or
arranged that
it
is difficult to drill a straight hole.
Cumulative fatigue damage
The total
of
fatigue damage caused by repeated
cyclic stresses.
Deflection tools
Drilling tools and equipment used to change the inclination
and direction of the drilled wellbore.
Departure
Horizontal displacement of one station from another in an east
or
west direction.
Deviation angle
Deviation Control Techniques
An instrument to measure and record inclination.
going in the hole and the second survey coming out of the hole.
direction
or
inclination of the borehole.
The axis of the borehole over an interval length.
The azimuth of the course.
See “Angle of inclination.”
Fulcrum technique
Utilizes a bending movement principle to create a force
on the bit to counteract reaction forces that are tending to push the bit
in a given direction.
Mechanical technique
Utilizes bottomhole equipment which is not normally
a part of the conventional drillstring to aid deviation control. This
equipment acts to force the bit to turn the hole in direction and
inclination.
Utilizes the hole wall to minimize bending of the
bottomhole assembly.
The basic principle involved is gravity
or
the “plumb-
bob effect.”
A service company that supplies the special
deflecting tools, BHA, survey instruments and a technical representative to
perform the directional drilling aspects of the operation.
Packed-hole technique
Pendulum technique
Directional drilling contractor
Direction of inclination
Direction of the course.
Dogleg
Total curvature in the wellbore consisting of a change of inclination
and/or direction between two points.
Dogleg severity
A measure of the amount of change in the inclination and/
or
direction of a borehole; usually expressed in degrees per
100
ft of course
length.
Drift angle
The angle between the
axis
of the wellbore and the vertical (see
“Inclination”).
Drainholes
Several high-angle holes drilled laterally from a single wellbore into
the producing zone.
Drag
The extra force needed to move the drillstring resulting from the
drillstring being in contact with the wall of the hole.
Drop off
The portion of the hole in which the inclination
is
reduced.
Goniometer
An instrument for measuring angles, as in surveying.
Gyroscopic survey
A directional survey conducted using a gyroscope for
directional control, usually used where magnetic directional control cannot
be obtained.
Directional Drilling
1081
Hole curvature
Refers to changes in inclination and direction of the borehole.
Hydraulic orienting sub
Used in directional holes, with inclination greater than
6",
to find the low side of the hole. A ball falls to the low side of the sub
and restricts an orifice, causing an increase in the circulating pressure. The
position of the tool is then known with relation to the low side of the hole.
Hydraulically operated bent sub
A deflection sub that is activated by hydraulic
pressure of the drilling fluid.
Inclination angle
The angle of the wellbore from the vertical.
Inclinometer
An instrument that measures a position angle of deviation from
the vertical.
Jet bit deflection
A method of changing the inclination angle and direction
of the wellbore by using the washing action of a jet nozzle at one side
of
the bit.
Keyseat
A condition wherein the borehole is abraded and extended sideways,
and with a diameter smaller than the drill collars and the bit; usually caused
by the tool joints on the drillpipe.
Kickoff point (kickoff depth)
The position in the wellbore where the inclina-
tion of the hole is first purposely increased
(KOP).
Lead angle
A method of setting the direction of the wellbore in anticipation
of the bit walking.
Magnetic declination
Angular difference, east or west, at any geographical
location, between true north or grid north and magnetic north.
Magnetic survey
A directional survey in which the direction is determined
by
a
magnetic compass deflecting the earth's magnetic field.
Measured depth
Actual length of the wellbore from its surface location to any
specified station.
Mechanical orienting tool
A device to orient deflecting tools without the use
of subsurface surveying instruments.
Methods of orientation
Direct method
Magnets embedded in the nonmagnetic drill collar are
used to indicate the position of the tool face with respect to magnetic
north. A picture of a needle compass pointing
to
the magnets is super-
imposed on the picture of a compass pointing to magnetic north.
By
knowing the position of the magnets in the tool, the tool can be posi-
tioned with respect to north.
A method of orienting deflecting tools in which two
survey runs are needed, one showing the direction of the hole and the
other showing the position of the tool.
A device on the rig floor to indicate the subsurface
position of the tool.
Method of orienting a tool using two pipe clamps, a telescope
with a hair line, and an aligning bar to determine the orientation at each
section of pipe run in the hole.
A permanently nonmagnetic alloy used in making portions
of
downhole tools in the bottomhole assembly (BHA) where the magnetic
survey tools are placed for obtaining magnetic direction information. Monel
refers to a family of nickel-copper alloys.
Usually a positive displacement or turbine-type motor.
A shaped form used on the bottom of orienting tools to position
the tool. The shape resembles a mule shoe or the end
of
a pipe that has been
cut both diagonally and concave. The shaped end forms a wedge to rotate
the tool when lowered into a mating seat for the mule shoe.
Indirect method
Surface readout
Stoking
Monel
(K
monel)
Mud motor
Mule shoe
1082
Drilling and Well Completions
Multishot survey
A directional survey in which multiple data points are
recorded with one trip into the wellbore. Data are usually recorded on rolls
of film.
Near-bit stabilizer
A
stabilizer placed in the bottomhole assembly just above
the bit.
Ouija board@
(registered trademark of Eastern Whipstock) An instrument
composed of two protractors and a straight scale that is used to determine
the positioning for a deflecting tool in an inclined wellbore.
Permissible dogleg
A dogleg through which equipment and/or tubulars can
be operated without failure.
Pendulum effect
Refers to the pull of gravity on a body; tendency of a
pendulum to return to a vertical position.
Pendulum hookup
A bit and drill collar with a stabilizer to attain the maximum
effect of the pendulum.
Rat hole
A hole that is drilled ahead of the main wellbore and which is of a
smaller diameter than the bit in the main borehole.
Reamer
A tool employed to smooth the wall of a wellbore, enlarge the hole,
stabilize the bit and straighten the wellbore where kinks and abrupt doglegs
are encountered.
Rebel tool@
(registered trademark of Eastman Whipstock) A tool designed
to
prevent and correct lateral drift (walk) of the bit tool. It consists of two
paddles on a common shaft that are designed to push the bit in the desired
direction.
Roll off
A correction in the facing of the deflection tool, usually determined
by experience, and which must be taken into consideration to give the proper
facing to the tool.
Setting off course
A method of setting the direction of the wellbore in
anticipation of the bit walking.
Side track
An operation performed to redirect the wellbore by starting a new
hole at a position above the bottom of the original hole.
Slant hole
A nonvertical hole; usually refers to a wellbore purposely inclined
in a specific direction; also used
to
define a wellbore that is nonvertical at
the surface.
Slant rig
Drilling rig specifically designed to drill a wellbore that is nonvertical
at the surface. The mast is slanted and special pipe-handling equipment is needed.
Spiraled wellbore
A
wellbore that has attained a changing configuration such
as a spiral or helical form.
Spud bit
In directional drilling, a special bit used to change the direction and
inclination of the wellbore.
Stabilizer
A
tool placed in the drilling assembly to:
(1)
change
or
maintain the inclination angle in a wellbore by controlling
the location of the contact point between the hole and drill collars;
(2)
center the drill collars near the bit to improve drilling performance;
and/or
(3)
prevent wear and differential sticking of the drill collars.
Surveying frequency
Refers to the number of feet between survey records.
Target area
A defined area, at a prescribed vertical depth, that is planned to
Tool azimuth angle
The angle between north and the projection of the tool
Tool high-side angle
The angle between the tool reference axis and a line
Total curvature
Implies three-dimensional curvature.
be intersected by the wellbore.
reference axis onto a horizontal plane.
perpendicular to the hole axis and lying in the vertical plane.
Directional Drilling
1083
True
north
The direction from any geographical location on the earth’s surface
True vertical depth
(TVD)
The actual vertical depth of an inclined wellbore.
Turbodrill
A
downhole motor that utilizes
a
turbine for power to rotate the hit.
Turn
A
change in bearing of the hole; usually spoken of as the right or left
turn with the orientation that of an observer who views the well course from
the surface site.
Walk
(of
hole) The tendency of a wellbore to deviate in the horizontal plane.
Wellbore survey calculation methods Refers
to
the mathematical methods and
assumptions used in reconstructing the path of the wellbore and in generating
the space curve path of the wellbore from inclination and direction angle
measurements taken along the wellbore. These measurements are obtained
from
gyroscopic
or
magnetic instruments of either the single-shot or multi-
shot type.
Whipstock
A
long wedge and channel-shaped piece of steel with a collar at its
top through which the subs and drillstring may pass. The face of the whipstock
sets an angle to deflect the bit.
Round drill collar with a series
of indentations on one side to form an eccentrically weighted collar.
to the north geometric pole.
Woodpecker drill collar (indented drill collar)
Dogleg Severity (Hole Curvature) Calculations
Currently there are several analytical methods available for calculating dog-
These methods include:
leg severity.
tangential
radius
of
curvature
average angle
trapezoidal (average tangential)
minimum curvature
Here the tangential and radius of curvature methods are outlined.
Tangential Method
[171]
The overall angle change is calculated from
+
sin
sin
V,
sin
VI
2
(4-263)
where Aa
=
overall angle change
Ah
=
change
of
horizontal angle (in horizontal plane)
Av
=
change of vertical angle (in vertical plane)
V,, VI
=
hole inclination angle in two successive surveying stations
The hole curvature is
(4-264)
where
L
=
course length between the surveying stations
1084
Drilling and Well Completions
Example
1
below:
Station 1:
Two surveying measurements were taken 30
ft
apart. The readings are as
Hole inclination, 3'30
'
Hole direction, N11"E
Hole inclination, 4'30
'
Hole direction, N23"E
Find the dogleg severity.
Solution
Station 2:
Change in horizontal angle is
Ah
=
23
-
11
=
12"
Change in vertical angle is
AV
=
4.5
-
3.5
=
1"
The overall angle change is
Aa
=
2 arc sin[sin2(0.5)
=
sin2(6) sin(3.5) ~in(4.5)]~.~
=
1.3"
Hole curvature is
1.3
30
C
=
-100
=
4.33"/1OOft
s
4"20'/1OOft
Radius of Curvature Method
[133]
The dogleg severity is calculated from:
C
=
100[a2 sin4$
+
b2]o.5
(4-265)
where a
=
rate of change in direction angle in '/ft
b
=
rate of change in inclination angle in "/ft
I+
=
inclination angle in
"
The sequence of computations involved is explained in the following example.
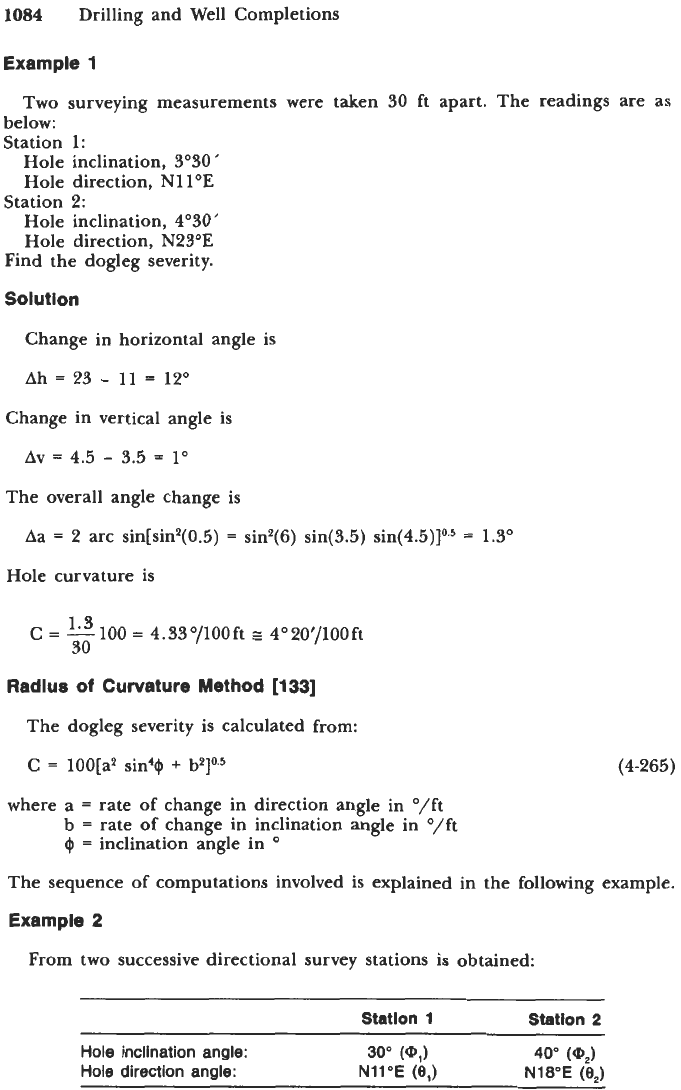
Example
2
From two successive directional survey stations is obtained:
Station
1
Station
2
Hole inclination angle:
30"
(@,I
40"
(@,)
Hole direction angle:
N11"E
(e,)
NWE
(e,)