McConnell Campbell R., Brue Stanley L., Barbiero Thomas P. Microeconomics. Ninth Edition
Подождите немного. Документ загружается.


activity, say, innovation, as exceeding the marginal cost should expand that activity.
In contrast, an activity whose marginal benefit promises to be less than its marginal
cost should be cut back. But the R&D spending decision is complex, since it involves
a present sacrifice for a future expected gain. While the cost of R&D is immediate,
the expected benefits occur at some future time and are highly uncertain, so esti-
mating those benefits is often more art then science. Nevertheless, the MB = MC way
of thinking remains relevant for analyzing R&D decisions.
Interest-Rate Cost of Funds
Firms have several ways of obtaining the funds they need to finance R&D activities:
● Bank loans Some firms are able to obtain a loan from a bank or other finan-
cial institution. The cost of using the funds is the interest paid to the lender.
The marginal cost is the cost per extra dollar borrowed, which is simply the
market interest rate for borrowed funds.
● Bonds Established, profitable firms may be able to borrow funds for R&D by
issuing bonds and selling them in the bond market. In this case, the cost is the
interest paid to the lenders—the bondholders. Again, the marginal cost of
using the funds is the interest rate.
● Retained earnings A large, well-established firm may be able to draw on its
own corporate savings to finance R&D. Typically, such a firm retains part of its
profit rather than paying it all out as dividends to corporate owners. Some of
the undistributed corporate profit, called retained earnings, can be used to
finance R&D activity. The marginal cost is the rate at which those funds could
have earned interest as deposits in a financial institution.
● Venture capital A smaller start-up firm might be able to attract venture cap-
ital to finance its R&D projects. Venture capital is financial capital, or simply
money, not real capital. Venture capital consists of that part of household sav-
ing used to finance high-risk business ventures in exchange for shares of the
profit if the ventures succeed. The marginal cost of venture capital is the share
of expected profit that the firm will have to pay to those who provided the
money. This share can be stated as a percentage of the venture capital, so it is
essentially an interest rate.
● Personal savings Finally, individual entrepreneurs might draw on their own
savings to finance the R&D for a new venture. The marginal cost of the financ-
ing is the forgone interest rate.
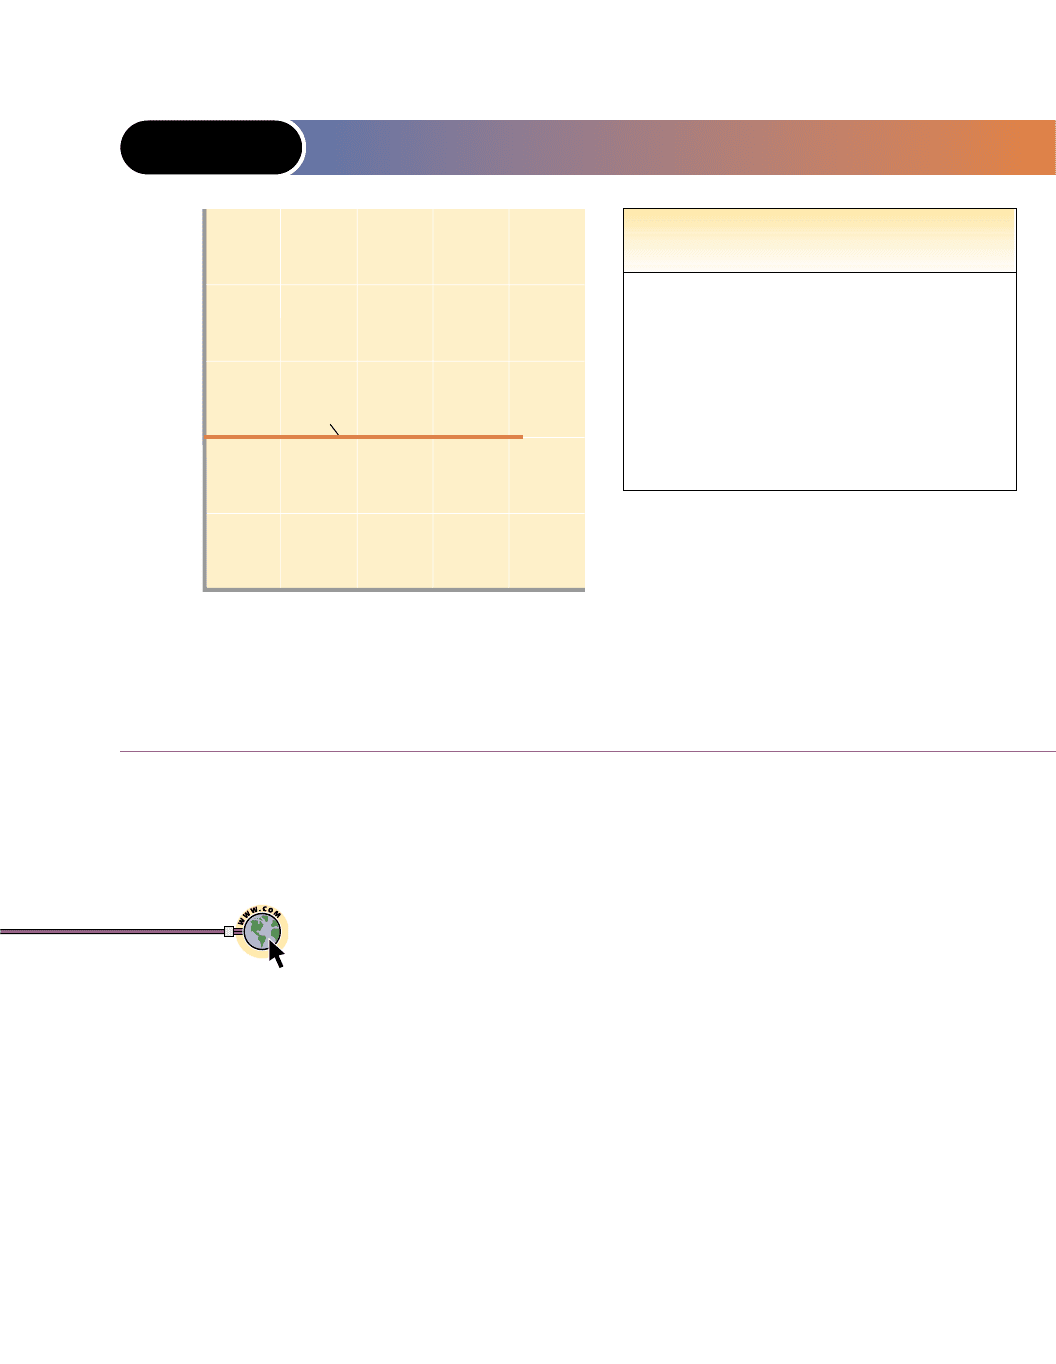
Thus, whatever the source of the R&D funds, we can state the marginal cost of these
funds as an interest rate, i. For simplicity, let’s assume that this interest rate is the
same no matter how much financing is required. Further, we assume that a certain
firm called MedTech must pay an interest rate of 8 percent, the least expensive fund-
ing available to it. Then a graph of the marginal cost of each funding amount for this
firm is a horizontal line at the 8 percent interest rate, as shown in Figure 12-1. Such
a graph is called an interest-rate cost-of-funds curve. This one tells us that MedTech
can borrow $10, $10,000, $10,000,000 or more at the 8 percent interest rate. The table
accompanying the graph contains the data used to construct the graph and tells us
much the same thing.
With these data in hand, MedTech wants to determine how much R&D to finance
in the coming year.
310 Part Two • Microeconomics of Product Markets
venture
capital
Finan-
cial capital lent in
return for a share
in the business.
interest-
rate cost-
of-funds
curve
A graph
showing the inter-
est rate a firm must
pay to obtain funds
to finance R&D.
Expected Rate of Return
A firm’s marginal benefit from R&D is its expected profit (or return) from the last
(marginal) dollar spent on R&D. That is, the R&D is expected to result in a new
product or production method that will increase revenue, reduce production costs,
or both (in ways we will soon explain). This return is expected but not certain—
there is risk in R&D decisions. Let’s suppose that after considering such risks,
MedTech anticipates that an R&D expenditure of $1 million will result in a new
product that will yield a one-time added profit of $1.2 million a year later. The
expected rate of return, r, on the $1 million R&D expenditure (after the $1 million
has been repaid) is 20 percent (= $200,000/ $1,000,000). This is the marginal benefit
of the first $1 million of R&D. (Stretching the return over several years complicates
the computation of r, but it does not alter the basic analysis.)
MedTech can use this same method to estimate the expected rates of return for
R&D expenditures of $2 million, $3 million, $4 million, and so on. Suppose those
marginal rates of return are the ones indicated in the table in Figure 12-2, where they
are also graphed as the expected-rate-of-return curve. This curve shows the
expected rate of return, which is the marginal benefit, of each dollar of expenditure
on R&D. The curve slopes downward because of diminishing returns to R&D
expenditures. A firm will direct its initial R&D expenditures to the highest expected-
rate-of-return activities and then use additional funding for activities with succes-
sively lower expected rates of return. That is, as the firm increases R&D spending,
it uses it to finance R&D activities with progressively lower expected rates of return.
chapter twelve • technology, r&d, and efficiency 311
FIGURE 12-1 THE INTEREST-RATE COST-OF-FUNDS SCHEDULE
AND CURVE
12
16
20
8
4
0 20 40 60 80 100
Research and development expenditures
(millions of dollars)
Interest rate,
i
(percent)
Interest-rate cost-of-funds
curve
Interest-rate cost of funds, %
8
$10
R&D,
millions
8
20
8
30
8
40
8
50
8
8
8
60
70
80
i
As it relates to R&D, a firm’s interest-rate cost-of-funds schedule (the table) and curve (the graph) show the interest rate the
firm must pay to obtain any particular amount of funds to finance R&D. Curve i indicates that the firm can finance as little or
as much R&D as it wants at a constant 8 percent rate of interest.
<www.bothell.
washington.edu/
faculty/danby/bls324/
surplus.html>
Demand, supply, and
surpluses
expected-
rate-of-
return
curve
The
increase in profit a
firm anticipates it
will obtain by
investing in R&D.

Optimal R&D Expenditures
Figure 12-3 combines the interest-rate-cost-of-funds curve (Figure 12-1) and the
expected-rate-of-return curve (Figure 12-2). The curves intersect at MedTech’s opti-
mal amount of R&D, which is $60 million. This amount can also be determined from
the table as the amount of funding for which the expected rate of return and the
interest cost of borrowing are equal (here, 8 percent). Both the curve and the table tell
us that at $60 million of R&D expenditures, the marginal benefit and marginal cost
of the last dollar spent on R&D are equal. This firm should undertake all R&D
expenditures up to $60 million, since those outlays yield a higher marginal benefit or
expected rate of return, r, than the 8 percent marginal cost or interest-rate cost of bor-
rowing, i. But MedTech should not undertake R&D expenditures beyond $60 million;
for these outlays, r (marginal benefit) is less than i (marginal cost). Only at $60 mil-
lion do we have r = i, telling us that MedTech will spend $60 million on R&D.
Our analysis reinforces two important points:
1. Optimal versus affordable R&D From earlier discussions we know there can
be too much, as well as too little, of a good thing. So it is with R&D and techno-
logical advance. Figure 12-3 shows that R&D expenditures make sense to a firm
only as long as the expected return from the outlay equals or exceeds the cost of
obtaining the funds needed to finance it. Many R&D expenditures may be
affordable but not worthwhile, because their marginal benefit is likely to be less
than their marginal cost.
312 Part Two • Microeconomics of Product Markets
FIGURE 12-2 THE EXPECTED-RATE-OF-RETURN SCHEDULE
AND CURVE
12
16
20
8
4
0 20 40 60 80 100
r
Research and development expenditures
(millions of dollars)
Expected rate of return,
r
(percent)
Expected-rate-of-
return curve
Expected rate of return, %
18
$10
R&D,
millions
16
20
14
30
12
40
10
50
8
6
4
60
70
80
As they relate to R&D, a firm’s expected-rate-of-return schedule (the table) and curve (the graph) show the firm’s expected
gain in profit, as a percentage of R&D spending, for each level of R&D spending. Curve r slopes downward because the firm
assesses its potential R&D projects in descending order of expected rates of return.
optimal
amount of
r&d
The amount
of funding for which
the expected rate of
return and the inter-
est cost of borrow-
ing are equal.

2. Expected, not guaranteed, returns The outcomes from R&D are expected, not
guaranteed. With 20/20 hindsight, a firm can always look back and decide
whether a particular expenditure for R&D was worthwhile, but that assessment
is irrelevant to the original decision. At the time of the decision, the expenditure
was thought to be worthwhile, based on existing information and expectations.
Some R&D decisions may be more like an informed gamble than the typical busi-
ness decision. Invention and innovation, in particular, carry with them a great
deal of risk. For every successful outcome, there are scores of costly disappoint-
ments. (Key Questions 4 and 5)
In discussing how a firm determines its optimal amount of R&D spending, we side-
stepped the question of how technological change can increase a firm’s profit.
Although the answer may seem obvious—by increasing revenue or reducing pro-
duction costs—insights can be gained by exploring these two potential outcomes in
some detail.
Increased Revenue via Product Innovation
Firms here and abroad have profitably introduced hundreds of new products in the
past two or three decades. Examples include inline skates, microwave popcorn,
cordless drills, digital cameras, camcorders, and projection TVs. Other new products
chapter twelve • technology, r&d, and efficiency 313
FIGURE 12-3 A FIRM’S OPTIMAL LEVEL OF R&D EXPENDITURES
12
16
20
8
4
0 20 40 60 80 100
r
i
Research and development expenditures
(millions of dollars)
Expected rate of return,
r, and
interest rate,
i
(percent)
Interest-rate cost
of funds, %
8
$10
R&D,
millions
8
20
8
30
8
40
8
50
8
8
8
60
70
80
18
16
Expected
rate of return, %
14
12
10
8
6
4
r
=
i
The firm’s optimal level of R&D expenditures ($60 million) occurs where its expected rate of return equals the interest-rate
cost of funds, as shown in both the table and the graph. At $60 million of R&D spending, the firm has taken advantage of all
R&D opportunities for which the expected rate of return, r, exceeds or equals the 8 percent interest cost of borrowing, i.
Increased Profit via Innovation

are snowboards, cellular phones, telephone pagers, and automobile air bags. All
these items reflect technological advance in the form of product innovation.
How do such new products gain consumer acceptance? As you know from Chap-
ter 7, to maximize their satisfaction, consumers purchase products that have the
highest marginal utility per dollar. They determine which products to buy in view
of their limited money income by comparing the ratios of MU/price for the various
goods. They first select the unit of the good with the highest MU/price ratio, then
the one with the next highest, and so on, until their income is used up.
The first five columns of Table 12-1 repeat some of the information in Table 7-1.
Before the introduction of new product C, the consumer maximized total utility
from $10 of income by buying two units of A at $1 per unit and four units of B at $2
per unit. The total $10 budget was thus expended, with $2 spent on A and $8 on B.
As shown in columns 2(b) and 3(b), the marginal utility per dollar spent on the last
unit of each product was 8 (= 8/$1 = 16/$2). The total utility, derived from columns
2(a) and 3(a), was 96 utils (= 10 + 8 from the first 2 units of A plus 24 + 20 + 18 + 16
from the first 4 units of B). (If you are uncertain about this outcome, please review
the discussion of Table 7-1.)
Now suppose an innovative firm offers new product C (columns 4(a) and 4(b) in
Table 12-1), priced at $4 per unit. Note that the first unit of C has a higher marginal
utility per dollar (13) than any unit of A and B and that the second unit of C and the
first unit of B have equal MU/price ratios of 12. To maximize satisfaction, the con-
sumer now buys two units of C at $4 per unit, one unit of B at $2 per unit, and zero
units of A. Our consumer has spent the entire $10 of income ($8 on C and $2 on B),
and the MU/price ratios of the last units of B and C are equal at 12. But as deter-
mined via columns 3(a) and 4(a), the consumer’s total utility is now 124 utils (= 24
from the first unit of B plus 52 + 48 from the first 2 units of C). Total utility has
increased by 28 utils (= 124 utils – 96 utils) and that is why product C was pur-
chased. Consumers will buy a new product only if it increases the total utility they obtain
from their limited income.
314 Part Two • Microeconomics of Product Markets
TABLE 12-1 UTILITY MAXIMIZATION WITH THE INTRODUCTION
OF A NEW PRODUCT (INCOME = $10)*
(1) (2) (3) (4)
Unit of Product A: price = $1 Product B: price = $2 New product C: price = $4
product
(a) (b) (a) (b) (a) (b)
Marginal Marginal Marginal Marginal Marginal Marginal
utility, utils utility utility, utils utility utility, utils utility
per dollar per dollar per dollar
(MU/price) (MU/price) (MU/price)
First 10 10 24 12 52 13
Second 8 8 20 10 48 12
Third 7 7 18 9 44 11
Fourth 6 6 16 8 36 9
Fifth 5 5 12 6 32 8
*It is assumed in this table that the amount of marginal utility received from additional units of each of the three products is inde-
pendent of the quantity purchased of the other products. For example, the marginal utility schedule for product C is independent
of the amount of A and B purchased by the consumer.

From the innovating firm’s perspective, these dollar votes represent new-product
demand that yields increased revenue. When per-unit revenue exceeds per-unit
cost, the product innovation creates per-unit profit. Total profit rises by the per-unit
profit multiplied by the number of units sold. As a percentage of the original R&D
expenditure, the rise in total profit is the return on that R&D expenditure. It was the
basis for the expected-rate-of-return curve r in Figure 12-2.
Several other related points are worth noting:
● Importance of price Consumer acceptance of a new product depends on both
its marginal utility and its price. (Confirm that the consumer represented in
Table 12-1 would buy zero units of new product C if its price were $8 rather
than $4.) To be successful, a new product must not only deliver utility to con-
sumers but do so at an acceptable price.
● Unsuccessful new products For every successful new product, hundreds do
not succeed; the expected return that motivates product innovation is not
always realized. Examples of colossal product flops are Ford’s Edsel automo-
bile, 3-D movies, quadraphonic stereo, New Coke by Coca-Cola, Kodak disc
cameras, and McDonald’s McLean burger. Less dramatic failures include the
hundreds of dot.com firms that have recently failed. In each case, millions of
dollars of R&D and promotion expense ultimately resulted in loss, not profit.
● Product improvements Most product innovation consists of incremental
improvements to existing products rather than radical inventions, such as
more fuel-efficient automobile engines, new varieties of pizza, lighter-weight
shafts for golf clubs, more flavourful bubble-gum, rock shocks for mountain
bikes, and clothing made of wrinkle-free fabrics. (Key Question 6)
Reduced Cost via Process Innovation
The introduction of better methods of producing products—process innovation—is
also a path toward enhanced profit and a positive return on R&D expenditures. Sup-
pose a firm introduces a new and better production process, say, assembling its
product by teams rather than by a standard assembly line. Alternatively, suppose
this firm replaces old equipment with more productive equipment embodying tech-
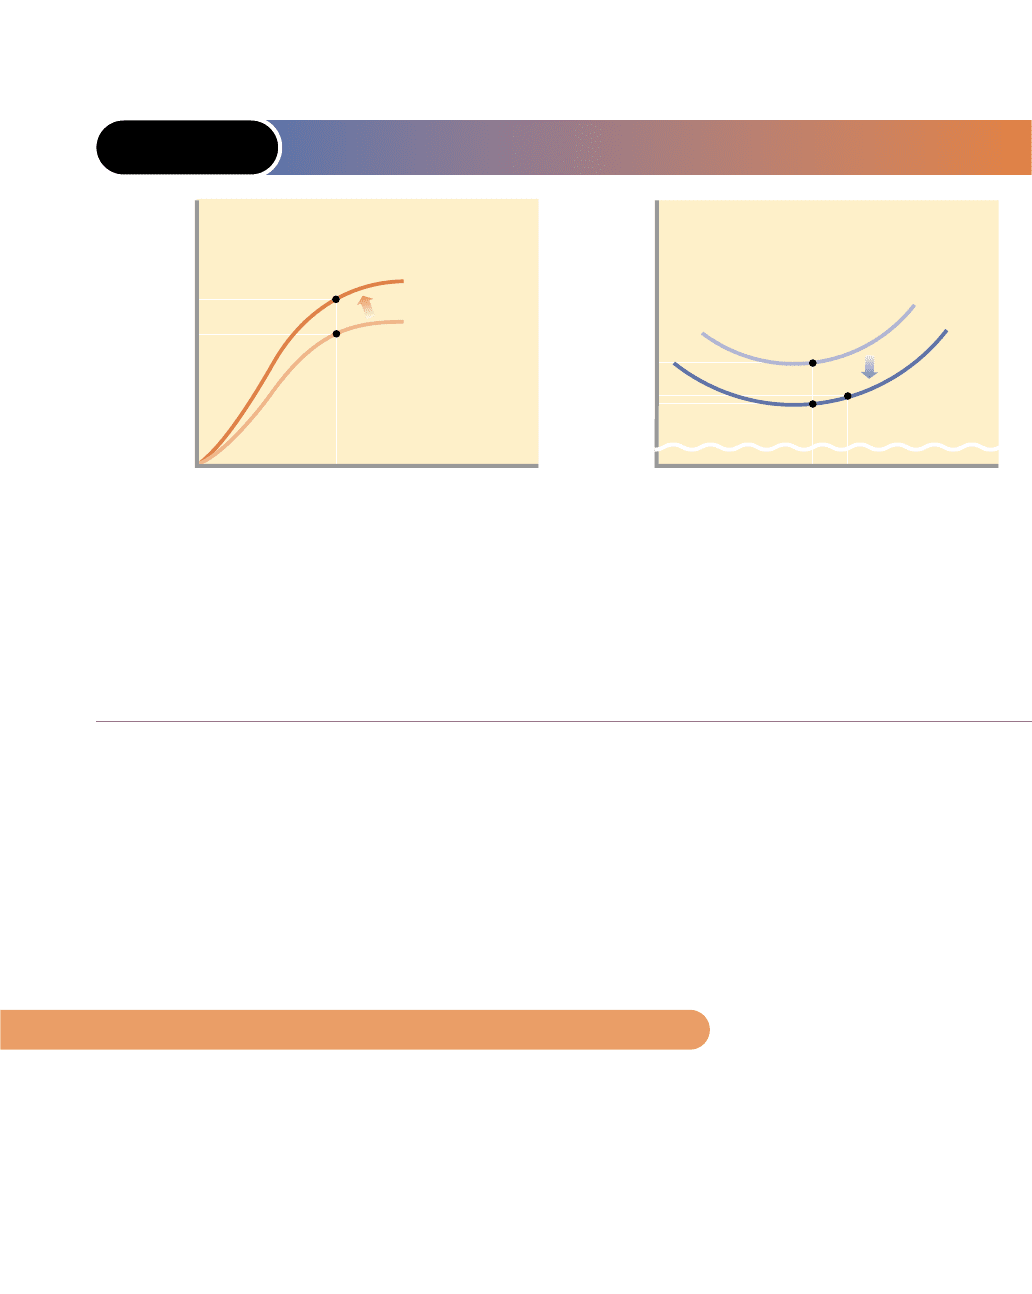
nological advance. In either case, the innovation yields an upward shift in the firm’s
total-product curve from TP
1
to TP
2
in Figure 12-4(a). Now more units of output can
be produced at each level of resource usage. Note from the figure, for example, that
this firm can now produce 2500 units of output, rather than 2000 units, when using
1000 units of labour. So its average product has increased from 2 (= 2000 units of
output ÷ 1000 units of labour) to 2.5 (= 2500 units of output ÷ 1000 units of labour).
The result is a downward shift in the firm’s average-total-cost curve, from ATC
1
to ATC
2
in Figure 12-4(b). To understand why, let’s assume this firm pays $1000 for
the use of its capital and $9 for each unit of labour. Since it uses 1000 units of labour,
its labour cost is $9000 (= $9 × 1000); its capital cost is $1000; and thus its total cost
is $10,000. When its output increases from 2000 to 2500 units as a result of the
process innovation, its total cost remains $10,000, and its average total cost declines
from $5 (= $10,000/2000) to $4 (= $10,000/2500). Alternatively, the firm could pro-
duce the original 2000 units of output with fewer units of labour at an even lower
average total cost.
This reduction in average total cost enhances the firm’s profit. As a percentage
of the R&D expenditure that fostered it, this extra profit is the expected return r,
the basis for the rate-of-return-curve in Figure 12-2. In this case, the expected
chapter twelve • technology, r&d, and efficiency 315
rate of return arose from the prospect of lower production costs through process
innovation.
Consider this example: Computer-based inventory control systems, such as those
pioneered by Wal-Mart, enabled innovators to reduce the number of people keep-
ing track of inventories and placing reorders of sold goods. They also enabled firms
to keep goods arriving just in time, reducing the cost of storing inventories. The con-
sequence? Significant increases in sales per worker, declines in average total cost,
and increased profit. (Key Question 8)
Our analysis of product and process innovation explains how technological advance
enhances a firm’s profit, but it also hints at a potential imitation problem: a firm’s
rivals may be able to imitate the new product or process, greatly reducing the orig-
inator’s profit from its R&D effort. As just one example, in the 1980s North Ameri-
can auto firms took apart Japanese Honda Accords, piece by piece, to discover the
secrets of their high quality. This reverse engineering—which ironically was per-
fected earlier by the Japanese—helped the U.S. firms to incorporate innovative fea-
tures into their own cars. This type of imitation is perfectly legitimate and fully
anticipated; it is often the main path to widespread diffusion of an innovation.
In fact, a dominant firm that is making large profits from its existing products
may let smaller firms in the industry incur the high costs of product innovation
while it closely monitors their successes and failures. The dominant firm then
316 Part Two • Microeconomics of Product Markets
FIGURE 12-4 PROCESS INNOVATION, TOTAL PRODUCT, AND
AVERAGE TOTAL COST
(a) Upward shift of the total-product curve
(b) Downward shift of the average-total-
cost curve
2500
2000
1000
Total product
$5
4
Average total cost
Units of labour
2000 2500
Units of output
0
0
TP
2
TP
1
ATC
1
ATC
2
Panel (a): Process innovation shifts a firm’s total-product curve upward from TP
1
to TP
2
, meaning that with a given amount of
capital, the firm can produce more output at each level of labour input. As shown, with 1000 units of labour it can produce
2500 rather than 2000 units of output. Panel (b): The upward shift in the total-product curve results in a downward shift in the
firm’s average-total-cost curve, from ATC
1
to ATC
2
. This shift means the firm can produce any particular unit of output at a
lower average total cost than it could previously. For example, the original 2000 units can be produced at less than $4 per unit,
versus $5 per unit originally. Or 2500 units can now be produced at $4 per unit.
Imitation and R&D Incentives
imitation
problem
A
firm’s rivals may be
able to imitate the
new product or
process, greatly
reducing the origi-
nator’s profit from
its R&D effort.

moves quickly to imitate any successful new product; its goal is to become the
second firm to embrace the innovation. In using this so-called fast-second strategy,
the dominant firm counts on its own product-improvement abilities, marketing
prowess, or economies of scale to prevail.
Benefits of Being First
Imitation and the fast-second strategy raise an important question: What incentive
is there for any firm to bear the expenses and risks of innovation if competitors can
imitate their new or improved product? Why not let others bear the costs and risks
of product development and then just imitate the successful innovations? Although
we have seen that this may be a plausible strategy in some situations, there are sev-
eral protections for, and potential advantages to, taking the lead.
PATENTS
Some technological breakthroughs, specifically inventions, can be patented. Once
patented, they cannot be legally imitated for almost two decades. The purpose of
patents is, in fact, to reduce imitation and its negative effect on the incentive for
engaging in R&D. For example, Polaroid’s patent of its instant camera enabled it to
earn high economic profits for many years. When Kodak cloned the camera,
Polaroid won a patent-infringement lawsuit against its rival. Kodak not only had to
stop producing its version of the camera but had to buy back the Kodak instant cam-
eras it had sold and pay millions of dollars in damages to Polaroid.
COPYRIGHTS AND TRADEMARKS
Copyrights protect publishers of books, computer software, movies, videos, and
musical compositions from having their works copied. Trademarks give the original
innovators of products the exclusive right to use a particular product name (M&Ms,
Barbie Doll, Wheaties). By reducing the problem of direct copying, these legal pro-
tections increase the incentive for product innovation. They have been strengthened
worldwide through recent international trade agreements.
BRAND-NAME RECOGNITION
Along with trademark protection, brand-name recognition may give the original
innovator a major marketing advantage for years or even decades. Consumers
often identify a new product with the firm that first introduced and popularized it
in the mass market. Examples: Levi’s blue jeans, Kleenex’s soft tissues, Johnson and
Johnson’s Band-Aids, Sony’s Walkman, and Kellogg’s Corn Flakes.
TRADE SECRETS AND LEARNING BY DOING
Some innovations involve trade secrets, without which competitors cannot imitate
the product or process. For example, Coca-Cola has successfully kept its formula for
Coke a secret from potential rivals. Many other firms have perfected special pro-
duction techniques known only to them. In a related advantage, a firm’s head-start
with a new product often allows it to achieve substantial cost reductions through
learning by doing. The innovator’s lower cost may enable it to continue to profit
even after imitators have entered the market.
TIME LAGS
Time lags between innovation and diffusion often enable innovating firms to real-
ize a substantial economic profit. It takes time for an imitator to gain knowledge of
chapter twelve • technology, r&d, and efficiency 317
fast-second
strategy
The
strategy of becom-
ing the second firm
to embrace an inno-
vation, allowing the
originator to incur
the initial high costs
of innovation.

the properties of a new innovation. And once it has that knowledge, the imitator
must design a substitute product, gear up a factory for its production, and conduct
a marketing campaign. Various entry barriers such as large financial requirements,
economies of scale, and price-cutting may extend the time lag between innovation
and imitation. In practice, it may take years or even decades before rival firms can
successfully imitate a profitable new product and cut into the market share of the
innovator. In the meantime, the innovator continues to profit.
PROFITABLE BUYOUTS
A final advantage of being first arises from the possibility of a buyout (outright pur-
chase) of the innovating firm by a larger firm. Here, the innovative entrepreneurs
take their rewards immediately, as cash or as shares in the purchasing firm, rather
than waiting for perhaps uncertain long-run profits from their own production and
marketing efforts.
In short, despite the imitation problem, there are significant protections and
advantages that enable most innovating firms to profit from their R&D efforts, as
implied by the continuing high levels of R&D spending by firms year after year. As
shown in Figure 12-5, business R&D spending in Canada not only remains sub-
stantial but has grown over the past quarter-century. The high levels of spending
simply would not continue if imitation consistently and severely depressed rates of
return on R&D expenditures.
318 Part Two • Microeconomics of Product Markets
● A firm’s optimal R&D expenditure is the amount
at which the expected rate of return (marginal
benefit) from the R&D expenditure just equals
the interest-rate cost of borrowing (marginal
cost) required to finance it.
FIGURE 12-5 THE GROWTH OF BUSINESS R&D EXPENDITURES
IN CANADA, 1981–1998
Industrial R&D expenditures in Canada
(billions of 1990 dollars)
4
6
8
10
12
14
1998199619931990198719841981
Inflation-adjusted
R&D expenditures by
firms are substantial
and growing, sug-
gesting that R&D
continues to be
profitable for firms,
even in the face of
possible imitation.
Source: National Science Foundation. <www.nsf.gov>.

In view of our discussion of market structures in the past three chapters, it is logi-
cal to ask whether some particular market structure or firm size is best suited to
technological progress. Is a highly competitive industry comprising thousands of
relatively small firms preferable to an industry comprising only two or three large
firms? Or is some intermediate structure best?
Market Structure and Technological Advance
As a first step toward answering these questions, we survey the strengths and short-
comings of our four market models as related to technological advance.
PURE COMPETITION
Does a pure competitor have a strong incentive and strong ability to undertake
R&D? On the positive side, strong competition provides a reason for these firms
to innovate; competitive firms tend to be less complacent than monopolists. If a
pure competitor does not seize the initiative, one or more rivals may introduce
a new product or cost-reducing production technique that could drive the firm
from the market. As a matter of short-term profit and long-term survival, the pure
competitor is under continual pressure to improve products and lower costs
through innovation. Also, where there are many competing firms, there is less
chance that an idea for improving a product or process will be overlooked by a
single firm.
On the negative side, the expected rate of return on R&D may be low or even neg-
ative for a pure competitor. Because of easy entry, its profit rewards from innova-
tion may quickly be competed away by existing or entering firms that also produce
the new product or adopt the new technology. Also, the small size of competitive
firms and the fact that they earn only a normal profit in the long run leads to seri-
ous questions about whether they can finance substantial R&D programs. Observers
have noted that the high rate of technological advance in the purely competitive
agricultural industry, for example, has come not from the R&D of individual farm-
ers but from government-sponsored research and from the development of fertiliz-
ers, hybrid seed, and farm implements by oligopolistic-firms.
MONOPOLISTIC COMPETITION
Like pure competitors, monopolistic competitors cannot afford to be complacent.
But unlike pure competitors, which sell standardized products, monopolistic com-
petitors have a strong profit incentive to engage in product development. This
incentive to differentiate their products from those of competitors stems from the
fact that sufficiently novel products may create monopoly power and thus economic
chapter twelve • technology, r&d, and efficiency 319
Role of Market Structure
● Product innovation can entice consumers to sub-
stitute a new product for existing products to
increase their total utility, thereby increasing
the innovating firm’s revenue and profit.
● Process innovation can lower a firm’s produc-
tion costs and increase its profit by increasing
total product and decreasing average total cost.
● A firm faces reduced profitability from R&D if
competitors can successfully imitate its new
product or process. Nevertheless, being first has
significant potential protections and benefits,
including patents, copyrights, and trademarks;
brand-name recognition, trade secrets, and cost
reductions from learning by doing; and major
time lags between innovation and imitation.