Omran M.G.H. Particle Swarm Optimization Methods for Pattern Recognition and Image Processing
Подождите немного. Документ загружается.


180
1. Initialize each particle by randomly choosing
K color triplets from the image
2. For
t = 1 to t
max
(a) For each particle
i
i. Apply K-means for a few iterations with a probability
p
kmeans
.
ii. For each pixel
z
p
• Calculate
)(
2
ki,p
d mz −
for all clusters
ki,
C
• Assign z
p
to
kki,
C where
{
}
)()(
2
1
2
ki,p
K,,k
kki,p
d
min
d mzmz −=−
=∀ K
iii. Calculate the fitness, )(
i
f x
(b) Find the personal best position for each particle and the global best
solution,
)(
ˆ
ty
(c) Update the centroids using equations (2.8) and (2.10)
Figure 7.1: The PSO-CIQ algorithm
In general, the complexity of the PSO-CIQ algorithm is O(
sKt
max
N
p
). The parameters
s, K and t
max
can be fixed in advance. Typically s, K and t
max
<< N
p
. Therefore, the
time complexity of PSO-CIQ is O(
N
p
). Hence, in general the algorithm has linear time
complexity in the size of a data set.

181
7.1.2 Experimental Results
The PSO-CIQ algorithm was applied to a set of four commonly used color images
namely:
Lenna, mandrill, jet and peppers (shown in Figures 7.1(a), 7.2(a), 7.3(a) and
7.4(a), respectively). The size of each image is 512
× 512 pixels. All images are
quantized to 16, 32 and 64 colors.
The rest of this section is organized as follows: Section 7.1.2.1 illustrates that
the PSO-CIQ can be used successfully as a color image quantization algorithm by
comparing it to other well-known color image quantization approaches. Section
7.1.2.2 investigates the influence of the different PSO-CIQ control parameters.
Finally, the use of different PSO models (namely,
gbest, lbest and lbest-to-gbest) are
investigated in section 7.1.2.3.
The results reported in this section are averages and standard deviations over
10 simulations. Since
lbest-to-gbest PSO was generally the best performer in chapter
4,
lbest-to-gbest PSO is used in this section unless otherwise specified. The PSO-CIQ
parameters were initially set as follows:
p
kmeans
= 0.1, s = 20, t
max
= 50, number of K-
means iterations is 10 (the effect of these values are then investigated),
w =0.72,
1
c =
2
c = 1.49 and V
max
= 255 for all the test images. These parameters were used in this
section unless otherwise specified. For the GCMA [Scheunders, A Genetic
1997] a
population of 20 chromosomes was used, and evolution continued for 50 generations.
For the SOM, a Kohonen network of 4×4 nodes was used when quantizing an image
to 16 colors, a Kohonen network of 8×4 nodes was used when quantizing an image to
32 colors, and a Kohonen network of 8×8 nodes was used when quantizing an image
to 64 colors. All SOM parameters were set as in Pandya and Macy [1996]: the
learning rate
)(t
η
was initially set to 0.9 then decreased by 0.005 until it reached

182
0.005, the neighborhood function )(
t
w
∆
was initially set to (4+4)/4 for 16 colors,
(8+4)/4 for 32 colors, and (8+8)/4 for 64 colors. The neighborhood function is then
decreased by 1 until it reached zero.
7.1.2.1 PSO-CIQ vs. Well-Known Color Image Quantization
Algorithms
This section presents results to compare the performance of the PSO-CIQ algorithm
with that of SOM and GCMA (both discussed in section 3.3.2) for each of the test
images.
Table 7.1 summarizes the results for the four images. The results of the
GCMA represent the best case over several runs and are copied from Scheunders [A
Genetic 1997]. The results are compared based on the MSE measure (defined in
equation 7.1). The results showed that, in general, PSO-CIQ outperformed GCMA in
all the test images except for the mandrill image and the case of quantizing the Jet
image to 64 colors. Furthermore, PSO-CIQ generally performed better than SOM for
both Lenna and peppers images. SOM and PSO-CIQ performed comparably well
when applied to the mandrill image. SOM generally performed better than PSO-CIQ
when applied to the Jet image. Figures 7.2, 7.3, 7.4 and 7.5 show the visual quality of
the quantized images generated by PSO-CIQ when applied to Lenna, peppers, jet and
mandrill, respectively.

183
Table 7.1: Comparison between SOM, GCMA and PSO-CIQ
Image
K
SOM GCMA PSO-CIQ
16 235.6 ± 0.490 332 210.203 ± 1.487
32 126.400 ± 1.200 179 119.167 ± 0.449
Lenna
64 74.700 ± 0.458 113 77.846 ± 16.132
16 425.600 ± 13.162 471 399.63 ± 2.636
32 244.500 ± 3.854 263 232.046 ± 2.295
Peppers
64 141.600 ± 0.917 148 137.322 ± 3.376
16 121.700 ± 0.458 199 122.867 ± 2.0837
32 65.000 ± 0.000 96 71.564 ± 6.089
Jet
64 38.100 ± 0.539 54 56.339 ± 11.15
16 629.000 ± 0.775 606 630.975 ± 2.059
32 373.600 ± 0.490 348 375.933 ± 3.42
Mandrill
64 234.000 ± 0.000 213 237.331 ± 2.015
184
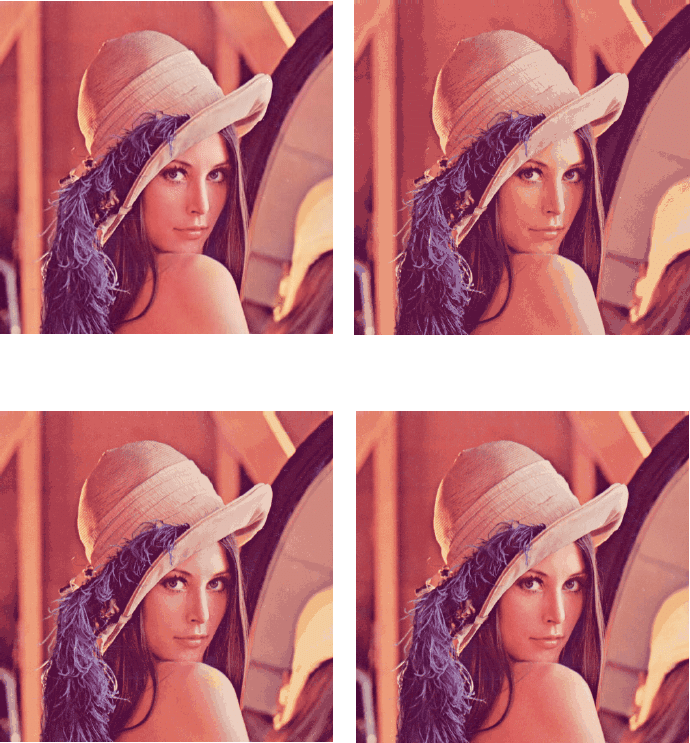
(a) Original (b) 16 colors
(c) 32 colors (d) 64 colors
Figure 7.2: Quantization results for the Lenna image using PSO-CIQ
185
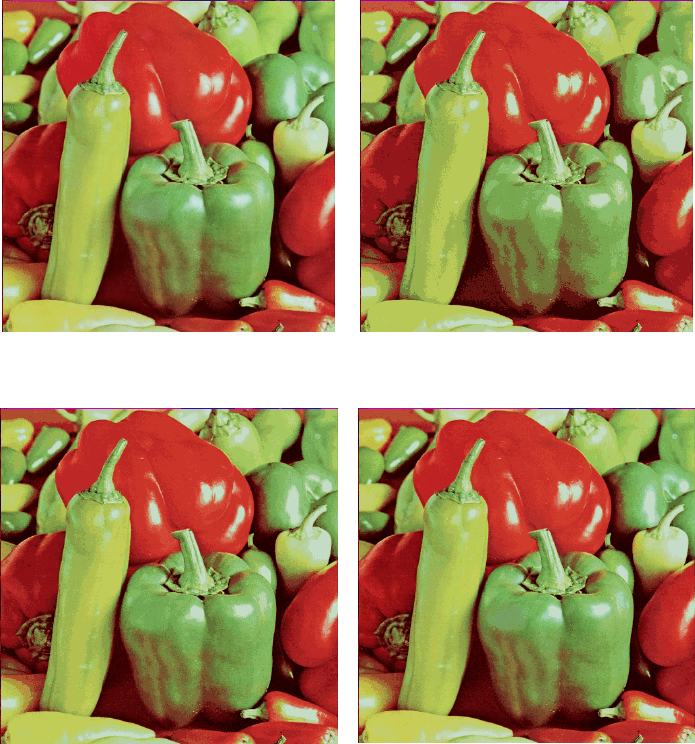
(a) Original (b) 16 colors
(c) 32 colors (d) 64 colors
Figure 7.3: Quantization results for the peppers image using PSO-CIQ
186
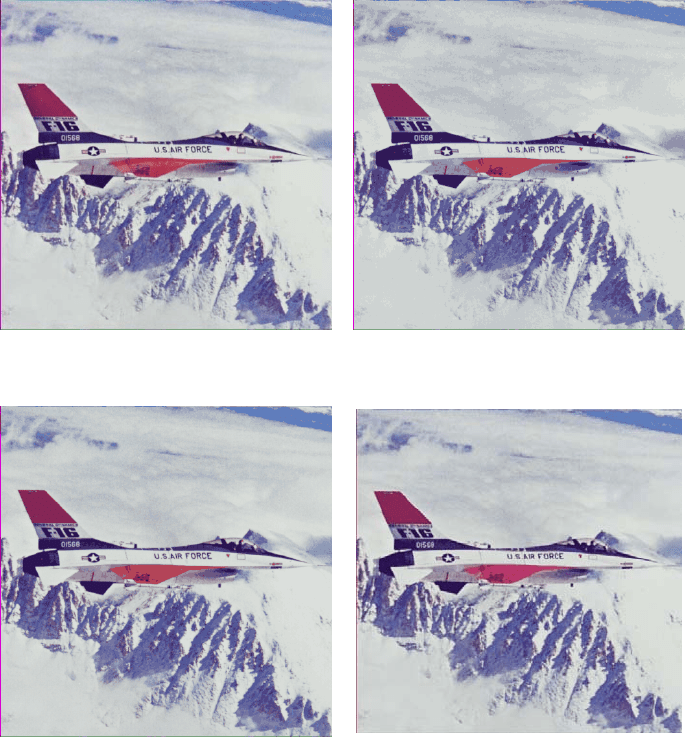
(a) Original (b) 16 colors
(c) 32 colors (d) 64 colors
Figure 7.4: Quantization results for the jet image using PSO-CIQ
187
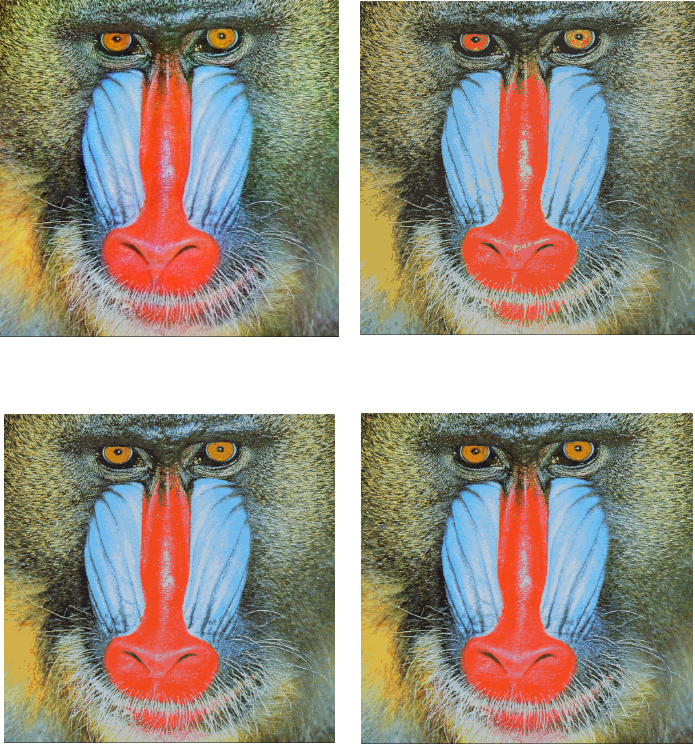
(a) Original (b) 16 colors
(c) 32 colors (d) 64 colors
Figure 7.5: Quantization results for the mandrill image using PSO-CIQ

188
7.1.2.2 Influence of PSO-CIQ Parameters
The PSO-CIQ algorithm has a number of parameters that have an influence on the
performance of the algorithm. These parameters include
V
max
, the swarm size, the
number of PSO iterations,
p
kmeans
and the number of K-means iterations. This section
investigates the influence of different values of these parameters using the Lenna
image when quantized to 16 colors.
Velocity Clamping
Table 7.2 shows that using V
max
= 5 or V
max
= 255 generally produces comparable
results.
Table 7.2: Effect of
V
max
on the performance of PSO-
CIQ using Lenna image (16 colors)
MSE
V
max
=5
209.338 ± 0.402
V
max
=255
210.203 ± 1.487
Swarm Size
Increasing the swarm size from 20 to 50 particles slightly improves the performance
of the PSO-CIQ algorithm as shown in Table 7.3. Similarly, increasing the swarm size
from 50 to 100 particles slightly improves the performance of the PSO-CIQ
algorithm. On the other hand, reducing the swarm size from 20 to 10 particles
significantly reduces the efficiency of the PSO-CIQ algorithm. The rationale behind
these results is that increasing the number of particles increases diversity, thereby

189
limiting the effects of initial conditions and reducing the possibility of being trapped
in local minima.
Table 7.3: Effect of the swarm size on the
performance of PSO-CIQ using Lenna image (16
colors)
MSE
s = 10
212.196 ± 2.458
s = 20
210.203 ± 1.487
s = 50
210.06 ± 1.11
s = 100
209.468 ± 0.703
Number of PSO iterations
Increasing the number of PSO iterations, t
max
, from 50 to 100 slightly improves the
performance of the PSO-CIQ algorithm as shown in Table 7.4. Similarly, increasing
t
max
from 100 to 150 slightly improves the performance of the PSO-CIQ algorithm.
Therefore, it can be concluded that increasing
t
max
generally improves the
performance of the PSO-CIQ algorithm.
Table 7.4: Effect of the number of PSO iterations on
the performance of PSO-CIQ using Lenna image (16
colors)
MSE
t
max
= 50
210.203 ± 1.487
t
max
= 100
209.412 ± 0.531
t
max
= 150
208.866 ± 0.22