Omran M.G.H. Particle Swarm Optimization Methods for Pattern Recognition and Image Processing
Подождите немного. Документ загружается.

160
The remainder of this section is organized as follows: Section 6.2.1 applies
DCPSO to the synthetic images using the three validity indices described in section
6.1.1. These results are compared with the unsupervised fuzzy approach (UFA)
proposed by Lorette
et al. [2000] (discussed in section 3.1.5) and the SOM approach
(refer to section 3.1.6). In section 6.2.2, the same experiments are conducted on the
natural images. Section 6.2.3 compares DCPSO with GA and RS versions on the
natural images. Sections 6.2.4, 6.2.5 and 6.2.6 investigate the influence of the
different DCPSO control parameters. Different PSO models (namely,
lbest, gbest and
lbest-to-gbest) are investigated in section 6.2.7. Finally, section 6.2.8 applies DCPSO
to multispectral imagery data.
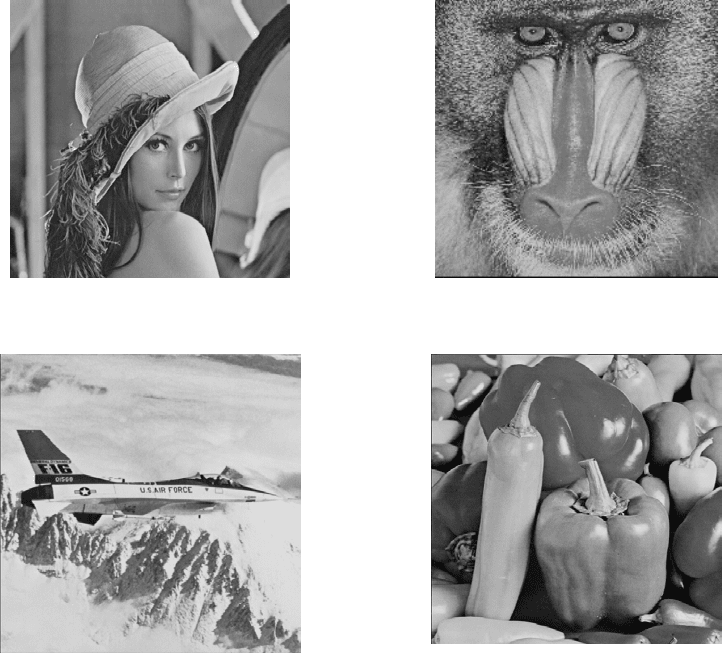
(a) Lenna (b) Mandrill
(c) Jet (d) Peppers
Figure 6.2: Natural Images
161
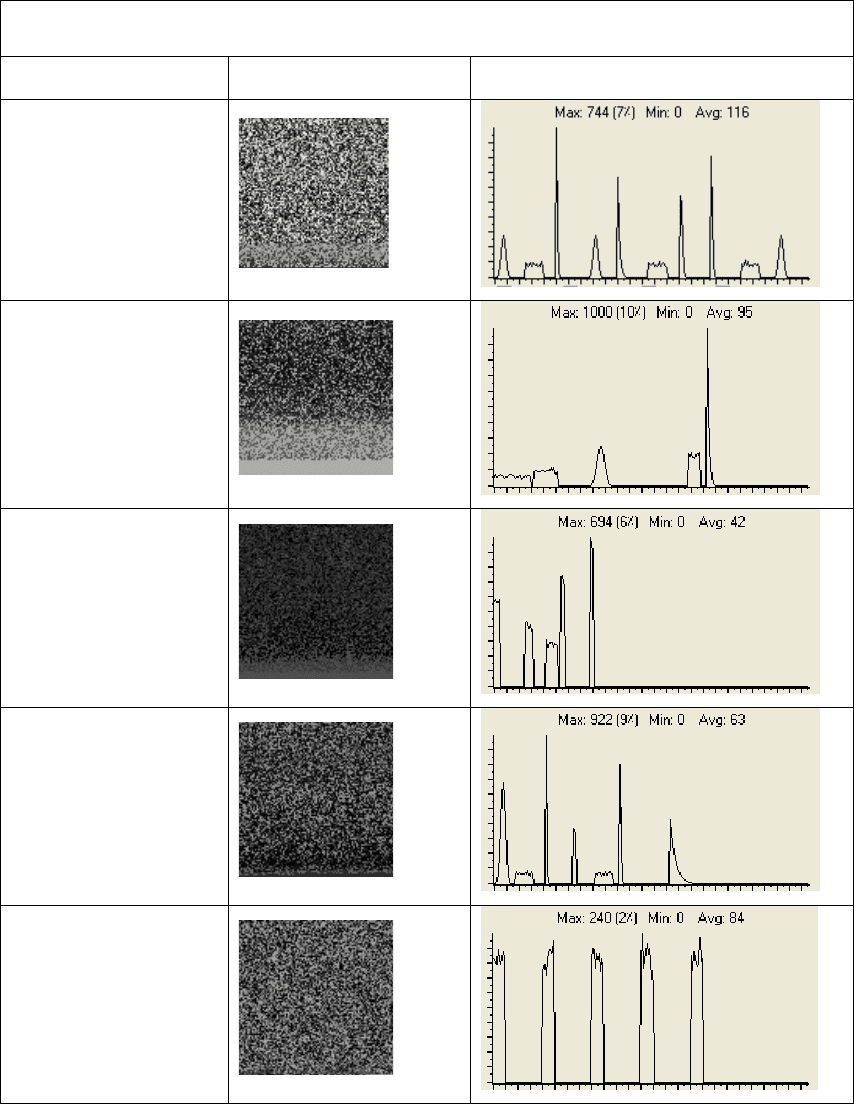
Table 6.1: Additional synthetic images used along with the corresponding histograms
Synthetic image no. Image Histogram
11
12
13
14
15
162
The results reported in this section are averages and standard deviations over 20
simulations. Since
lbest-to-gbest PSO was generally the best performer in chapter 4,
lbest-to-gbest PSO is used in this section unless otherwise specified. Furthermore, if
the best solution has not been improved after a user-specified number of iterations (50
iterations was used for all the experiments conducted) then the algorithm was
terminated (Step 6 of the algorithm, Section 6.1). For the index proposed by Turi
[2001], parameter
c was set to 25 in all experiments as recommended by by Turi
[2001]. The DCPSO parameters were empirically set as follows:
N
c
= 20, p
ini
= 0.75
and
s = 100 for all experiments conducted unless otherwise specified. In addition, the
PSO parameters were set as follows:
w =0.72,
1
c =
2
c = 1.49 and V
max
= 255. For UFA,
the user-defined parameter,
ε
, was set equal to
p
/N1 as suggested by Lorette et al.
[2000]. For the SOM, a Kohonen network of 5×4 nodes was used (to give a minimum
of 20 codebook vectors). All implementation issues were set as in Pandya and Macy
[1996]: the learning rate )(
t
η
was initially set to 0.9 then decreased by 0.005 until it
reached 0.005; the neighborhood function )(
t
w
∆
was initially set to (5+4)/4 then
decreased by 1 until it reached zero.
6.2.1 Synthetic images
Table 6.2 summarizes the results of DCPSO using the three validity indices described
in section 6.1.1, along with the UFA and SOM results. It appears that UFA tends to
overfit the data since it selected the maximum number of clusters as the correct one
for all experiments. The rationale behind this failure is the choice of
ε
which has a
significant effect on the resulting number of clusters. DCPSO using
S_Dbw also
generally overfits the data. On the other hand, DCPSO using
D, DCPSO using V and

163
SOM have generally performed very well (especially DCPSO using
V). Hence, it can
be concluded that DCPSO using
V is efficient with respect to the synthetic images.
Table 6.2: Experiments on synthetic images
Image Actual no.
of clusters
DCPSO using
D
DCPSO using
V
DCPSO using
S_Dbw
SOM UFA
1 2 2 ± 0 2 ± 0 5.55 ± 5.22 2 20
2 3 3 ± 0 3 ± 0 3 ± 0 3 20
3 3 2 ± 0 2 ± 0 4.4 ± 4.852 6 20
4 3 2.7 ± 1.345 5.15 ± 0.357 10.9 ± 5.458 10 20
5 4 10.85 ± 1.878 5 ± 0 15.5 ± 1.323 7 20
6 10 9.55 ± 2.246 7.2 ± 0.872 9.3 ± 0.458 9 20
7 6 3.35 ± 1.526 7.9 ± 0.995 10.8 ± 2.925 9 20
8 4 8.8 ± 2.379075 5 ± 0 4 ± 0 4 20
9 7 4.25 ± 0.433 5 ± 0 14.1 ± 3.52 13 20
10 4 7.9 ± 1.729 7 ± 0 13.95 ± 1.77 9 20
11 10 10.0 ± 0.950 10 ± 0 10 ± 0 10 20
12 5 9.0 ± 2.168 7.2 ± 0.4 11.65 ± 1.06 6 20
13 5 12.1 ± 2.119 5 ± 0 9.6 ± 2.107 5 20
14 7 7.5 ± 1.204 5 ± 0 7.8 ± 2.088 7 20
15 5 5 ± 0 5 ± 0 5 ± 0 5 20
Avg. 5.2 6.53 5.43 9.04 7 20
6.2.2 Natural images
Table 6.3 shows the results of DCPSO using the three validity indices described in
section 6.1.1. These results are compared with the results of UFA and SOM. In
addition, the results of snob for the Lenna, mandrill, jet and peppers images are copied
from Turi [2001]. The optimal range for the number of clusters for the images of
Lenna, mandrill, jet and peppers are also taken from Turi [2001] which was based on
a visual analysis survey conducted by a group of ten people. Similarly, the optimal
range for the MRI and Lake Tahoe images were estimated using a group of three

164
people. It appears from the table that results of DCPSO using
S_Dbw, UFA, SOM
and snob were poor. DCPSO using
V always found a solution within the optimal
range. Therefore, the remaining experiments will use
V as the validity index. These
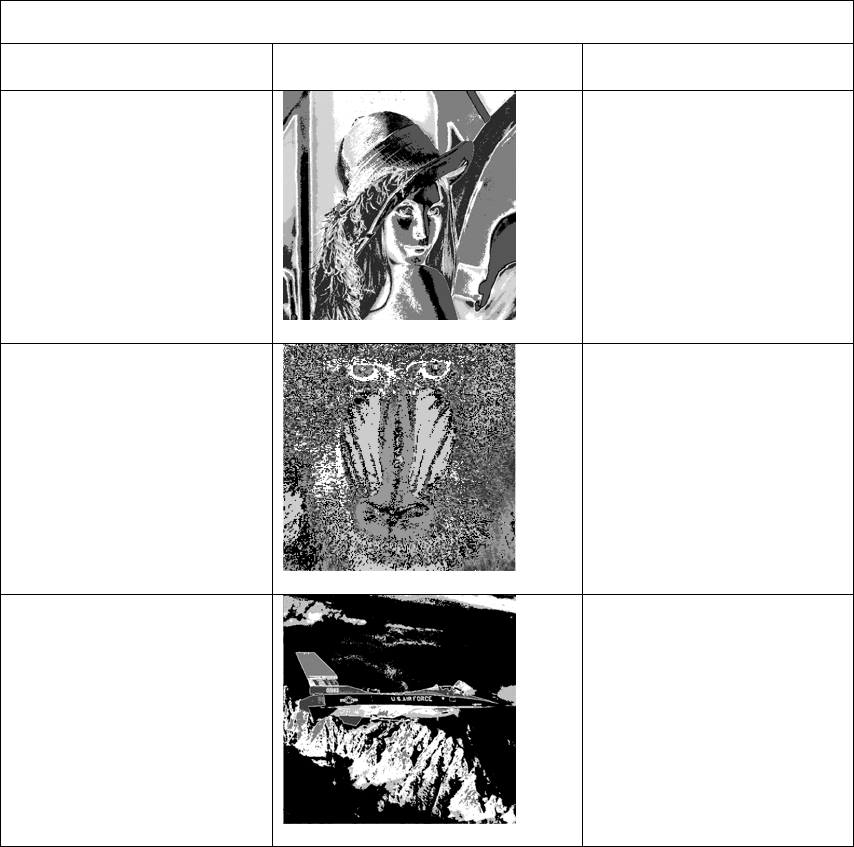
results clearly show the efficiency of DCPSO. Table 6.4 provides samples of the
resultant segmented images generated by DCPSO using
V.
Table 6.3: Experiments on natural images
Image Optimal
range
DCPSO using
D
DCPSO using V DCPSO using
S_Dbw
SOM UFA Snob
Lenna 5 to 10 10.35 ± 1.652 6.85 ± 0.477 19.3 ± 0.843 20 20 31
Mandrill 5 to 10 6.05 ± 1.658 6.25 ± 0.433 19.25 ± 0.766 20 20 42
Jet 5 to 7 3.35 ± 2.151 5.3 ± 0.459 18.05 ± 1.465 14 20 22
peppers 6 to 10 10.55 ± 1.465 6 ± 0 18.8 ± 0.872 20 20 39
MRI 4 to 8 3 ± 0 5 ± 0 17.2 ± 1.4 19 20 -
Tahoe 3 to 7 3 ± 0 6.1 ± 0.539 14.3 ± 3.018 4 20 -
Avg. 6.05 5.92 17.82 16.17 20 -
165
Table 6.4: Samples of segmented images resulting from DCPSO using
V
Image Segmented image No. of clusters
Lenna
7
Mandrill
6
Jet
5
166
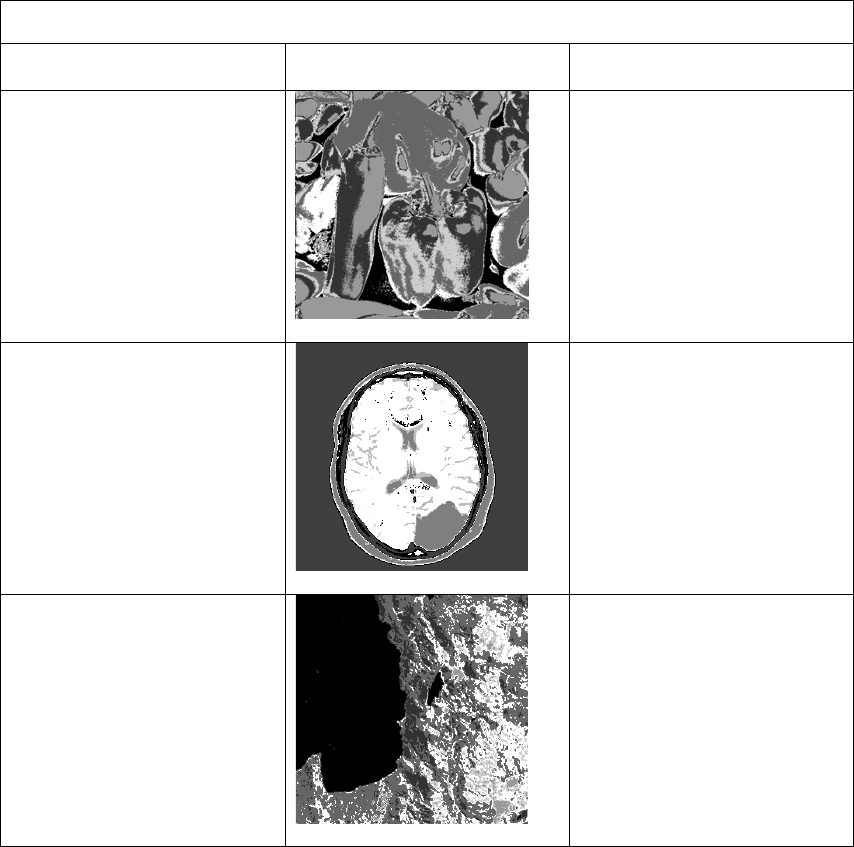
Table 6.4: Samples of segmented images resulting from DCPSO using
V (continued)
Image Image Image
peppers
6
MRI
5
Tahoe
6
6.2.3 Comparison with GA and RS
The previous experiments were conducted using the dynamic cluster PSO. In this
section, a GA and RS version of the algorithm in Figure 6.1 (called DCGA and
DCRS, respectively) are examined and compared with DCPSO. Both DCGA and
DCRS used 100 individuals. For DCGA, elitism was used, keeping the fittest
chromosome for the next generation. In addition, random selection has been used
along with uniform crossover. The crossover probability was set to 0.8 with a mixing

167
ratio of 0.5; a mutation probability of
c
/N1 was used. Table 6.5 presents the results of
applying DCPSO, DCGA and DCRS on the natural images. As expected, DCRS
performed poorly due to its pure random search. DCGA performed comparably to
DCPSO.
Table 6.5: Comparison of PSO-, GA- and RS- versions of the
proposed approach
Image Optimal
range
DCPSO using
V
DCGA using
V
DCRS using V
Lenna 5 to 10 6.85 ± 0.477 6.45 ± 0.74 9.8 ± 1.661
Mandrill 5 to 10 6.25 ± 0.433 6.05 ± 0.589 8.75 ± 2.095
Jet 5 to 7 5.3 ± 0.459 5.3 ± 0.557 11.05 ± 1.627
peppers 6 to 10 6 ± 0 6.05 ± 0.218 10.55 ± 1.532
MRI 4 to 8 5 ± 0 5.5 ± 0.742 8.1 ± 1.179
Tahoe 3 to 7 6.1 ± 0.539 6.1 ± 0.831 9.25 ± 1.479
Avg. 5.92 5.91 9.58
6.2.4 Swarm Size
Reducing the swarm size (or population size in case of GA) from 100 to 20 particles
(or GA chromosomes) did not generally affect the performance of either DCPSO or
DCGA as illustrated in Table 6.6. However, comparing Table 6.5 and Table 6.6 it
seems that on average less clusters are formed with less particles/chromosomes. In
general, the computational requirements of DCPSO and DCGA can be reduced
significantly without affecting the performance of DCPSO and DCGA.

168
Table 6.6: Comparison of PSO- and GA-
versions of the proposed approach using a
swarm size
s = 20
Image Optimal
range
DCPSO using
V
DCGA using
V
Lenna 5 to 10 6.5 ± 0.806 6.4 ± 0.8
Mandrill 5 to 10 6.15 ± 0.357 5.85 ± 0.476
Jet 5 to 7 5.3 ± 0.458 5.35 ± 0.477
peppers 6 to 10 6.05 ± 0.218 6 ± 0
MRI 4 to 8 5.2 ± 0.4 5.15 ± 0.357
Tahoe 3 to 7 6.05 ± 0.384 6.2 ± 0.4
Avg. 5.875 5.825
6.2.5 The Termination Criteria
Given that all parameters are fixed at the values given in section 6.2.4, the influence
of the termination criteria were evaluated for the natural images. The termination
criterion for step 6 in the algorithm (section 6.1) is called
TC
1
and for step 10 is called
TC
2
.
Table 6.7 and 6.8 summarize the effect of
TC
1
and TC
2
, respectively. In Table
6.7,
TC
2
was fixed at 2. Table 6.7 shows that for the Lenna, Mandrill and MRI images
all the tested values for
TC
1
produced comparable results within the optimal range.
For the Jet image, all the tested values for
TC
1
performed comparably with TC
1
=5 and
TC
1
=25 slightly worse than the other values. For the Peppers image, TC
1
=75 and
TC
1
=100 performed better than other values and the results suggest that the "optimal"
number of clusters in the Pepper image is 6 which seems to be a valid number. For the
Tahoe image, all the test values for
TC
1
(except TC
1
=75) produced comparable results
within the optimal range. From the results shown in Table 6.7, it can be concluded
that the performance of DCPSO is generally insensitive to
TC
1
's values.
169
In Table 6.8,
TC
1
was fixed at 50. Table 6.8 shows that for the Lenna and
Peppers images all the values of
TC
2
(except for TC
2
=2) produced the "optimal"
number of clusters. For the Mandrill image, all the tested values for
TC
2
produced
comparable results within the optimal range. For the Jet image, all the values of
TC
2
(expect
TC
2
=2) produced results within the optimal range. TC
2
=25 and TC
2
=50
suggest that the "optimal" number of clusters in the MRI image is 5. This seems to be
a valid number since the Brain MRI images consist mainly of three major tissue
classes: gray matter, white matter and cerebrospinal fluid [Zhang
et al. 2001].
Furthermore, the images contain the skull and the background. For the Tahoe image,
TC
2
=25 and TC
2
=50 produced results outside the optimal range. From the results
shown in Table 6.8, it can be concluded that the performance of DCPSO is relatively
insensitive to
TC
2
's values.