Patrick F. Dunn, Measurement, Data Analysis, and Sensor Fundamentals for Engineering and Science, 2nd Edition
Подождите немного. Документ загружается.


386 Measurement and Data Analysis for Engineering and Science
A
0
=
2
T
Z
T
0
y(t)dt,
A
n
=
2
T
Z
T
0
y(t) cos
2πnt
T
dt n = 1, 2, . . . , ∞,
(10.7)
and
B
n
=
2
T
Z
T
0
y(t) sin
2πnt
T
dt n = 1, 2, . . . , ∞. (10.8)
Fourier analysis of a discrete signal is accomplished by replacing the follow-
ing in Equations 10.6 and 10.8:
1. The integrals over t in Equation 10.8 by summations over δt.
2. Continuous time t by discrete time rδt, where r = 1, 2, . . . , N.
3. T = Nδt, where N is an even number.
4. n from 1 to ∞ with k from 0 to N/2.
In doing so, A
n
becomes a
k
, where
a
k
=
2
Nδt
N
X
r=1
y(rδt) cos
2πkrδt
Nδt
δt
=
2
N
N
X
r=1
y(rδt) cos
2πkr
N
k = 0, 1, . . . ,
N
2
. (10.9)
Likewise,
b
k
=
2
N
N
X
r=1
y(rδt) sin
2πkr
N
k = 1, 2, . . . ,
N
2
− 1 (10.10)
and
c
k
=
2
N
N
X
r=1
p
a
2
r
+ b
2
r
. (10.11)
Note that k represents the discrete frequency and r the discrete sample
point. Each discrete sample point can contribute to a discrete frequency.
Every sample point’s contribution to a particular discrete frequency is in-
cluded by summing over all sample points at that frequency. This yields the
corresponding discrete expression for y(t),

Signal Analysis 387
y(rδt) =
a
0
2
+
(N/2)−1
X
k=1
a
k
cos
2πrk
N
+ b
k
sin
2πrk
N
+
a
N/2
2
cos(πr). (10.12)
The last term corresponds to f
max
= f
N
. The equations for a
k
and b
k
comprise the discrete Fourier transform or DFT of y(rδt). The equation
y(rδt) is the discrete Fourier series.
A computer program or M-file can be written to perform the DFT, which
would include the following steps:
1. Fix k.
2. Evaluate 2πrk/N for all r.
3. Compute cos[2πrk/N] and sin[2πrk/N ].
4. Compute y(rδt) cos[2πrk/N] and y(rδt) sin[2πrk/N].
5. Sum these values from r = 1 to N to give a
k
and b
k
as given in Equations
10.9 and 10.10.
6. Repeat for next k
7. After completing for all k, determine c
k
using Equation 10.11.
This method involves N
2
real multiply-add operations.
Alternatively, the DFT can be written using complex notation. Using the
Fourier coefficient definitions in Equation 10.8, and introducing Y
n
, which
was called C
n
in Chapter 9, gives
Y
n
=
A
n
2
− i
B
n
2
. (10.13)
This leads to
Y
n
(t) =
1
T
Z
T
0
y(t)
cos
2πnt
T
− i sin
2πnt
T
dt
=
1
T
Z
T
0
y(t) exp[−i(2πnt/T )]dt. (10.14)
By making the appropriate substitutions for T , δt, and n in Equation 10.14,
the discrete Fourier transform in complex form becomes

388 Measurement and Data Analysis for Engineering and Science
Y
k
=
1
Nδt
N
X
r=1
y(rδt) exp
−i
2πkrδt
Nδt
dt
=
1
N
N
X
r=1
y(rδt) exp[−i(2πkr/N)]
=
1
N
N
X
r=1
y
r
exp[−i(2πkr/N)]. (10.15)
Again, k represents the discrete frequency and r represents the discrete
sample point. This method requires N
2
complex multiplications. Note also
that 2πrk/N can be replaced by 2πrf
k
δt because f
k
= k/T = k/(N δt).
10.5 Fast Fourier Transform
The fast Fourier transform, or FFT, is a specific type of DFT that is
computationally faster than the original DFT. Danielson and Lanczos pro-
duced one such FFT algorithm in 1942. Cooley and Turkey developed the
most frequently used one in the mid-1960’s. Danielson and Lanczos showed
that a DFT of length N can be rewritten as the sum of two DFTs, each of
length N/2, one coming from the even-numbered points of the original N,
the other from the odd-numbered points [3]. Equation 10.15 can be rear-
ranged to conform to this format as
Y
k
=
1
N
N−1
X
r=0
y
r
e
−i
(
2πrk
N
)
(10.16)
=
1
N
(N/2)−1
X
r=0
y
2r
e
−i
[
2π(2r)k
N
]
+
(N/2)−1
X
r=0
y
2r+1
e
−i
[
2π(2r+1)k
N
]
=
1
N
(N/2)−1
X
r=0
y
2r
e
−i
[
2πrk
(N/2)
]
+ W
k
(N/2)−1
X
r=0
y
2r+1
e
−i
[
2πrk
(N/2)
]
,
where W
k
≡ e
−i[2πk/N]
. Equation 10.17 can be written in a more condensed
form, Y
k
= Y
even
k
+ W
k
Y
odd
k
, where Y
even
k
is the kth component of the
DFT of length N/2 formed from the even-numbered y
k
values and Y
odd
k
is
the kth component of the DFT of length N/2 formed from the odd-numbered
y
k
values. This approach can be applied successively until the last transforms
Signal Analysis 389
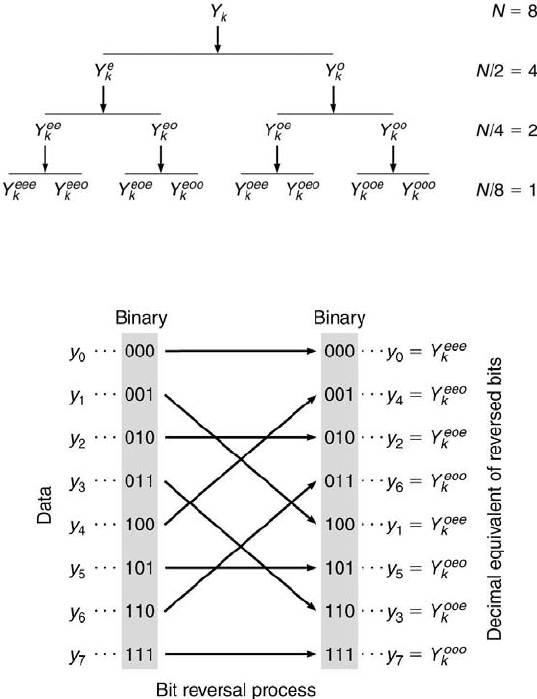
FIGURE 10.6
DFT sequence for N = 8.
FIGURE 10.7
DFT sequence for N = 8 showing bit reversal.
have only one term each. At that point, the DFT of the term equals the term
itself, where Y
k
(for k = 0, r = 0, N = 1) = (1/1) y
0
e
−i·0
= y
0
= Y
0
.
The sequence of the computational breakdown for N = 8 is displayed
in Figure 10.6. Symmetry is maintained when N = 2
M
. Here Y
xxx
k
are the
DFTs of length one. They equal the values of the discrete sample points,
y(rδt). For a given N, the particular y
k
values can be related to a pattern
of e’s and o’s in the sequence. By reversing the pattern of e’s and o’s (with
e = 0 and o = 1), the value of k in binary is obtained. This is called bit
reversal. This process is illustrated in Figure 10.7. The speed of this FFT is
∼ O(N log
2
N) vs O(N
2
) for the DFT, which is approximately 40 000 times
faster than the original DFT!
390 Measurement and Data Analysis for Engineering and Science
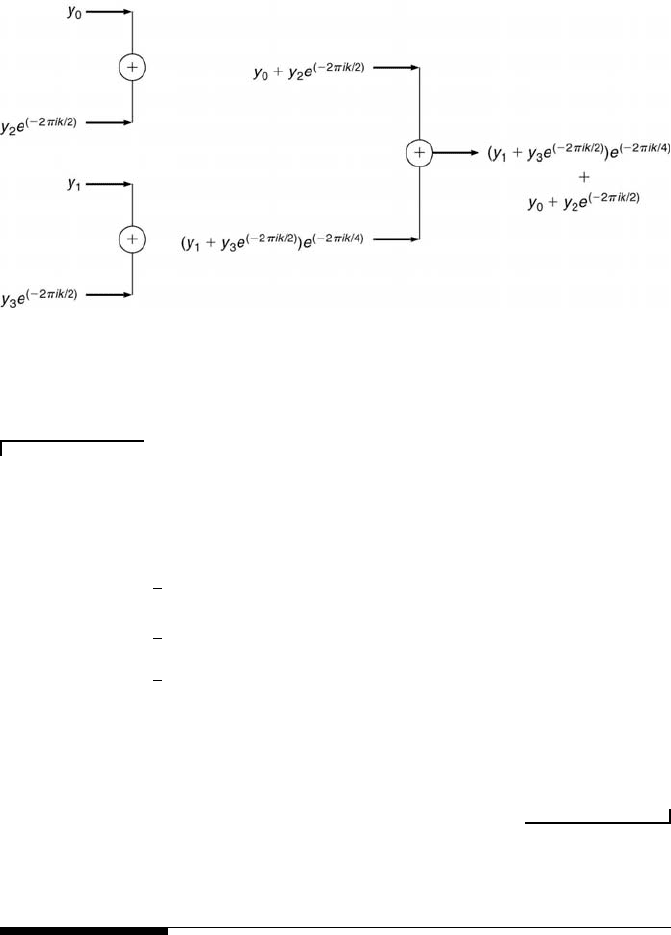
FIGURE 10.8
More efficient DFT sequence for N = 4.
Example Problem 10.3
Statement: For the case of N = 4, determine the four DFT terms y
0
, y
1
, y
2
and
y
3
for r = 0, . . . , N − 1.
Solution: Direct implementation of Equation 10.17 yields
Y
k
=
1
4
3
X
r=0
y
r
e
−i(2πrk/4)
=
1
4
n
y
0
+ y
1
e
−i(2πk/4)
+ y
2
e
−i(2π2k/4)
+ y
3
e
−i(2π3k/4)
o
=
1
4
n
y
0
+ y
2
e
−i(2πk/2)
+ e
−i(2πk/4)
·
h
y
1
+ y
3
e
−i(2πk/2)
i
.
o
Thus, the DFT could be performed computationally faster in the sequence, as
illustrated in Figure 10.8, by starting with the even (y
0
and y
2
) and odd (y
1
and y
3
)
pairs.
10.6 Amplitude Ambiguity
Amplitude ambiguity also arises when the sample time period, T
r
, is not
an integer multiple of the fundamental period of the signal. If the signal
has more than one period or is aperiodic, this will complicate matters. For
complex periodic signals, T
r
must be equal to the least common integer
Signal Analysis 391
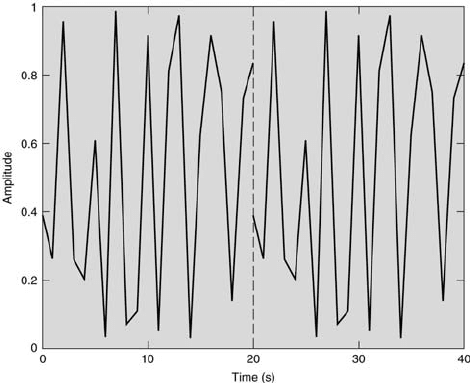
FIGURE 10.9
Two repeated segments of the same random signal.
multiple of all frequencies contained in the signal. For aperiodic signals,
T
r
theoretically must be infinite. Practically, finite records of length T
r
are
considered and windowing must be used to minimize the effect of amplitude
ambiguity. Application of the DFT or FFT to an aperiodic signal implicitly
assumes that the signal is infinite in length and formed by repeating the
signal of length T
r
an infinite number of times. This leads to discontinuities
in the amplitude that occur at each integer multiple of T
r
, as shown in
Figure 10.9 at the time equal to 20 s. These discontinuities are step-like,
which introduce false amplitudes that decrease around the main frequencies
similar to those observed in the Fourier transform of a step function (see
Chapter 9).
Thus, the amplitudes of simple or complex periodic waveforms will be
accurately represented in the DFT when f
s
> 2f
max
and T
r
= mT
1
, where
m = 1, 2, ...,. T
1
is the fundamental period (= 1/f
1
) and T
r
the total sample
period (= Nδt = N/f
s
), which implies that N = m(f
s
/f
1
). If the latter con-
dition is not met, leakage will occur in the DFT, appearing as amplitudes
at f
1
spilling over into other adjacent frequencies. Further, for DFT compu-
tations to be fast, N must be set equal to 2
M
, which yields 2
M
= m(f
s
/f
1
),
where m and N are positive integers. These conditions are summarized as
follows:
1. Set f
max
= f
N
⇒ f
s
= 2f
max
, assuming that f
1
and f
max
are known.
2. Find a suitable N by the steps:
(a) Choose a value for m, keeping m ≥ 10).
392 Measurement and Data Analysis for Engineering and Science
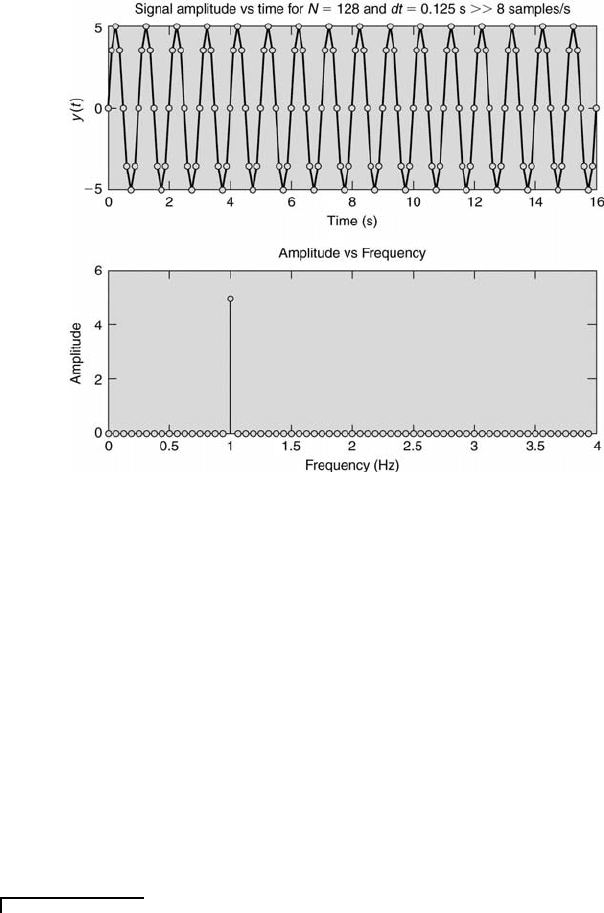
FIGURE 10.10
Signal and frequency spectrum with dt = 0.125 s.
(b) Is there an integer solution for M, where 2
M
= m(f
s
/f
1
)?
(c) If so, stop.
(d) If not, iterate until an integer M is found. Thus, N = 2
M
and
T
r
= Nδt.
For aperiodic and nondeterministic waveforms, the frequency resolution δf
(= 1/Nδt) is varied until leakage is minimized. Sometimes, all frequencies
are not known. In that case, to avoid leakage, windowing must be used.
The following example illustrates the effect of sampling rate on the result-
ing amplitude-frequency spectrum in terms of either aliasing or amplitude
ambiguity.
Example Problem 10.4
Statement: Convert the analog voltage, E(t) = 5 sin(2πt) mV, into a discrete time
signal. Specifically, using sample time increments of (a) 0.125 s, (b) 0.30 s, and (c)
0.75 s, plot each series as a function of time over at least one period. Discuss apparent
differences between the discrete representation of the analog signal. Also, compute the
DFT for each of the three discrete signals. Discuss apparent differences. Use a data set
of 128 points.
Solution:
y(t) = 5 sin(2πt) ⇒ f = 1 Hz.
Signal Analysis 393
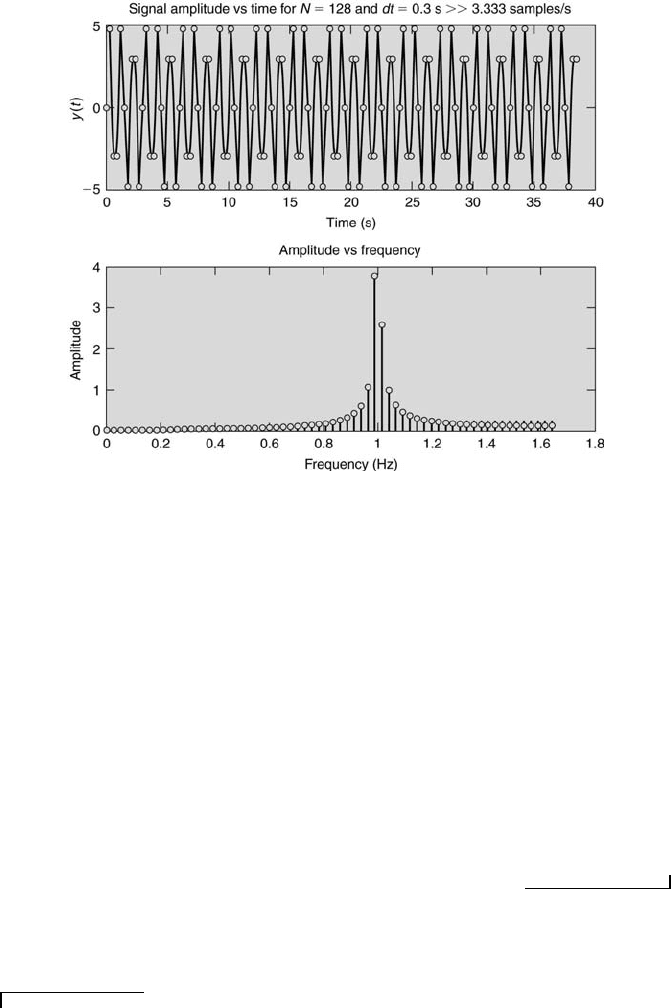
FIGURE 10.11
Signal and frequency spectrum with dt = 0.3 s.
Aliasing will not occur when f
s
(= 1/dt) > 2f (f = 1 Hz). Amplitude ambiguity
will not occur when T = mT
1
⇒ m = f Ndt (m : integer).
For part (a) f
s
> 2f and m = (1)(128)(.125) = 16 ⇒ no aliasing or amplitude
ambiguity. The result is shown in Figure 10.10, which was presented previously to
illustrate the FFT.
For part (b) f
s
> 2f ⇒ no aliasing, and m = (1)(128)(0.3) = 38.4 ⇒ amplitude
ambiguity will occur. This is displayed in Figure 10.11. The amplitude, however, is less
than the actual amplitude (here it is less than 4). Around that frequency the amplitude
appears to leak into adjacent frequencies.
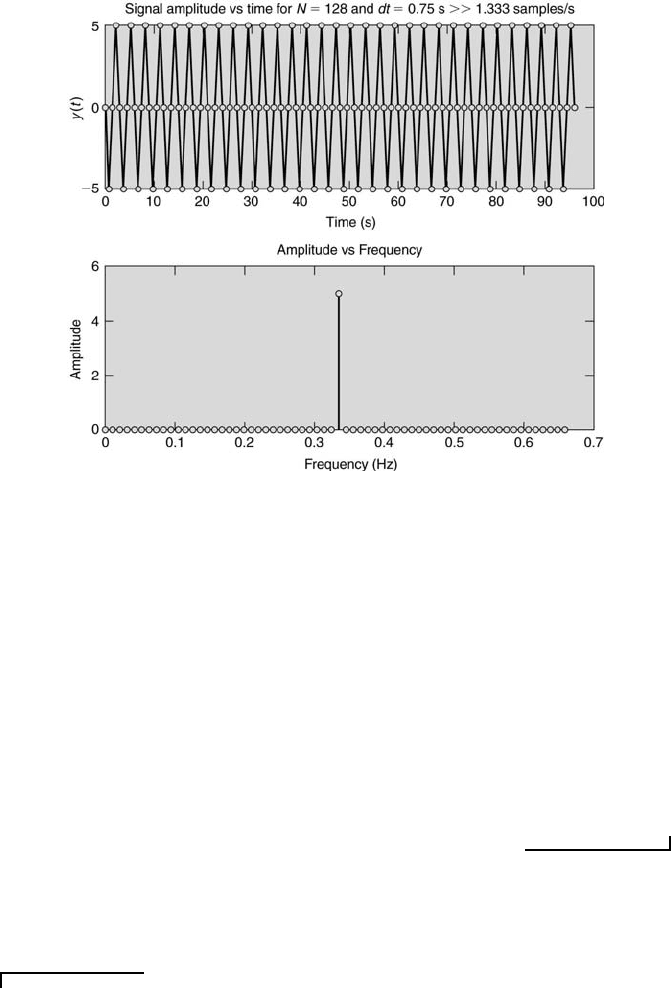
For part (c) f
s
< 2f ⇒ aliasing will occur, and m = (1)(128)(0.75) = 96 ⇒ no
amplitude ambiguity will be present. This is shown in Figure 10.12. The aliased fre-
quency can be determined using the aforementioned folding-diagram procedure. Here,
f
s
= 4/3, f
N
= 2/3, and f = 1. This leads to k = 3/2, which implies k
a
= 1/2 using
the folding diagram. Thus, f
a
= (1/2)(2/3) = 1/3 Hz.
Now consider an example where both aliasing and amplitude ambiguity
can occur simultaneously.
Example Problem 10.5
Statement: Compute the DFT for the discrete time signal that results from sam-
pling the analog signal, T (t) = 2 sin(4πt)
◦
C, at sample rates of 3 Hz and 8 Hz. Use a
data set of 128 points. Discuss and compare your results.
394 Measurement and Data Analysis for Engineering and Science
FIGURE 10.12
Signal and frequency spectrum with dt = 0.75 s.
Solution:
T (t) = 2 sin(4πt) ⇒ 2 Hz.
For the sample rate of 3 Hz, f
s
= 2f ⇒ aliasing will occur and m = (1)(128)(1/3) =
42.67 ⇒ amplitude ambiguity will be present. The results are presented in Figure 10.14.
The aliased frequency occurs where the amplitude is maximum, at 1 Hz. This can
be determined using the aforementioned folding-diagram procedure. Here, f
s
= 3,
f
N
= 3/2, and f = 2. This leads to k = 4/3, which implies k
a
= 2/3 using the folding
diagram. Thus, f
a
= (2/3)(3/2) = 1. Also, note the distortion of the signal’s time
record that occurs because of the low sampling rate.
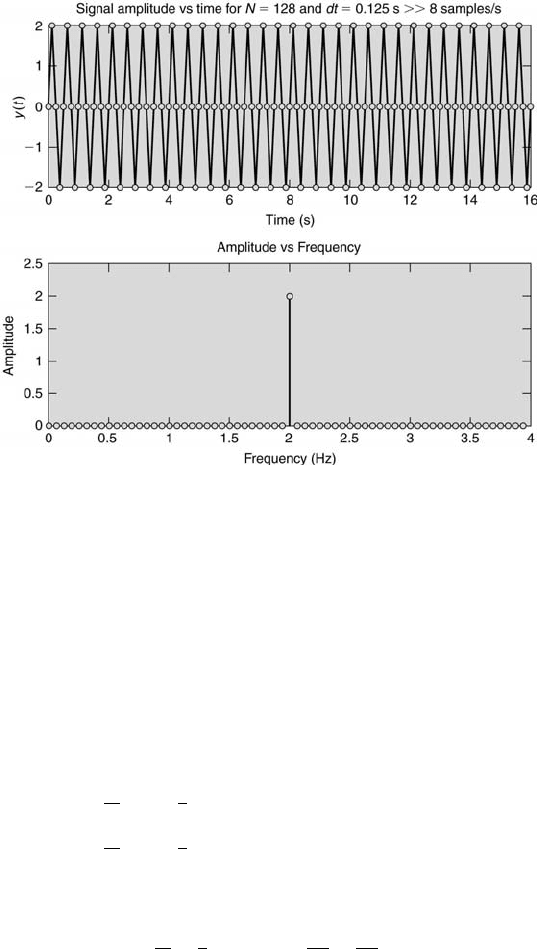
When the sampling rate is increased to 8 Hz, f
s
> 2f ⇒ no aliasing occurs.
Also m = (1)(128)(0.125) = 16 ⇒ no amplitude ambiguity occurs. This is shown in
Figure 10.13, which is the correct spectrum.
Analysis becomes more complicated when more than one frequency is
present in the signal. Next, consider an example that involves a signal con-
taining two frequencies.
Example Problem 10.6
Statement: Consider the signal y(t) = 3.61 sin(4πt + 0.59) + 5 sin(8πt). Plot y(t)
versus time and the resulting frequency spectrum for the following cases and discuss
what is observed with respect to aliasing and amplitude ambiguity:
Signal Analysis 395
FIGURE 10.13
Signal and frequency spectrum with dt = 0.125 s.
(i) N = 100, f
s
= 50
(ii) N = 20, f
s
= 10
(iii) N = 10, f
s
= 5
(iv) N = 96, f
s
= 5
(v) N = 96, f
s
= 10
Solution: y(t) = 3.61 sin(4πt + 0.59) + 5 sin(8πt). So, f
1
= 2 Hz and f
2
= 4 Hz,
which implies that f
max
= 4 Hz. If f
s
= 5 samples/s,
f
s
f
1
=
5
2
= 2.5 > 2 ⇒ no aliasing, and
f
s
f
2
=
5
4
= 1.25 < 2 ⇒ aliasing will occur.
To where will the 4 Hz component be aliased?
f
N
=
f
s
2
=
5
2
= 2.5 Hz ⇒
f
2
f
N
=
4
2.5
= 1.6.
Using the folding diagram 1.6f
N
is folded down to 0.4f
N
= (0.4)(2.5) = 1 Hz. That is,
the 4 Hz component appears as a 1 Hz component.
But what about amplitude ambiguity? T
1
= 1/f
1
= 1/2 s, and T
2
= 1/f
2
= 1/4 s.
The total sample period, T , must contain integer multiples of both T
1
and T
2
so as not
to have amplitude ambiguity in both components. This can be easily met by having
T = mT
1
= m/2 s (since T
2
= T
1
/2). In essence, the least common integer multiple