Pumping Station Desing - Second Edition by Robert L. Sanks, George Tchobahoglous, Garr M. Jones
Подождите немного. Документ загружается.

that
the
pump
selected
is the
best
fit, and
that
the
motor
and
electrical gear
are
sized adequately.
The
drawings
and
specifications
are
reviewed
by
the
owner,
and the
operators
are
walked through
the
design system
by
system. Final revisions
are
made
before
bidding
the
project.
Critique
Compare Figures 26-3, 17-21,
and
17-22.
The
choice
of
pumping station configuration
for
each
site should
be
based
on
sound judgment
in
which
first
cost
is
balanced against cleanliness
and
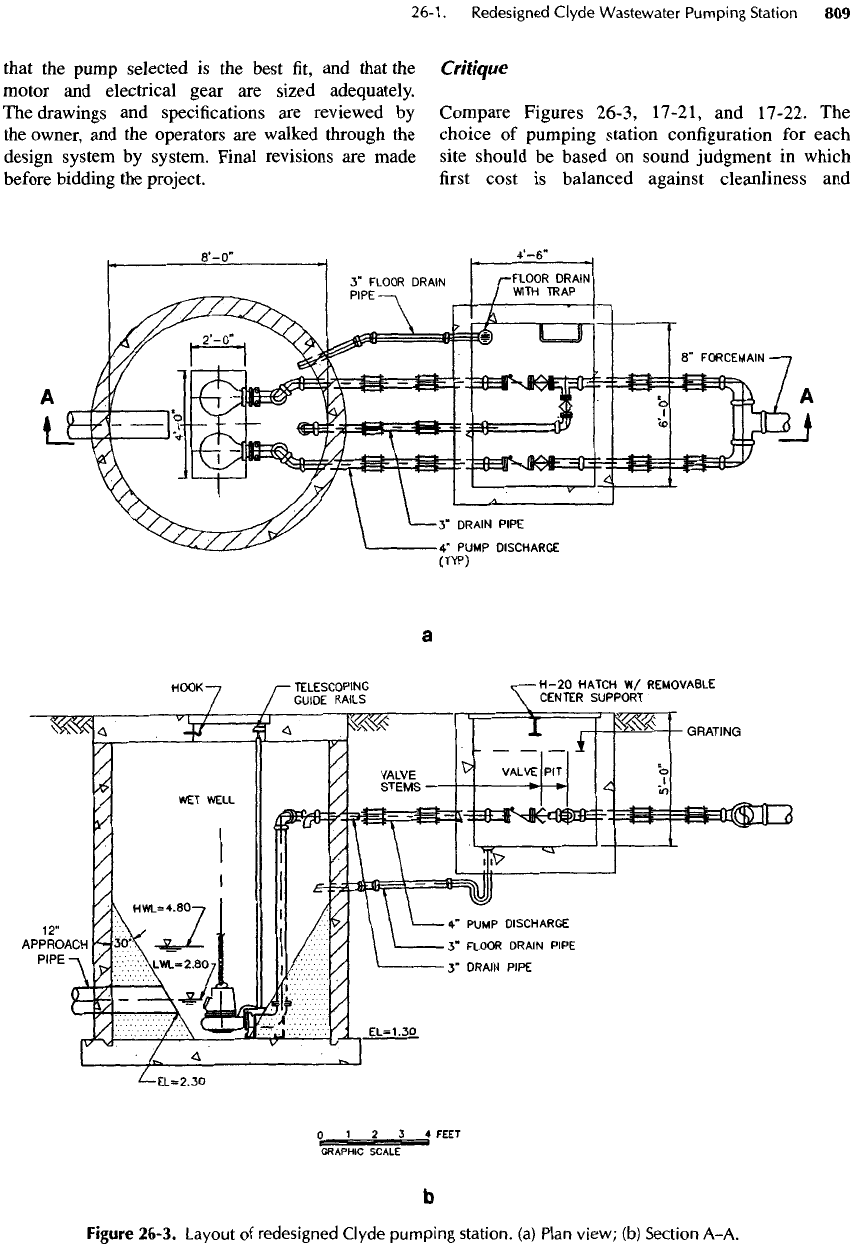
Figure
26-3.
Layout
of
redesigned
Clyde
pumping
station,
(a)
Plan
view;
(b)
Section
A-A.
desired control
of
odors
and the
ease
and
cost
of
maintenance.
Some operators prefer that
the
pump discharge lines
be
cross-connected with each other upstream
from
the
check valves (with
a
valve
on
each branch)
and
con-
nected
to the
force
main drain line,
as in
Figure 17-22.
Although
such piping increases
the
number
of
valves,
the
size
of the
valve
vault
and the
project cost,
it
allows
the
operator
to
agitate
the wet
well contents with
one
pump before pumping
to the
force
main with
the
other.
It
also allows
the
operator
to
backflow
one
pump
with
the
other
to
remove clogs without removing
the
pump.
The
pumps could
be
equipped with nozzles
as in
Figure
12-58c,
but
these pumps
are so
small that such
refinements
are of
debatable value.
The
plans
in
Figure 26-3 indicate
a
pyramid-
shaped hopper bottom.
To
keep
the
water
surface
area
as
small
as
possible
so
that scum will
be
readily drawn
into
the
pump intakes
at
pump-down,
the
sides
of the
sump
should
hug the
pump volutes with
no
more than
4 in. of
clearance. Instead
of
being
a
2-ft-by-4-ft
rect-
angle,
the
hopper bottom would
be
improved
if
rounded ends were used
and if the
clearance between
pump
volutes were reduced
to 4 in.
26-2.
Redesigned
Kirkland
Wastewater
Pumping
Station
Designed originally
in
1965,
the
Kirkland Pumping
Station
is
shown
in
U.S. customary units
in
Figures
17-
13
and
17-14,
so the
same units
are
used
in
this section.
The
station
has
been
in
continuous operation since
1967.
The
following example
is a
revised version
of the
existing station,
modified
to
reflect:
(1) wet
well design
developments that provide
the
self-cleaning features
described
in
Chapter
12; (2) the
best
in
current technol-
ogy;
and (3)
more recent
and
stringent reliability stan-
dards.
The
station consists
of
three
2.5
Mgal/d
pumps
operating against
a
total dynamic head
of
189
feet.
The top of the
influent
sewer
is no
more than
6 ft
below
finished
grade.
For
such
a
shallow site, horizon-
tal
pumps were selected
for
both
the
1965
and the
cur-
rent designs. Because they
are
less prone
to
vibration,
horizontal pumps
are
preferred when they
can be
jus-
tified
by
little
increase
in
structure
cost.
Instead
of the
eddy-current
couplings used
in the
original station,
the
revised design
has 125 hp
adjustable-frequency
drives.
A 300 kW
standby generator
is
provided
for
protection against power outages.
The
force main terminates
at an
interceptor sewer
3150
ft
from
the
pumping station site
at an
elevation
123 ft
above
the
soffit
of the
influent
sewer. Calcula-
tions
were performed
by
using PUMPGRAF© [1],
a
computer
spreadsheet
program configured specifically
for
pumping station design work.
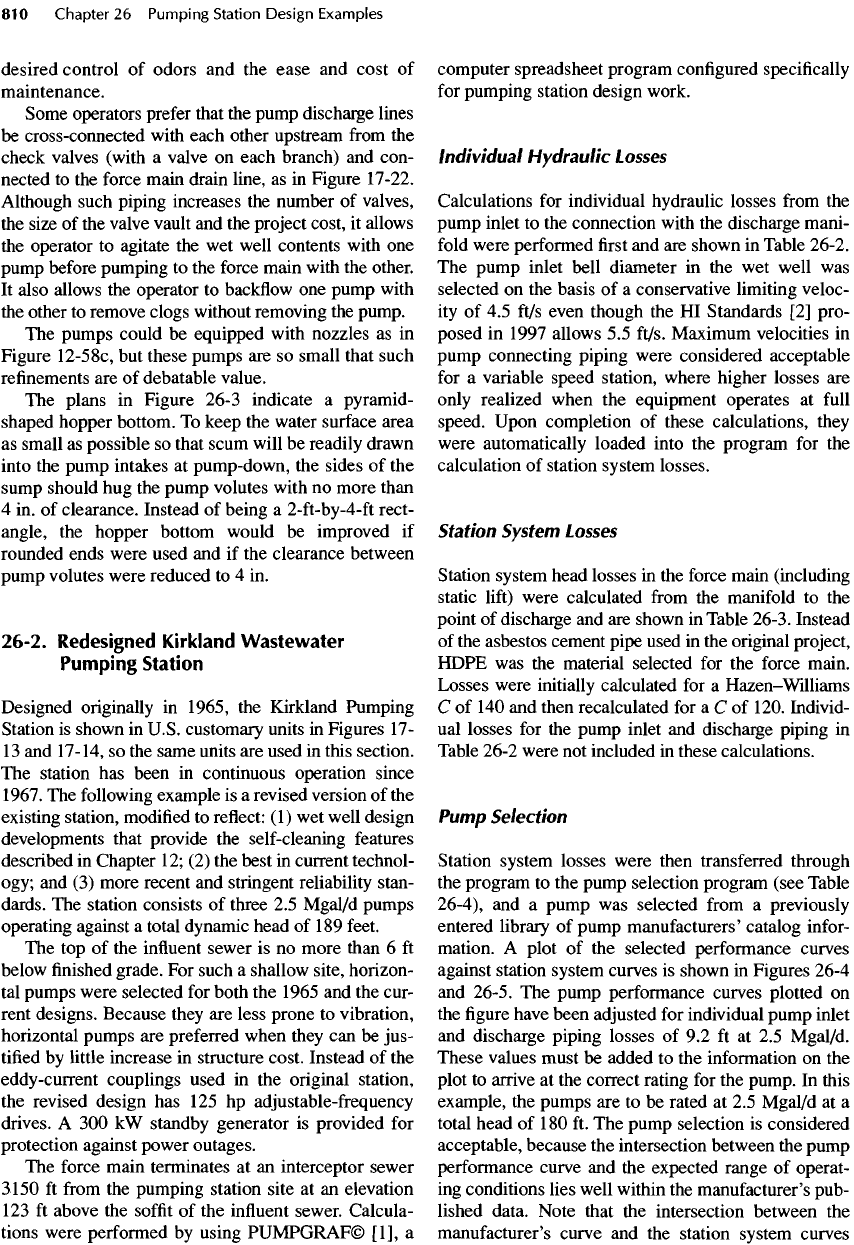
Individual
Hydraulic
Losses
Calculations
for
individual hydraulic losses
from
the
pump
inlet
to the
connection with
the
discharge mani-
fold
were performed
first and are
shown
in
Table 26-2.
The
pump inlet
bell
diameter
in the wet
well
was
selected
on the
basis
of a
conservative limiting veloc-
ity
of 4.5
ft/s even though
the HI
Standards
[2]
pro-
posed
in
1997 allows
5.5
ft/s. Maximum velocities
in
pump
connecting piping were considered acceptable
for
a
variable speed station, where higher
losses
are
only realized when
the
equipment
operates
at
full
speed. Upon completion
of
these calculations, they
were automatically loaded into
the
program
for the
calculation
of
station
system
losses.
Station
System
Losses
Station system head losses
in the
force
main (including
static
lift)
were calculated
from
the
manifold
to the
point
of
discharge
and are
shown
in
Table 26-3. Instead
of
the
asbestos cement pipe used
in the
original project,
HDPE
was the
material selected
for the
force main.
Losses were initially calculated
for a
Hazen-Williams
C
of 140 and
then recalculated
for a C of
120. Individ-
ual
losses
for the
pump inlet
and
discharge piping
in
Table 26-2 were
not
included
in
these calculations.
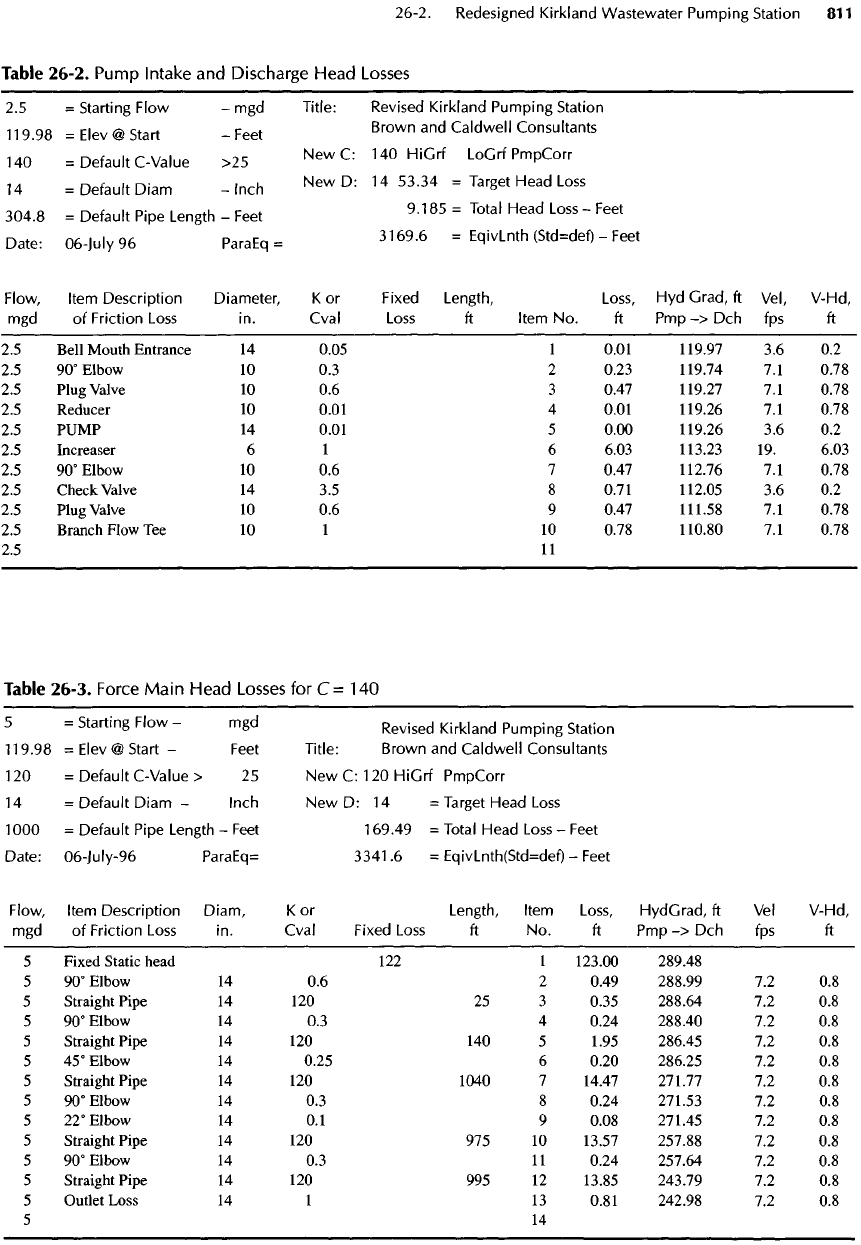
Pump
Selection
Station system losses were then transferred through
the
program
to the
pump selection program (see Table
26-4),
and a
pump
was
selected
from
a
previously
entered library
of
pump manufacturers' catalog
infor-
mation.
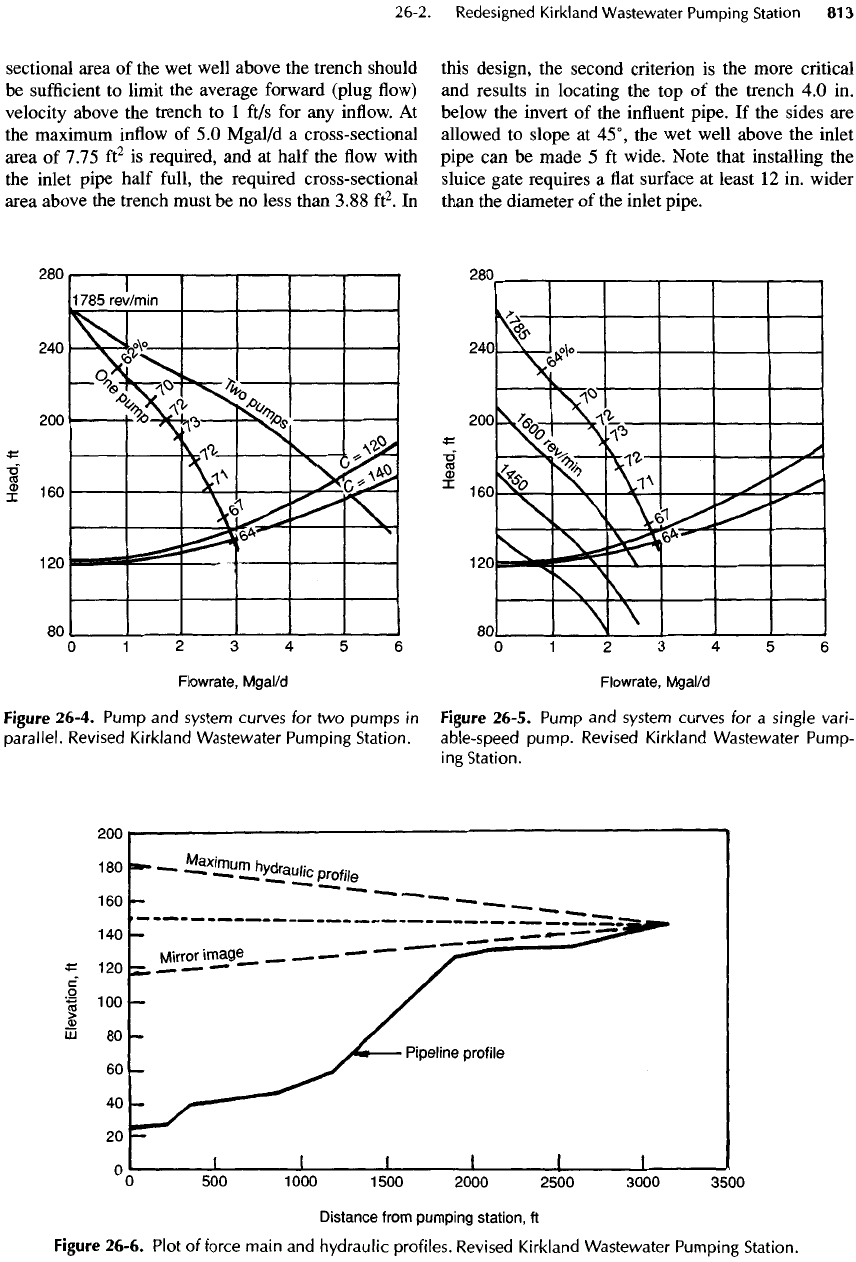
A
plot
of the
selected
performance curves
against station system curves
is
shown
in
Figures 26-4
and
26-5.
The
pump performance curves plotted
on
the figure
have been adjusted
for
individual pump inlet
and
discharge piping losses
of 9.2 ft at 2.5
Mgal/d.
These
values must
be
added
to the
information
on the
plot
to
arrive
at the
correct rating
for the
pump.
In
this
example,
the
pumps
are to be
rated
at 2.5
Mgal/d
at a
total head
of
180
ft. The
pump selection
is
considered
acceptable, because
the
intersection between
the
pump
performance curve
and the
expected range
of
operat-
ing
conditions
lies
well within
the
manufacturer's pub-
lished data. Note that
the
intersection between
the
manufacturer's
curve
and the
station system curves
Table
26-2.
Pump
Intake
and
Discharge
Head
Losses
2.5
=
Starting
Flow
- mgd
Title:
Revised
Kirkland Pumping Station
119.98
=Elev@
Start
-Feet
Brown
and
Caidwell Consultants
140
=
Default
C-Value
>25
New
C;
14
°
HiGrf
LoGrf
PmpCorr
14
=
Default
Diam
-Inch
New D: 14
53.34
=
Target Head
Loss
304.8
=
Default Pipe Length
-
Feet
9
'
185
=
Total
Head
Loss
~
Feet
Date:
06-JuIy
96
ParaEq
=
3169
'
6
=
EqivLnth
(Std=def)
-
Feet
Flow,
Item Description
Diameter,
K or
Fixed
Length,
Loss,
Hyd
Grad,
ft
VeI, V-Hd,
mgd
of
Friction
Loss
in.
Cval
Loss
ft
Item
No. ft
Pmp
-> Dch fps ft
2.5
Bell Mouth Entrance
14
0.05
1
0.01
119.97
3.6 0.2
2.5
9O
0
EIbOW
10 0.3 2
0.23
119.74
7.1
0.78
2.5
Plug Valve
10 0.6 3
0.47
119.27
7.1
0.78
2.5
Reducer
10
0.01
4
0.01
119.26
7.1
0.78
2.5
PUMP
14
0.01
5
0.00
119.26
3.6 0.2
2.5
Increaser
6 1 6
6.03
113.23
19.
6.03
2.5
9O
0
EIbOw
10 0.6 7
0.47
112.76
7.1
0.78
2.5
Check Valve
14 3.5 8
0.71
112.05
3.6 0.2
2.5
Plug Valve
10 0.6 9
0.47
111.58
7.1
0.78
2.5
Branch Flow
Tee 10 1 10
0.78
110.80
7.1
0.78
2.5 11
Table
26-3.
Force
Main
Head
Losses
for
C=
140
5
=
Starting
Flow
-
mgd
Revjsed
Kirk
|
and
p
umping
Station
119.98
=Elev@
Start-
Feet
Title: Brown
and
Caidwell Consultants
120
=
Default C-Value
> 25 New C:
120
HiGrf PmpCorr
14
=
Default Diam
-
Inch
New D: 14 =
Target
Head
Loss
1000
=
Default Pipe Length
-
Feet
169.49
=
Total
Head
Loss
-
Feet
Date:
06-luly-96
ParaEq=
3341.6
=
EqivLnth(Std=def)
-
Feet
Flow, Item Description Diam,
K or
Length, Item
Loss,
HydGrad,
ft VeI
V-Hd,
mgd of
Friction
Loss
in.
Cval
Fixed
Loss
ft No. ft Pmp -> Dch fps ft
5
Fixed Static head
122 1
123.00
289.48
5
9O
0
EIbOw
14 0.6 2
0.49
288.99
7.2 0.8
5
Straight
Pipe
14 120 25 3
0.35
288.64
7.2 0.8
5
9O
0
EIbOW
14 0.3 4
0.24
288.40
7.2 0.8
5
Straight Pipe
14 120 140 5
1.95
286.45
7.2 0.8
5
45°Elbow
14
0.25
6
0.20
286.25
7.2 0.8
5
Straight Pipe
14 120
1040
7
14.47
271.77
7.2 0.8
5
9O
0
EIbOw
14 0.3 8
0.24
271.53
7.2 0.8
5
22°Elbow
14 0.1 9
0.08
271.45
7.2 0.8
5
Straight Pipe
14 120 975 10
13.57
257.88
7.2 0.8
5
9O
0
EIbOw
14 0.3 11
0.24
257.64
7.2 0.8
5
Straight Pipe
14 120 995 12
13.85
243.79
7.2 0.8
5
Outlet Loss
14 1 13
0.81
242.98
7.2 0.8
5 14
lies
to the right of the
pump's best
efficiency
point.
As
speed
is
reduced
in
variable speed operation,
the
point
of
intersection
of the
curves passes through
the
pump's
zone
of
best
efficiency.
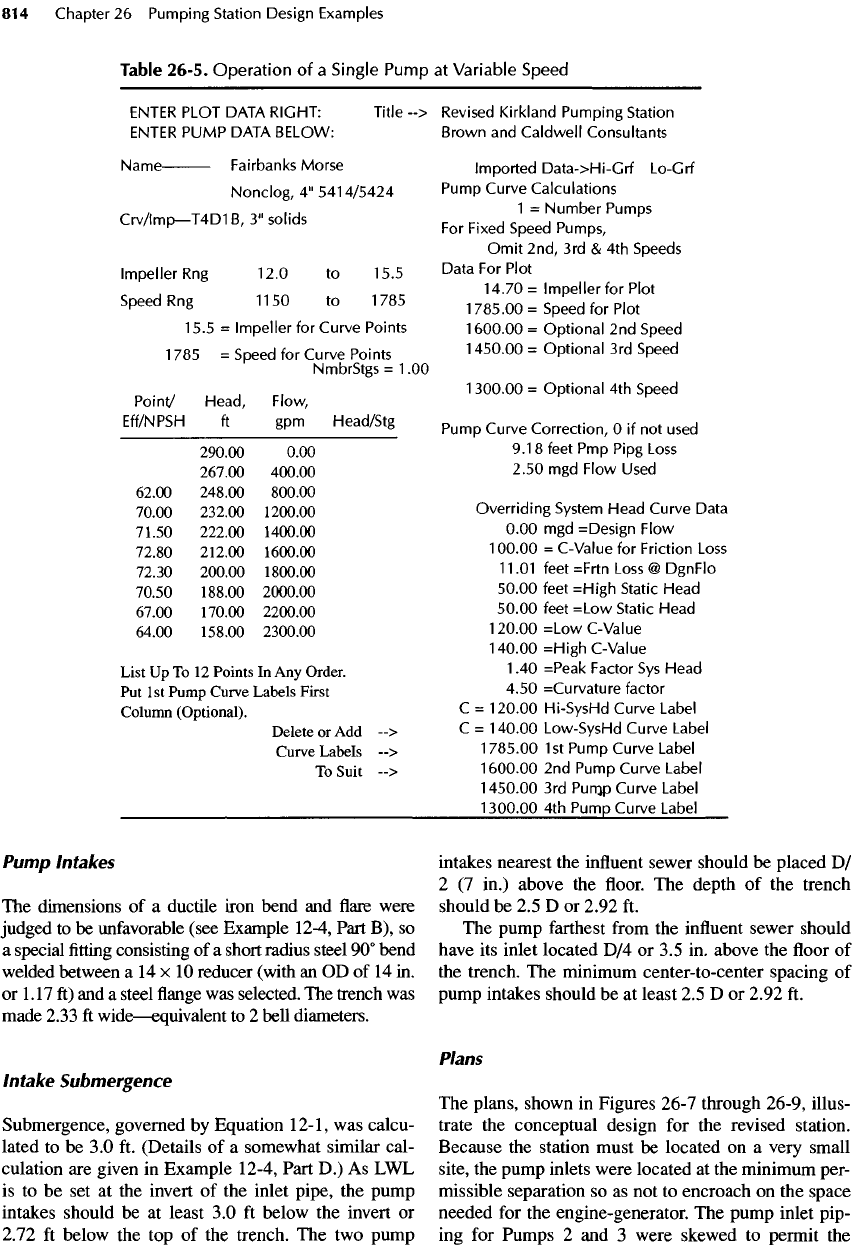
After
an
acceptable pump selection
was
found,
the
program
was
used
to
evaluate pump performance
at
variable speed,
and
these data
are
shown
in
Table
26-5
and
in
Figure 26-5.
As
indicated,
the
minimum operat-
ing
speed
is
approximately
1300
rev/min,
which corre-
sponds
to a
rate
of
discharge
of 0.6
Mgal/d.
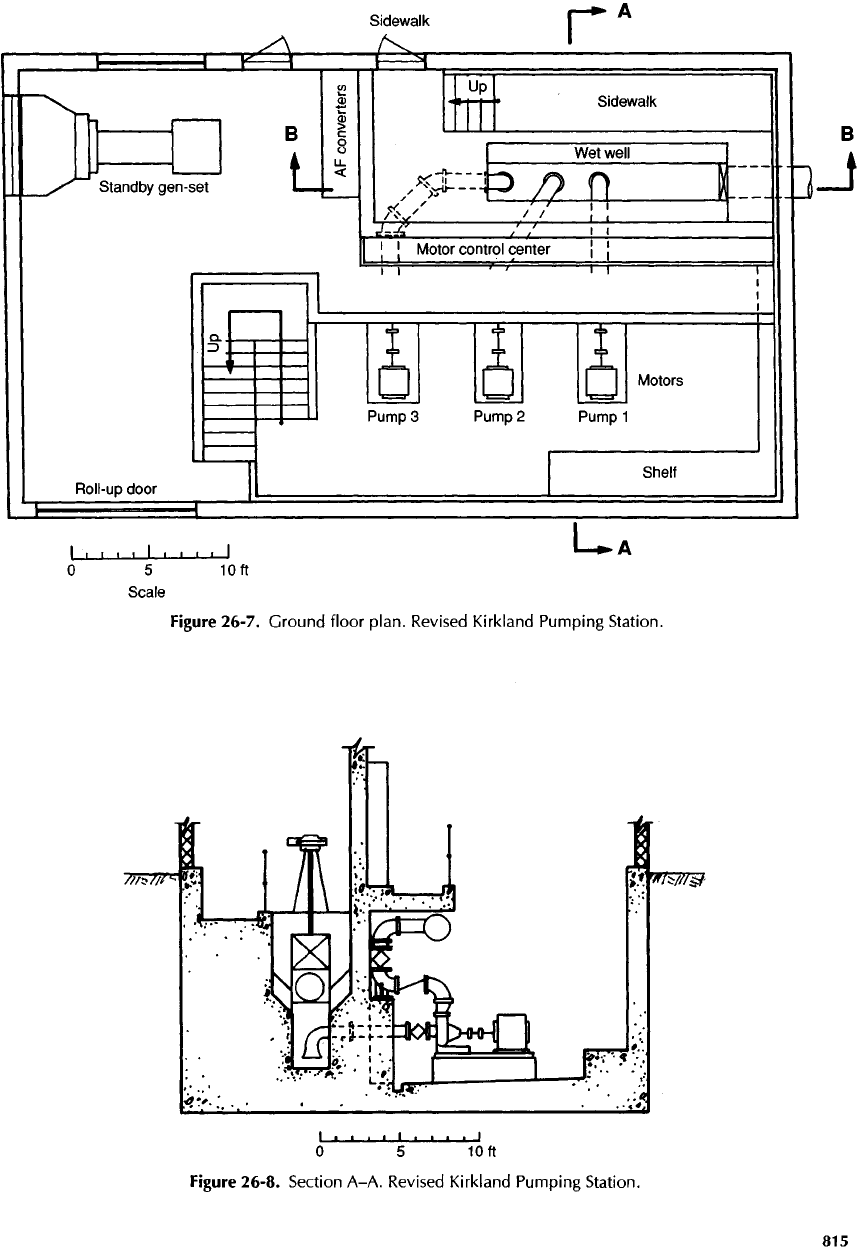
Hydraulic
Profile
Next,
a
plot
of the
force main
and
hydraulic profiles
was
constructed,
as
shown
in
Figure
26-6.
The
purpose
of
this
exercise
was to
provide
a
visual portrayal
of
hydraulic
conditions
in the
system
at
both minimum
and
maximum
system
capacity. From
an
inspection
of the
plot,
it was
found
that
the
hydraulic profile remains well above
the
force
main
profile
from
the
pumping station
to the
point
of
discharge under
all
operating conditions.
In
addition, there
appeared
to be no
high points
or
knees that would
be the
location
of
column separation
in a
hydraulic transient con-
dition. Finally,
the
pipe line
profile
does
not
touch
the
mir-
ror
image line,
so
column separation does
not
appear
to be
a
problem
(see
Section
7-1).
For a
21
-in.
force main con-
structed
of
HDPE,
the
wave propagation velocity
is
about
a
third
of
that
for
ductile iron
or
cement asbestos
(refer
to
Chapter
7).
Based
on
inspection
of the
force
main/hydrau-
lic
profile
plots
and the low
wave propagation velocity,
no
formal
transient analysis
was
judged
to be
necessary.
Geometry
The
station capacity
is 5
Mgal/d
or
7.75
ft
3
/s.
From
the
principles presented
in
Chapter
12, the
cross-
Name
Fairbanks
Morse
Nonclog,
4"
5414/5424
Crv/lmp—
T4D1
B,
3"
solids
Impeller
Rng
12.0
to
15.5
Speed
Rng
1 1
50
to
1
785
1
5.5
=
Impeller
for
Curve Points
1
785
=
Speed
for
Curve Points
Point/
Head,
Flow,
Eff/NPSH
ft
gpm
Head/Stg
290.00
0.00
267.00
400.00
62.00 248.00 800.00
70.00 232.00 1200.00
71.50 222.00
1400.00
72.80 212.00
1600.00
72.30
200.00 1800.00
70.50 188.00
2000.00
67.00 170.00 2200.00
64.00 158.00 2300.00
List
Up To 12
Points
In Any
Order.
Put
1st
Pump
Curve
Labels
First
Column
(Optional).
Imported
Data->Hi-Grf
Lo-G
rf
Pump Curve Calculations
2
=
Number
Pumps
For
Fixed Speed Pumps,
Omit
2nd,
3rd & 4th
Speeds
Data
For
Plot
14.70=
Impeller
for
Plot
1785.00=
Speed
for
Plot
=
Optional
2nd
Speed
=
Optional
3rd
Speed
=
Optional
4th
Speed
Pump Curve
Correction,
O if not
used
9.18feetPmpPipgLoss
2.50
mgd
Flow Used
Overriding
System Head Curve Data
0.00
mgd
=Design Flow
100.00
=
C-
Value
for
Friction
Loss
11
.01
feet
=Frtn
Loss
@
DgnFlo
50.00
feet
=High
Static Head
50.00
feet =Low Static Head
120.00
=Low
C-
Value
140.00
=High
C-
Value
1
.40
=Peak Factor
Sys
Head
C
=
120.00
Hi-SysHd Curve Label
C
=
140.00
Low-SysHd Curve Label
1
785.00
1 st
Pump Curve Label
Table
26-4.
Pump
Selection
for Two
Pumps
Operating
ENTER
PLOT DATA RIGHT: Title
-->
Revised Kirkland Pumping Station
ENTER
PUMP DATA BELOW: Brown
and
Caldwell
Consultants
Delete
or
Add --> 2nd
Pump Curve Label
Curve
Labels
--> 3rd
Pump Curve Label
To
Suit
--> 4th
Pump Curve Label
sectional area
of the wet
well above
the
trench should
be
sufficient
to
limit
the
average forward (plug
flow)
velocity above
the
trench
to 1
ft/s
for any
inflow.
At
the
maximum
inflow
of 5.0
Mgal/d
a
cross-sectional
area
of
7.75
ft
2
is
required,
and at
half
the flow
with
the
inlet pipe half
full,
the
required cross-sectional
area above
the
trench must
be no
less
than 3.88
ft
2
.
In
Figure
26-4.
Pump
and
system
curves
for two
pumps
in
parallel.
Revised
Kirkland
Wastewater
Pumping
Station.
this design,
the
second criterion
is the
more critical
and
results
in
locating
the top of the
trench
4.0 in.
below
the
invert
of the
influent
pipe.
If the
sides
are
allowed
to
slope
at
45°,
the wet
well above
the
inlet
pipe
can be
made
5 ft
wide. Note that installing
the
sluice gate requires
a flat
surface
at
least
12 in.
wider
than
the
diameter
of the
inlet
pipe.
Figure
26-5.
Pump
and
system
curves
for a
single
vari-
able-speed
pump.
Revised
Kirkland
Wastewater
Pump-
ing
Station.
Figure 26-6.
Plot
of
force
main
and
hydraulic
profiles.
Revised
Kirkland
Wastewater
Pumping
Station.
Pump
Intakes
The
dimensions
of a
ductile iron bend
and flare
were
judged
to be
unfavorable
(see Example 12-4, Part
B), so
a
special
fitting
consisting
of a
short radius steel
90°
bend
welded
between
a 14 x 10
reducer
(with
an OD of 14 in.
or
1
.
17
ft) and a
steel
flange was
selected.
The
trench
was
made
2.33
ft
wide
—
equivalent
to 2
bell diameters.
Intake
Submergence
Submergence,
governed
by
Equation
12-1,
was
calcu-
lated
to be 3.0 ft.
(Details
of a
somewhat similar
cal-
culation
are
given
in
Example 12-4, Part
D.) As LWL
is to be set at the
invert
of the
inlet pipe,
the
pump
intakes
should
be at
least
3.0 ft
below
the
invert
or
2.72
ft
below
the top of the
trench.
The two
pump
intakes nearest
the
influent
sewer should
be
placed
D/
2 (7
in.)
above
the floor. The
depth
of the
trench
should
be 2.5 D or
2.92
ft.
The
pump
farthest
from
the
influent
sewer should
have
its
inlet located
D/4 or 3.5 in.
above
the floor of
the
trench.
The
minimum center-to-center spacing
of
pump
intakes should
be at
least
2.5 D or
2.92
ft.
Plans
The
plans, shown
in
Figures 26-7 through 26-9, illus-
trate
the
conceptual design
for the
revised station.
Because
the
station must
be
located
on a
very small
site,
the
pump inlets were located
at the
minimum per-
missible separation
so as not to
encroach
on the
space
needed
for the
engine-generator.
The
pump inlet
pip-
ing
for
Pumps
2 and 3
were skewed
to
permit
the
Table
26-5.
Operation
of a
Single Pump
at
Variable Speed
ENTER
PLOT DATA RIGHT:
Title
-->
Revised Kirkland
Pumping
Station
ENTER
PUMP
DATA BELOW: Brown
and
Caldwell
Consultants
Name
Fairbanks Morse
Imported
Data->Hi-Grf
Lo-Grf
Nonclog,
4"
5414/5424
Pump Curve Calculations
„
/,
-r^r^iD
0»
i-j
1 =
Number
Pumps
Crv/!mp—T4D1B,
3"
solids
.-
...
,
c
,
D
M
For
Fixed Speed
Pumps,
Omit
2nd,
3rd & 4th
Speeds
Impeller
Rng
12.0
to
15.5
Data
For
Plot
14.70=
Impeller
for
Plot
Speed
Rng
1150
to
1785
!
7
85.OO
=
Speed
for
Plot
15.5
=
Impeller
for
Curve Points
1600.00
=
Optional
2nd
Speed
1
785
=
Speed
for
Curve Points
1450
-°°
=
Optional
3rd
Speed
NmbrStgs
=
1.00
1300.00
=
Optional
4th
Speed
Point/
Head,
Flow,
Eff/NPSH
ft
gpm
Head/Stg
Rump
Curye
Correction/
0
jf
not
used
290.00
0.00
9-
1
8
feet
Pmp
Pipg
Loss
267.00
400.00
2.50
mgd
Flow Used
62.00 248.00 800.00
70.00
232.00
1200.00
Overriding
System
Head
Curve Data
71.50 222.00
1400.00
0-00
m
gd
=Design
Flow
72.80
212.00
1600.00
1
°°-
00
=
C-Value
for
Friction
Loss
72.30
200.00
1800.00
11
-
01
f
get
=
Fr
tn
Loss
@
DgnFlo
70.50 188.00
2000.00
50.00
feet
=High
Static
Head
67.00
170.00
2200.00
50.00
feet
=Low
Static
Head
64.00 158.00 2300.00
120.00
=Low
C-Value
140.00
=High
C-Value
List
Up To 12
Points
In Any
Order.
1
-40
=Peak Factor
Sys
Head
Put 1st
Pump
Curve
Labels
First
4.50
=Curvature factor
Column
(Optional).
C =
120.00
Hi-SysHd
Curve Label
Delete
or Add -->
c
=
140.00
Low-SysHd Curve Label
Curve
Labels
-->
1785.00
1 st
Pump Curve Label
To
Suit
-->
1600.00
2nd
Pump Curve Label
1450.00
3rd
Purnp
Curve Label
1300.00
4th
Pump Curve Label
Figure
26-7. Ground floor plan.
Revised
Kirkland Pumping Station.
Figure
26-8. Section A-A.
Revised
Kirkland Pumping Station.
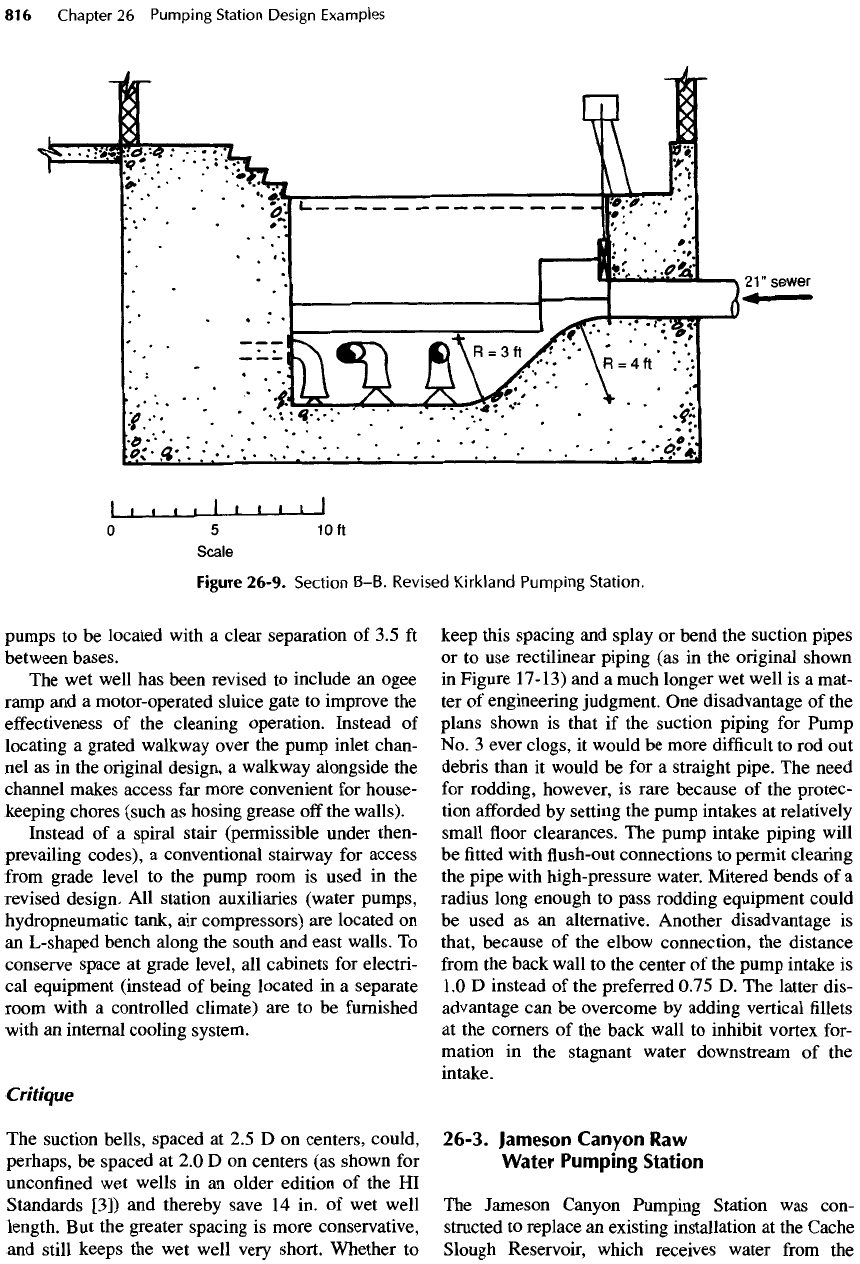
pumps
to be
located
with
a
clear separation
of 3.5 ft
between
bases.
The wet
well
has
been revised
to
include
an
ogee
ramp
and a
motor-operated sluice gate
to
improve
the
effectiveness
of the
cleaning operation. Instead
of
locating
a
grated
walkway
over
the
pump inlet chan-
nel as in the
original design,
a
walkway alongside
the
channel
makes access
far
more convenient
for
house-
keeping chores (such
as
hosing grease
off the
walls).
Instead
of a
spiral stair (permissible under then-
prevailing
codes),
a
conventional stairway
for
access
from
grade level
to the
pump room
is
used
in the
revised design.
All
station auxiliaries (water pumps,
hydropneumatic
tank,
air
compressors)
are
located
on
an
L-shaped bench along
the
south
and
east walls.
To
conserve space
at
grade level,
all
cabinets
for
electri-
cal
equipment (instead
of
being located
in a
separate
room with
a
controlled climate)
are to be
furnished
with
an
internal cooling system.
Critique
The
suction bells, spaced
at 2.5 D on
centers, could,
perhaps,
be
spaced
at 2.0 D on
centers
(as
shown
for
unconfined
wet
wells
in an
older edition
of the HI
Standards
[3])
and
thereby save
14 in. of wet
well
length.
But the
greater spacing
is
more conservative,
and
still
keeps
the wet
well very short. Whether
to
keep this spacing
and
splay
or
bend
the
suction pipes
or to use
rectilinear piping
(as in the
original shown
in
Figure
17-13)
and a
much longer
wet
well
is a
mat-
ter of
engineering judgment.
One
disadvantage
of the
plans shown
is
that
if the
suction piping
for
Pump
No. 3
ever clogs,
it
would
be
more
difficult
to rod out
debris
than
it
would
be for a
straight
pipe.
The
need
for
rodding, however,
is
rare because
of the
protec-
tion
afforded
by
setting
the
pump intakes
at
relatively
small
floor
clearances.
The
pump intake piping will
be fitted
with
flush-out
connections
to
permit clearing
the
pipe
with high-pressure water. Mitered bends
of a
radius long enough
to
pass rodding equipment could
be
used
as an
alternative. Another disadvantage
is
that, because
of the
elbow connection,
the
distance
from
the
back wall
to the
center
of the
pump intake
is
1.0 D
instead
of the
preferred
0.75
D. The
latter
dis-
advantage
can be
overcome
by
adding vertical
fillets
at
the
corners
of the
back wall
to
inhibit vortex for-
mation
in the
stagnant water downstream
of the
intake.
26-3. Jameson Canyon
Raw
Water
Pumping
Station
The
Jameson Canyon Pumping Station
was
con-
structed
to
replace
an
existing installation
at the
Cache
Slough Reservoir, which receives water
from
the
Figure
26-9. Section B-B.
Revised
Kirkland
Pumping Station.
Sacramento River system
and
delivers
it to the
City
of
Vallejo,
California, Fleming Hill Water Treatment
Plant.
In
addition
to the new
pumping station,
the
project
included construction
of a
parallel pipeline
from
the
reservoir
to the
treatment plant
on an
align-
ment
through Gordon Valley.
The
original station,
which
has
been retained
and
modified
to
function
as a
reserve
facility,
was
found
to be
troublesome because
of
capacity-limiting inlet conditions
and
other defects.
In
addition
to
other problems,
the
station
was
some-
times
troubled
by
accumulations
of
silt
in the
reservoir.
Vertical
turbine pumps were selected
for the new
station,
because
it
could
be
constructed without
the
cost
of a
pump room below ground level. Three
pumps
were installed initially, although there
is a
position
for a
fourth.
Each pump
has a
nominal capac-
ity
of 416 L/s
(9.5
Mgal/d).
The new
pumping station
can
receive water
from
three sources,
all
with
differing
energy gradients.
To
limit
costs
and
provide acceptable sump levels
for
operation with
any
source,
a
modulating
butterfly
valve
(installed upstream
from
the
station
but
down-
stream
from
the
connection
to the
three sources) oper-
ates
to
maintain
a fixed
level
in the
pump sump.
The
siltation
problem noted
in the
operation
of the
exist-
ing
station dictated
a
sump
configuration
that could
avoid
accumulations
of the
silt that hampered
the
operation
of the
existing
station.
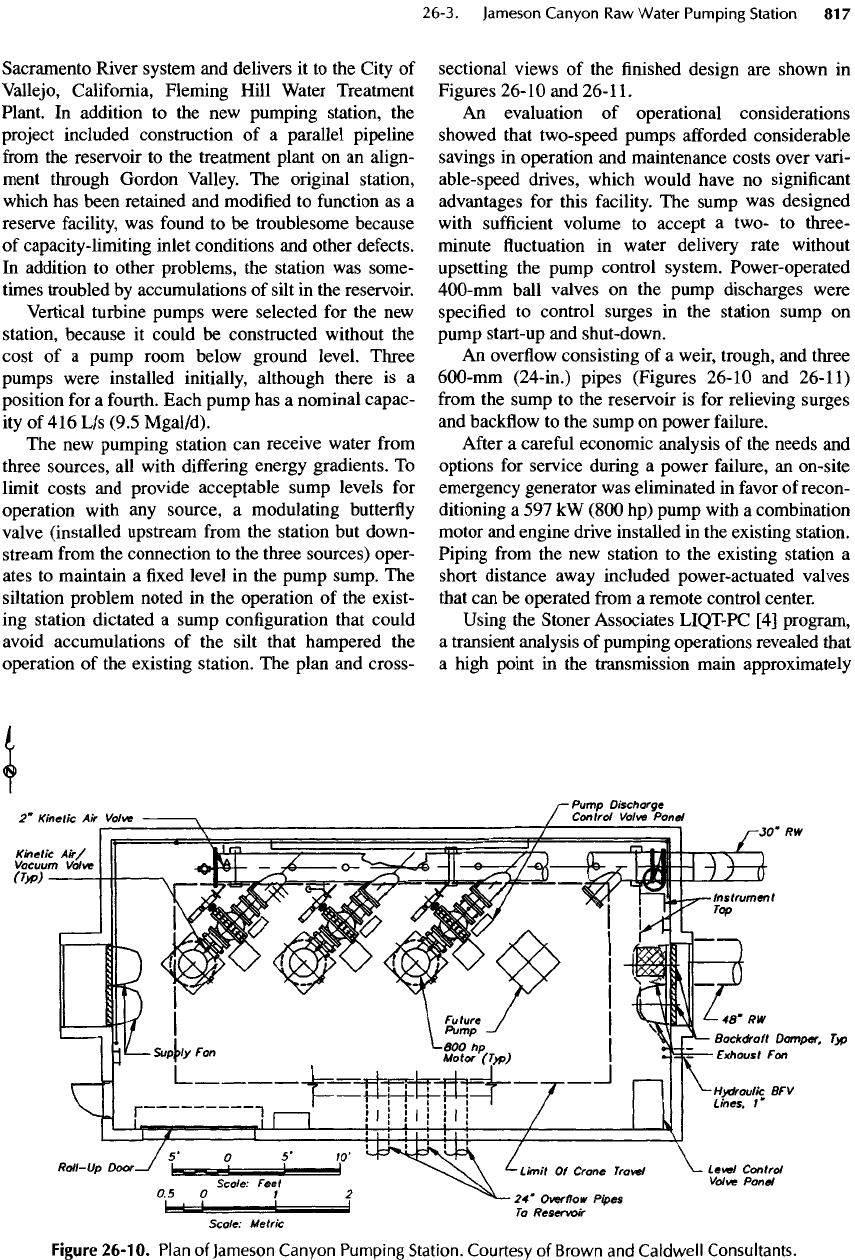
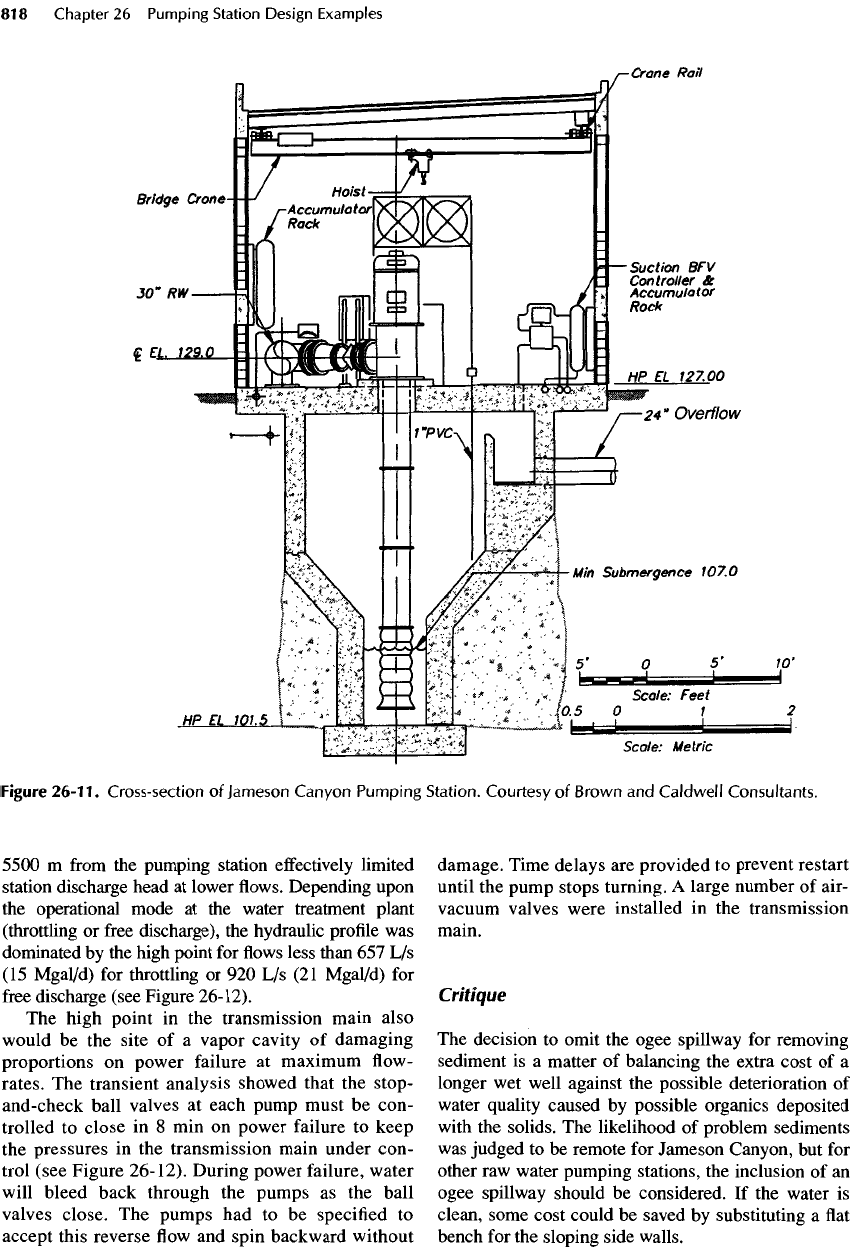
The
plan
and
cross-
sectional views
of the finished
design
are
shown
in
Figures 26-10
and
26-11.
An
evaluation
of
operational considerations
showed
that two-speed pumps
afforded
considerable
savings
in
operation
and
maintenance costs over vari-
able-speed drives, which would have
no
significant
advantages
for
this facility.
The
sump
was
designed
with
sufficient
volume
to
accept
a
two-
to
three-
minute
fluctuation in
water delivery rate without
upsetting
the
pump control system. Power-operated
400-mm
ball valves
on the
pump discharges were
specified
to
control surges
in the
station sump
on
pump
start-up
and
shut-down.
An
overflow
consisting
of a
weir, trough,
and
three
600-mm
(24-in.) pipes (Figures 26-10
and
26-11)
from
the
sump
to the
reservoir
is for
relieving surges
and
backflow
to the
sump
on
power failure.
After
a
careful
economic analysis
of the
needs
and
options
for
service during
a
power
failure,
an
on-site
emergency generator
was
eliminated
in
favor
of
recon-
ditioning
a 597 kW
(800
hp)
pump with
a
combination
motor
and
engine drive installed
in the
existing station.
Piping
from
the new
station
to the
existing station
a
short
distance away included power-actuated valves
that
can be
operated
from
a
remote control center.
Using
the
Stoner Associates LIQT-PC
[4]
program,
a
transient analysis
of
pumping operations revealed that
a
high point
in the
transmission main approximately
Figure
26-10.
Plan
of
Jameson
Canyon
Pumping
Station. Courtesy
of
Brown
and
Caldweli
Consultants.
5500
m
from
the
pumping station
effectively
limited
station
discharge head
at
lower
flows.
Depending upon
the
operational mode
at the
water treatment plant
(throttling
or
free
discharge),
the
hydraulic
profile
was
dominated
by the
high point
for flows
less than
657 L/s
(15
Mgal/d)
for
throttling
or 920 L/s (21
Mgal/d)
for
free
discharge (see Figure
26-12).
The
high point
in the
transmission main also
would
be the
site
of a
vapor cavity
of
damaging
proportions
on
power failure
at
maximum
flow-
rates.
The
transient analysis showed that
the
stop-
and-check ball valves
at
each pump must
be
con-
trolled
to
close
in 8 min on
power failure
to
keep
the
pressures
in the
transmission main under con-
trol (see Figure 26-12). During power failure, water
will
bleed back through
the
pumps
as the
ball
valves
close.
The
pumps
had to be
specified
to
accept this reverse
flow and
spin backward without
damage. Time delays
are
provided
to
prevent restart
until
the
pump stops turning.
A
large number
of
air-
vacuum
valves were installed
in the
transmission
main.
Critique
The
decision
to
omit
the
ogee spillway
for
removing
sediment
is a
matter
of
balancing
the
extra cost
of a
longer
wet
well against
the
possible
deterioration
of
water
quality caused
by
possible organics deposited
with
the
solids.
The
likelihood
of
problem sediments
was
judged
to be
remote
for
Jameson Canyon,
but for
other
raw
water pumping stations,
the
inclusion
of an
ogee spillway should
be
considered.
If the
water
is
clean, some cost could
be
saved
by
substituting
a flat
bench
for the
sloping side walls.
Figure
26-11.
Cross-section
of
Jameson
Canyon
Pumping
Station. Courtesy
of
Brown
and
Caldwell
Consultants.