R?ssler U. Solid State Theory: An Introduction
Подождите немного. Документ загружается.

4.5 The Dielectric Function 105
The inverse dielectric function has poles at ω = ±ω
m0
− iΓ in the
lowe r complex ω-plane (see Fig. 3.5), thus measurements of 1/ε(q,ω)pro-
vide information about the exact excitation energies ¯hω
m0
= E
m
− E
0
. Such
experiments are p erformed as inelastic scattering of charged particles (elec-
trons), in which energy and momentum is transferred to the electron system.
This experimental technique is known as energy–loss spectroscopy.
Let us evaluate the inverse dielectric function at T = 0 K in HF approx-
imation. This is done by calculating the matrix elements of the number
fluctuations between the HF ground state (which is the fill ed Fermi sphere)
and excited states, which are obtained by removing a n electron from the
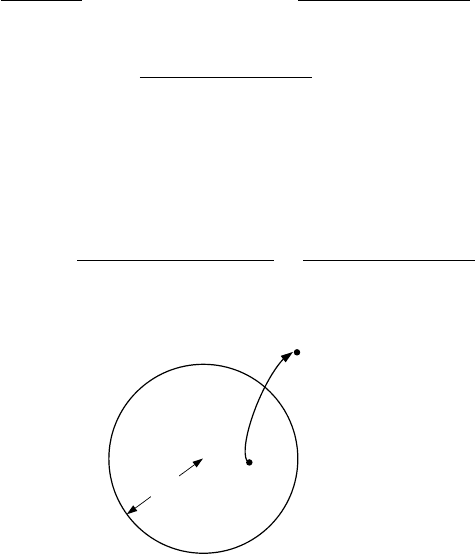
Fermi sphere and placing it into a state outside (see Fig. 4.14). In other words,
the excited states are the Fermi sp here plus an electron–hole excitation. The
matrix elements can be evaluated and yield
ˆ
N
q
=
kσ
c
†
k+qσ
c
kσ
Ψ
kqσ
|
ˆ
N
q
′
|Ψ
0
=
δ
qq
′
|k|≤k
F
, |k + q| >k
F
0otherwise
(4.118)
and one finds (with ¯hΓ=δ)
1
ε
HF
(q,ω)
= 1 + lim
δ→0
v
q
|k|≤k
F
,σ
|k+q|>k
F
1
¯hω + ǫ
k+q
− ǫ
k
+iδ
−
1
¯hω − ǫ
k+q
+ ǫ
k
+iδ
. (4.119)
Here the energies ǫ
k
ought to be the HF single particle energies, but can be
replaced by ¯h
2
k
2
/2m which is a good approximation for r
s
≪ 1. The restricted
sum can be considered by using the Fermi distribution function f
k
and if in
addition we replace in the fi rst term k + q →−k the rhs of (
4.119)reads
= 1 + lim
δ→0
v
q
k,σ
f
−k−q
(1 − f
−k
)
¯hω + ǫ
−k
− ǫ
−k−q
+iδ
−
f
k
(1 − f
k+q
)
¯hω − ǫ
k+q
+ ǫ
k
+iδ
. (4.120)
k
F
k,σ
k+q,σ
Fig. 4.14. Schematic view of an excited state: Fermi sphere plus electron–hole pair
106 4 The Free Electron Gas
Finally with f
−k
= f
k
, ǫ
k
= ǫ
−k
,andf
k
f
k+q
= 0 (one of the states is not
occupied) one obtains
1
ε
HF
(q,ω)
=1+v
q
π
0
(q,ω) (4.121)
where
π
0
(q,ω) = lim
δ→0
k,σ
f
k
− f
k+q
¯hω − ǫ
k+q
+ ǫ
k
+iδ
. (4.122)
is the polarization function of the free noninteracting electron system.
A standard approximation for the inverse longitudinal dielectric function
beyond HF is the so-called random phase appr oximation or RPA. Although its
derivation in the original literature (where also the name is justified) is quite
involved (see [
5]) it can be obtained simply by replacing the bare Coulomb
interaction v
q
by the screened on e v
q
/ε(q,ω). This gives rise to the following
formulation:
1
ε(q,ω)
=1+
v
q
ε(q,ω)
π
0
(q,ω)
=1+v
q
π
0
(q,ω)
1+v
q
π
0
(q,ω)(1 + v
q
π
0
(q,ω)(...))
=1+v
q
π
0
(q,ω)+
v
q
π
0
(q,ω)
2
+ ...
=
1
1 − v
q
π
0
(q,ω)
. (4.123)
The structure of this expression, reminding of the Born series known from scat-
tering theory, is typical for results obtained for interacting particles and can
be cast into a graphic representation in terms of Feynman diagrams [
4, 5, 64].
Here we give only the formula for the dielectric function in RPA, also known
as the Lindhard function,
ε
RPA
(q,ω)=1− v
q
π
0
(q,ω)
=1− v
q
lim
δ→0
k,σ
f
k
− f
k+q
¯hω − ǫ
k+q
+ ǫ
k
+iδ
. (4.124)
It should be mentioned, that this result which goes beyond the HF appr oxima-
tion, is not obtained by a more accurate description o f the eigenstates rather
than by the physical argument o f screening applied to the electron–electron
interaction in the system. The same result can be obtained in an alterna-
tive way known as the self-consistent field approximation. The idea here is to
consider the induced number density fluctuations together with the external
charge as the perturbation of the system but evaluate the response with the
HF ground state. This calculation is the subject of Problem 4 .9.
4.6 Discussion of the Dielectric Function 107
4.6 Di scuss i on of the Dielectric Function
Starting from (
4.117), the exact expression for the inverse longitudinal dielec-
tric function at T =0Kcanbeseparatedwith
lim
δ→0
1
x ± iδ
= P
1
x
!
∓ iπδ(x) (4.125)
into its real and imaginary part:
Re
1
ε(q,ω)
=1+v
q
m
|Ψ
0
|
ˆ
N
q
|Ψ
m
|
2
2¯hω
m0
(¯hω)
2
− (¯hω
m0
)
2
(4.126)
Im
1
ε(q,ω)
= −πv
q
m
|Ψ
0
|
ˆ
N
q
|Ψ
m
|
2
{δ(¯hω −¯hω
m0
) − δ(¯hω +¯hω
m0
)}.
(4.127)
In Sect.
1.3 we have introduced the dynamic structure factor
S(q,ω)=
1
2π
∞
−∞
e
−iωt
ˆ
N
q
(t)
ˆ
N
−q
(0)dt (4.128)
which for T = 0 K (after resolving the Heisenberg picture for
ˆ
N
q
(t), introduc-
ing a complete set of exact eigenstates, and performing the integratio n over t)
takes the form
S(q,ω)=
m
|Ψ
0
|
ˆ
N
q
|Ψ
m
|
2
δ(ω − ω
m0
). (4.129)
Thus it is possible to express the imaginary part of the dielectric functio n as
Im
1
ε(q,ω)
= −
π
¯h
v
q
S(q,ω) − S(q, −ω)
. (4.130)
Moreover, the differential cross section for inelastic scattering is related with
the dynamic structure factor:
d
2
σ
dΩdω
=
k
′
k
m
2π¯h
2
|v
q
|
2
S(q,ω). (4.131)
This relation tells us how to extract information about the excitations in the
interacting electron system from inelastic scattering exp eriments: The cross-
section will be enhanced if the experimental settings, q and ω, corresp ond
to the energy and momentum of an excitation in the electron system. The
structure facto r or likewise the dielectric function can be expressed in terms
of the characteristic excitation energies of the system. Due to this relation
Im(1/ε(q,ω) is known also as the energy–loss function.
In order to discuss this in more d etail, we look at the dielectric function
in RPA ε
RPA
(q,ω)=ε
1
(q,ω)+iε
2
(q,ω)with

108 4 The Free Electron Gas
ε
1
(q,ω)=1+v
q
kσ
f
k+q
− f
k
¯hω − ǫ
k+q
+ ǫ
k
(4.132)
ε
2
(q,ω)=πv
q
kσ
(f
k
− f
k+q
) δ(¯hω − ǫ
k+q
+ ǫ
k
) . (4.133)
The energy–loss function can be written in terms of ε
1
(q,ω)andε
2
(q,ω)as
Im
1
ε(q,ω)
= −
ε
2
(q,ω)
(ε
1
(q,ω))
2
+(ε
2
(q,ω))
2
. (4.134)
The numerator ε
2
(q,ω) gives nonvanishing contributions only for
¯hω = ǫ
k+q
− ǫ
k
=
¯h
2
2m
(2k + q) · q (4.135)
which in view of the particle–hole excitations out of the Fermi sphere is possi-
ble at ¯hω =0forallq with 0 ≤|q|≤2k
F
and for ¯hω > 0 for the same range
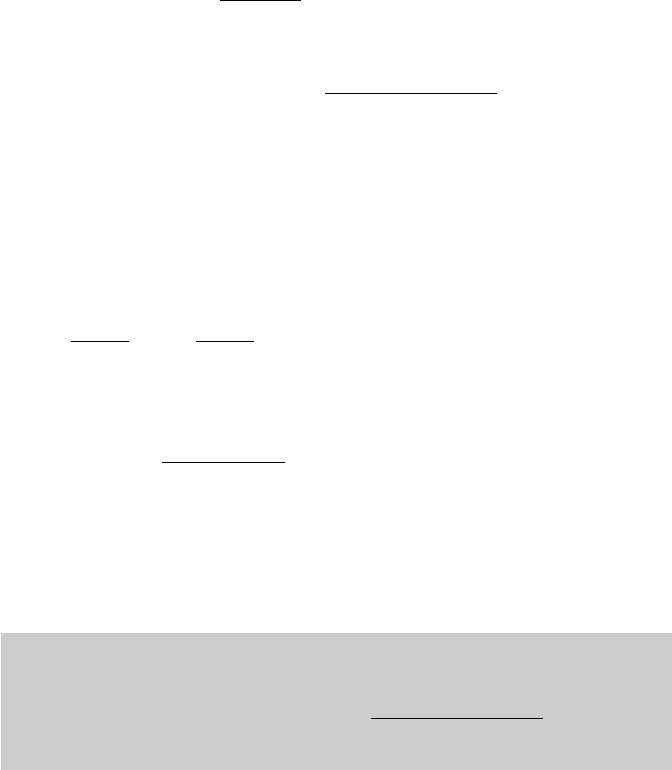
of |q| but shifted to higher values. This excitation spectrum is known as the
particle–hole continuum (see Fig. 4.15).
Significant contributions to the en ergy-loss function are also expected if
the denominator in (
4.134) vanishes, i.e., for ε
1
(q,ω)=ε
2
(q,ω)=0.Letus
consider the case ¯hω ≫ ǫ
k+q
− ǫ
k
for which ε
2
(q,ω) = 0 and (after replacing
k + q in the first term of ε
1
(q,ω)byk)
ε
1
(q,ω)=1+v
q
kσ
f
k
¯hω − ǫ
k
+ ǫ
k−q
−
f
k
¯hω − ǫ
k+q
+ ǫ
k
=1+v
q
kσ
f
k
2ǫ
k
− ǫ
k+q
− ǫ
k−q
(¯hω − ǫ
k
+ ǫ
k−q
)(¯hω − ǫ
k+q
+ ǫ
k
)
. (4.136)
Using ǫ
k
=¯h
2
k
2
/2m, the numerator can be rewritten as −¯h
2
q
2
/m,andsim-
plifying the denominator for ¯hω ≫ ǫ
k+q
− ǫ
k
, one obtains for sufficiently
small |q|
plasmon
particle - hole
continuum
ω(q)
q/2k
F
1
Fig. 4.15. The spectrum of excitations derived from the energy–loss function: RPA
spectrum
4.6 Discussion of the Dielectric Function 109
ε
1
(q,ω) ≃ 1 − v
q
¯h
2
q
2
m
1
(¯hω)
2
k
f
k
=1−
Ne
2
ε
0
Vmω
2
(4.137)
or for q → 0
ǫ
1
(q,ω) ≃ 1 −
ω
2
p
ω
2
,ω
2
p
=
e
2
ε
0
m
N
V
. (4.138)
Apparently, the energy–loss function has a singularity at the plasma frequency
ω
p
. As the typical result of RPA it represents a collective excitation, the plas-
mon, in which all particles of the electron system participate. Moreover, it
obeys a sum rule, which can be expressed in terms of ω
p
(Problem 4.10).
We note that (
4.138) does not contain ¯h. This indica tes the possibility of
an interpretation in terms of classical physics. In fact, the classical equation of
motion of a single electron in an electric field E, determined by the dielectric
polarization E = −P /ε
0
= ner/ε
0
of the electron system with density n =
N/V ,reads
m
¨
r = −
e
2
ε
0
N
V
r or
¨
r = −ω
2
p
r . (4.139)
In the long wavelength limit each electron of the system experiences a restoring
force characterized by the plasma frequency when (in the collision with a fast
charged particle) the system is displaced again st the jellium background. For
finite q,oneobtainsfromε
1
(q,ω)=0
ω
2
p
(q)=ω
2
p
1+
3
10
q
2
¯h
2
k
2
F
mω
2
p
+ ...
!
, (4.140)
where the second and higher order terms indicate quantum mechanical
corrections to the classical result.
The typical RPA sp ectrum, consisting of the particle–hole continuum and
the plasmon mod e, as depicted schematically in Fig. 4.15, can be translated
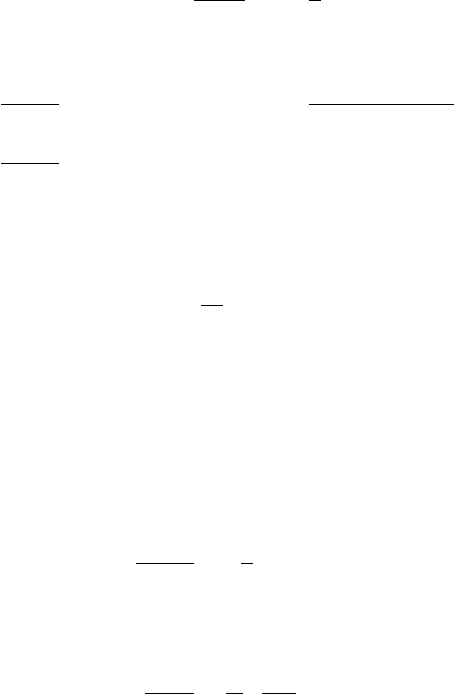
for small momentum transfer into the real and imaginary part of the dielec-
tric function as shown in Fig. 4.16: ε
2
(q,ω) is determined by the particle–hole
continuum giving contributions only at low frequencies, while ε
1
(q,ω), show-
ing a more complex frequency dependence, starts at ω = 0 with the value
defined by the Thomas–Fermi screening parameter k
FT
(see Problem 4.11),
changes sign around the upper cut-off frequency of the particle–hole excita-
tions, passes through zero at the plasma frequency, and approaches 1 for high
frequencies. These characteristic features are also found in the experimental
data, e.g., [
5, 89].
In metals with electron densities of the order of 10
23
cm
−3
(see Table 4.1),
the plasmon energy ¯hω
p
is about 1 Ry and determines the response in an
energy-loss experiment in this energy range. In contrast, doped semiconduc-
tors represent diluted metallic systems with much lower plasmon energies,
which can be tuned by the concentration of the dopands in the range of
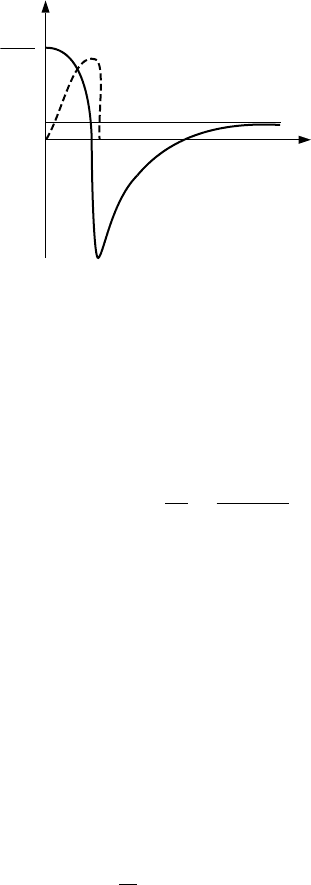
110 4 The Free Electron Gas
ω
1
k
FT
2
q
2
k
FT
q<<
ε
2
ε
1
ω
p
Fig. 4.16. The frequency dep endent real and imaginary part of the dielectric
function as obtained for the RPA spectrum
optical phonons at q = 0. The response of the system (measured by inelas-
tic light scattering [
118]) is then characterized by couple d plasmon–phonon
modes with frequencies determined by the zeros of the dielectric function in
the long-wavelength limit
ε(ω)=ε
∞
1 −
ω
2
p
ω
2
+
ω
2
L
− ω
2
T
ω
2
T
− ω
2
, (4.141)
which is the sum of the plasmon and phonon contributions (see Sect. 3.5).
Note that the plasmon contribution is modified by the dielectric constant ε
∞
of the semiconductor accomodating the diluted plasma, while the electron
mass becomes the effective mass m
∗
. The biquadratic equation ε(ω)=0
has two solutions, which in dependence on the carrier concentration show a n
anticrossing b e havior typical for the coupling between th e two modes, which
is also experimentally verified.
4.7 Electronic Correlation
The mean energy per electron in the ground state at T =0K
ǫ
0
=
1
N
E
0
= ǫ
HF
0
+ ǫ
c
(4.142)
can be separated into the HF energy and the correlation energy. The former
is determined by the filli n g of the Fermi sphere and considering the exchange
interaction (as a consequence of the Pauli principle). The latter takes into
account the electron–electron interaction beyond the HF approximation and
will lead to a modified picture of the pair–distribution function of Fig. 4.12,
in which the exchange h ole is replaced by the correlation hole.
4.7 Electronic Correlation 111
It is helpful to start with the expectation value (per electron) of the
electron–electron interaction in (
4.107) for the exact ground state |Ψ
0
ǫ
xc
=
1
2N
q=0
v
q
Ψ
0
|(N
†
q
N
q
− N)|Ψ
0
, (4.143)
where the index xc refers to exchange and correlation. It can be reformulated
by making use of the expression for the dynamic structure factor
S(q,ω)=
1
2π
+∞
−∞
e
−iωt
Ψ
0
|(
ˆ
N
q
(t)
ˆ
N
−q
(0)|Ψ
0
dt (4.144)
which can be written also as
S(q,ω)=
m
|Ψ
0
|
ˆ
N
q
|Ψ
m
|
2
1
2π
+∞
−∞
e
−i(ω−ω
m0
)t
dt. (4.145)
The integral is the δ function and thus
∞
0
S(q,ω)dω =
m
|Ψ
0
|
ˆ
N
q
|Ψ
m
|
2
= Ψ
0
|
ˆ
N
q
ˆ
N
−q
|Ψ
0
= NS(q) . (4.146)
Here S(q) is the static structure factor which now enters the (still exact)
expression for ǫ
xc
:
ǫ
xc
=
1
2
q=0
v
q
(S(q) − 1). (4.147)
Due to the isotropy of the free electron system we have S(q)=S(q)andwe
may write after integration over the angles
ǫ
xc
= −
e
2
k
F
2π
2
ε
0
−
1
2k
F
∞
0
(S(q) − 1)dq
!
. (4.148)
By introducing the dimensionless function
γ(k
F
)=−
1
2k
F
∞
0
(S(q) − 1)dq (4.149)
and expressing k
F
by the density parameter r
s
we find (in Ry)
ǫ
xc
(r
s
)=−
4
πr
s
9π
4
!
1/3
γ(r
s
) . (4.150)
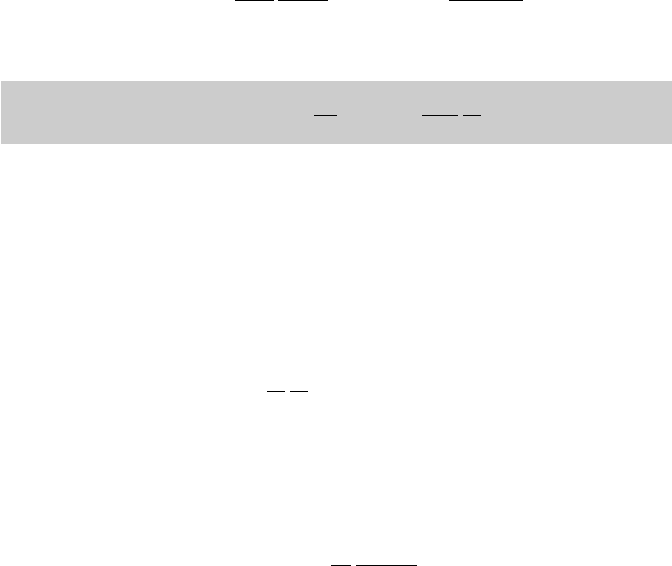
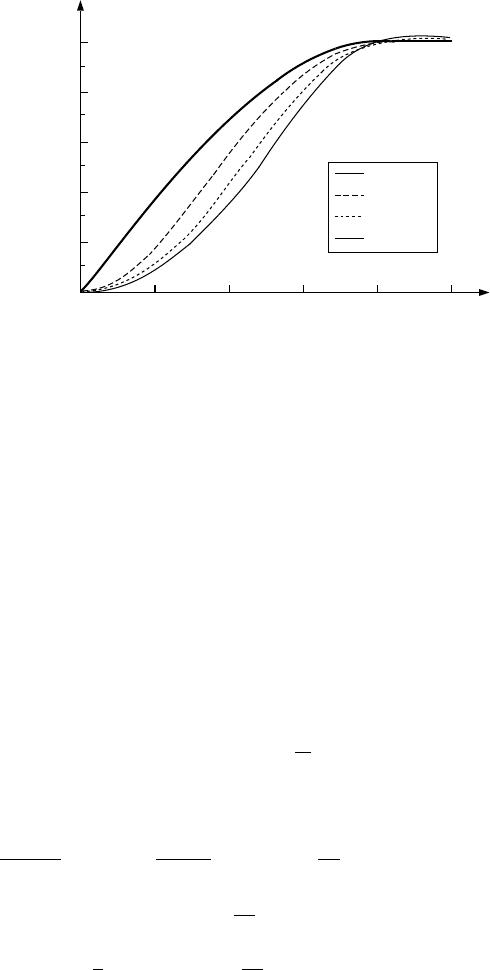
The static structure factor S(q) is shown in Fig. 4.17 for different values of r
s
.
It should be kept in mind here that the expectation value of the kinetic
energy (to be taken for the exact ground state) depends on the interaction.
112 4 The Free Electron Gas
s
s
s
r = 2
r = 6
r = 10
r = 0.001
s
0
0.2
0.4
0.6
0.8
1.0
0 0.5 1.0 1.5 2.0 2.5
S(q)
q/k
F
Fig. 4.17. The static structure factor S(q) for different values of the density
parameter r
s
(after [
119])
This is accounted for within the following consideration known as the ground
state theorem: L et the system Hamiltonian be given by
H(g)=H
kin
+ gH
int
(4.151)
where g = e
2
is the strength of the (electron–electron) interaction. The
eigenstates of H(g), including the ground state |Ψ
0
(g), depend on g and
E
int
(g)=Ψ
0
(g)|gH
int
|Ψ
0
(g) (4.152)
is the exact contribution of the interaction to the ground state energy E
0
(g).
Then, according to the theorem
E
0
(g)=E
0
(0) +
g
0
1
g
′
E
int
(g
′
)dg
′
. (4.153)
To prove this theorem one has simply to write
dE
0
(g)
dg
= Ψ
0
(g)|
dH(g)
dg
|Ψ
0
(g) +
d
dg
Ψ
0
(g)|
!
H(g)|Ψ
0
(g)
+Ψ
0
(g)|H(g)
d
dg
|Ψ
0
(g)
!
=
1
g
E
int
(g)+E
0
(g)
d
dg
Ψ
0
(g)|Ψ
0
(g). (4.154)
The last term vanishes, because |Ψ
0
(g) is normalized, and the resulting dif-
ferential equation can be integrated directly to yield the statement of the
theorem.
4.7 Electronic Correlation 113
For the homogeneous electron gas we can immediately write
ǫ
0
=
3
5
E
F
−
k
F
2π
2
ε
0
e
2
0
γ(g
′
)dg
′
. (4.155)
Thus, in terms of the density parameter r
s
, the exact ground state ener gy per
electron reads (in Ry)
ǫ
0
(r
s
)=
2.2099
r
2
s
−
4
πr
s
9π
4
!
1/3
1
0
γ(λr
s
)dλ. (4.156)
If γ or S(q)orIm1/ε(q,ω) is given, the ground state energy per electron ǫ
0
(r
s
)
is also known. The first term is the contribution of the kinetic energy in the
Sommerfeld (or noninteracting electron) model, the second term describes the
exchange and correlation energy (including also modifications of the kinetic
energy due to the electron–electron interaction), and the exact correlation
energy per electron can be written as
ǫ
c
(r
s
)=
0.916
r
s
−
4
πr
s
9π
4
!
1/3
1
0
γ(λr
s
)dλ. (4.157)
By definition ǫ
c
(r
s
) vanishes in the HF approximation.
Calculations of the correlation energy have been carried out in different
approximations for ε(q,ω)(orS(q)orγ), whose accuracy depends on the
density (or r
s
)[
64, 119]. Typically one uses
ε(q,ω)=1−
v
q
π
0
(q,ω)
1+v
q
G(q)π
0
(q,ω)
(4.158)
with different forms of G(q). One particularly simple form is G(q)=0,for
which the dielectric function takes the RPA form of (
4.125). But also in
general, considering correlation means some kind of screening the Coulomb
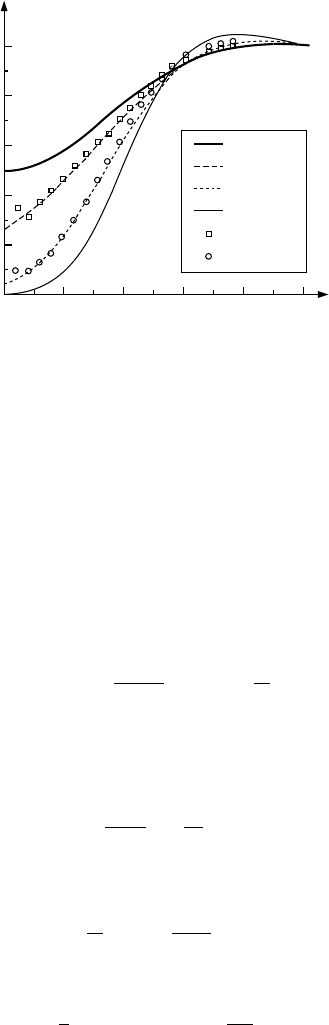
interaction. Results are visualized by plotting the pair–distribution function
(see Problem 4.12) which for the homogeneous electron system reads
g(r)=1+
3
2rk
3
F
∞
0
q sin(qr)(S(q) − 1) dq. (4.159)
As can be seen in Fig. 4.18, the HF result, with g(r → 0) = 1/2, is recovered
for dense electron systems (r
s
≪ 1) while in the low-density case (large r
s
)
g(r → 0) → 0 and the exchange or Fermi hole evolves into a correlation hole
because the electrons try to avoid each other (irrespective of their spin). We
will see in the next chapter how these concepts of exchange and correlation
can be considered in describing the electronic states of the inhomogen eous
electron systems found in solids.
Let us also briefly discuss the low density limit r
s
≫ 1, for which the
electron–electron interaction is expected to dominate the kinetic energy. The
114 4 The Free Electron Gas
1.0
0.8
0.6
0.4
0.2
0
0.50 1.0 1.5 2.0 2.5
r/r
s
a
0
g(r)
r = 1
s
r = 5
s
r = 15
s
r = 0.001
s
r = 1
s
r = 5
s
Fig. 4.18. The pair–distribution function g(r) for different values of the density
parameter r
s
(after [
119]). The symbols refer to Monte–Carlo simulations of [120]
ultimate limit, when the kinetic energy can be completely neglected, leads to
a problem of classical electrostatics: the grou nd state is defined by the config-
uration of point charges with the lowest potential energy. This configuration
is a crystalline one: the Wigner crystal. Its electrostatic energy shall be evalu-
ated here in the jellium model, in which each electron is assigned the volume
of the Seitz sphere with radius r
0
= r
s
a
B
.Thepotentialenergyofanelectron
in the center and t h e sphere filled with the compensating positive charge of
the jellium background is
ǫ
WC
−
= −
r
0
0
e
2
4πε
0
r
nd
3
r = −
3
r
s
Ry. (4.160)
The potential energy of the posit i ve jellium background in the Seitz sphere,
ǫ
+
, is to be calculated from the electrostatic potential of the homogeneously
charged sphere
V (r)=
e
2
r
2
s
a
3
B
−
r
2
2
!
+ C (4.161)
where C =3e
2
/2r
s
a
B
has to be chosen to establish charge neutrality, thus
V (r)=
1
r
s
3 −
r
2
r
s
a
B
2
!
Ry (4.162)
and
ǫ
+
=
1
2
r
0
0
V (r)nd
3
r =
6
5r
s
Ry. (4.163)