Short T.A. Electric Power Distribution Handbook
Подождите немного. Документ загружается.


Transformers 195
load above the peak kVA estimate, and inaccuracy of the load prediction will
mean that some units are going to be loaded more than expected. The load
factor (the ratio of average demand to peak demand) for most distribution
transformers is 40 to 60%. Most distribution transformers are relatively lightly
loaded most of the time, but some have peak loads well above their rating.
In analysis of data from three utilities, the Oak Ridge National Laboratory
found that distribution transformers have an average load of 15 to 40% of
their rating, with 30% being most typical (ORNL-6925, 1997).
The heat input into the transformer is from no-load losses and from load
losses. The economics of transformer application and purchasing involve
consideration of the thermal limitations as well as the operating costs of the
losses. Transformer stocking considerations also play a role. For residential
customers, a utility may limit inventory to 15, 25, and 50-kVA units (5, 10,
15, 25, 37.5, 50-kVA units are standard sizes).
Some utilities use transformer load management programs to more pre-
cisely load transformers to get the most economic use of each transformer’s
TABLE 4.8
Transformer Loading Guidelines
Peak Load
Duration,
Hours
Extra Loss
of Life
a
,
%
Equivalent Peak Loading in Per Unit of Rated kVA with the Percent
Preload and Ambient Temperatures Given Below
50% Preload 75% Preload 90% Preload
Ambient Temp., ∞C Ambient Temp., ∞C Ambient Temp., ∞C
20 30 40 50 20 30 40 50 20 30 40
1 Normal 2.26 2.12 1.96 1.79 2.12 1.96 1.77 1.49 2.02 1.82 1.43
0.05 2.51 2.38 2.25 2.11 2.40 2.27 2.12 1.95 2.31 2.16 1.97
0.10 2.61 2.49 2.36 2.23 2.50 2.37 2.22 2.07 2.41 2.27 2.11
0.50 2.88 2.76 2.64 2.51 2.77 2.65 2.52 2.39 2.70 2.57 2.43
2 Normal 1.91 1.79 1.65 1.50 1.82 1.68 1.52 1.26 1.74 1.57 1.26
0.05 2.13 2.02 1.89 1.77 2.05 1.93 1.80 1.65 1.98 1.85 1.70
0.10 2.22 2.10 1.99 1.87 2.14 2.02 1.90 1.75 2.07 1.95 1.81
0.50 2.44 2.34 2.23 — 2.37 2.26 2.15 — 2.31 2.20 2.08
4 Normal 1.61 2.50 1.38 1.25 1.56 1.44 1.30 1.09 1.50 1.36 1.13
0.05 1.80 1.70 1.60 1.48 1.76 1.65 1.54 1.40 1.71 1.60 1.47
0.10 1.87 1.77 1.67 — 1.83 1.72 1.62 1.50 1.79 1.68 1.56
0.50 2.06 1.97 — — 2.02 1.93 — — 1.99 1.89 —
8 Normal 1.39 1.28 1.18 1.05 1.36 1.25 1.13 0.96 1.33 1.21 1.02
0.05 1.55 1.46 1.36 1.25 1.53 1.43 1.33 1.21 1.51 1.41 1.29
0.10 1.61 1.53 1.43 1.33 1.59 1.50 1.41 1.30 1.57 1.47 1.38
0.50 1.78 1.69 1.61 — 1.76 1.67 1.58 — 1.74 1.65 1.56
24 Normal 1.18 1.08 0.97 0.86 1.17 1.07 0.97 0.84 1.16 1.07 0.95
0.05 1.33 1.24 1.15 1.04 1.33 1.24 1.13 1.04 1.32 1.23 1.13
0.10 1.39 1.30 1.21 1.11 1.38 1.29 1.20 1.10 1.38 1.29 1.20
0.50 1.54 1.45 1.37 1.28 1.53 1.45 1.37 1.28 1.53 1.45 1.36
a
Extra loss of life in addition to 0.0137% per day loss of life for normal life expectancy.
Source: ANSI/IEEE C57.91-1981, IEEE Guide for Loading Mineral-Oil-Immersed Overhead and Pad-
Mounted Distribution Transformers Rated 500 kVA and Less with 65 Degrees C or 55 Degrees C Average
Winding Rise.
1791_C04.fm Page 195 Thursday, August 7, 2003 11:18 AM
(C) 2004 by CRC Press LLC
196 Electric Power Distribution Handbook
life. These programs take billing data for the loads from each transformer
to estimate that transformer’s loading. These programs allow the utility to
more aggressively load transformers because those needing changeout can
be targeted more precisely. Load management programs require data setup
and maintenance. Most important, each meter must be tied to a given
transformer (many utilities have this information infrastructure, but some
do not).
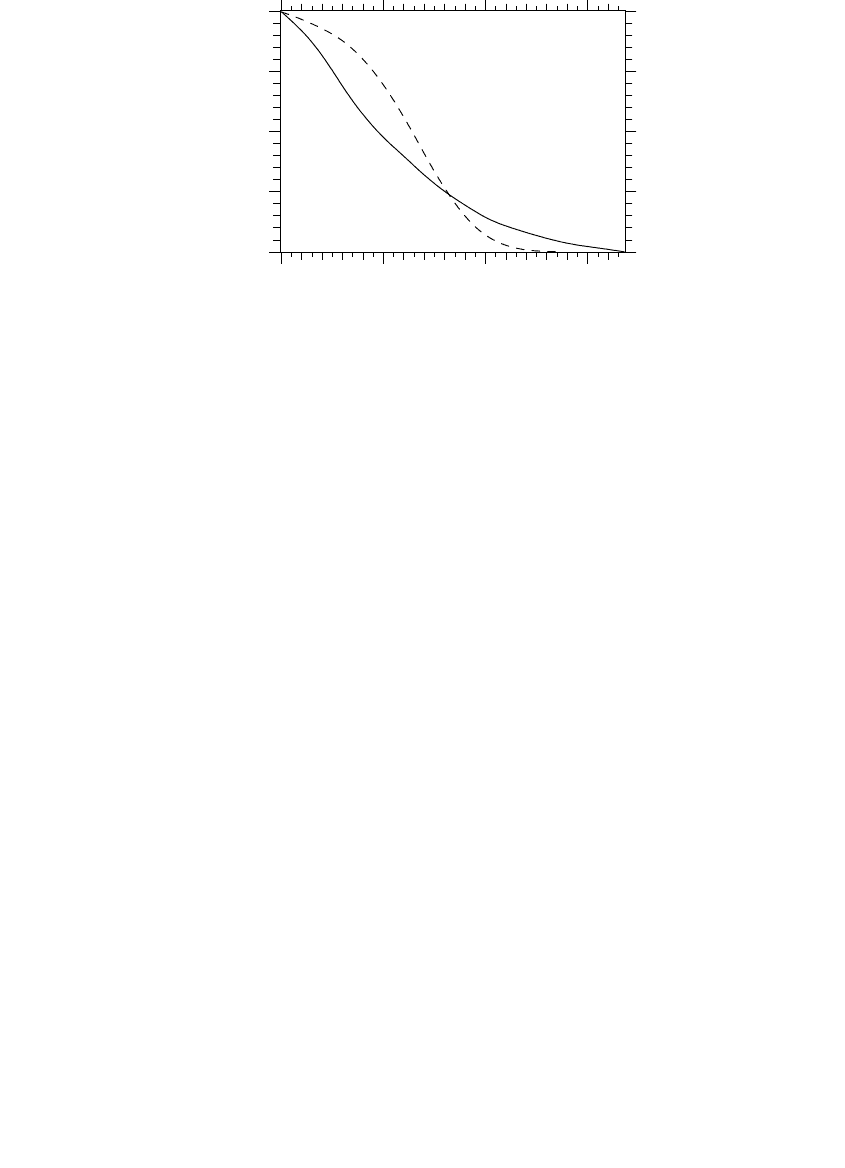
Transformer loadings vary considerably. Figure 4.20 shows the distribu-
tion of average loadings on two sizes of transformers at one typical utility.
Most transformers are not heavily loaded: in this case, 85% of units have
average loadings less than the nameplate. Many units are very lightly
loaded, and 10% are quite heavily loaded. Smaller units have more spread
in their loading.
Seevers (1995) demonstrates a simple approach to determining trans-
former loading. Their customers (in the southern US) had 1 kW of demand
for every 400 kWh’s, regardless of whether the loads peaked in the winter
or summer. Seevers derived the ratio by comparing substation demand with
kWh totals for all customers fed from the substation (after removing pri-
mary-metered customers and other large loads). To estimate the load on a
given transformer, sum the kWh for the month of highest usage for all
customers connected to the transformer and convert to peak demand, in this
case by dividing by 400 kWh per kW-demand. While simple, this method
identifies grossly undersized or oversized transformers. Table 4.9 shows
guidelines for replacement of underloaded transformers.
Transformers with an internal secondary breaker (CSPs) are a poor-man’s
form of transformer load management. If the breaker trips from overload,
replace the transformer (unless there are extraordinary weather and loading
conditions that are unlikely to be repeated).
FIGURE 4.20
Distributions of average loadings of two transformer sizes at one utility. (From [ORNL-6927,
1998])
0.0 0.5 1.0 1.5
25 kVA 100 kVA
0
25
50
75
100
Average loading, per unit
Percent of transformers
exceeding the x-axis value
1791_C04.fm Page 196 Thursday, August 7, 2003 11:18 AM
(C) 2004 by CRC Press LLC

Transformers 197
Especially in high-lightning areas, consider the implications of reduction
of insulation capability. At hottest-spot temperatures above 140∞C, the solid
insulation and the oil may release gasses. While not permanently reducing
insulation, the short-term loss of insulation strength can make the trans-
former susceptible to damage from lightning-caused voltage surges. The
thermal time constant of the winding is very short, 5 to 15 min. On this time
scale, loads on distribution transformers are quite erratic with large, short-
duration overloads (well above the 20- or 30-min demand loadings). These
loads can push the winding hottest-spot temperature above 140∞C.
Padmounted transformers have a special concern related to loading: case
temperatures. Under heavy loading on a hot day, case temperatures can
become hot. ABB measured absolute case temperatures of 185 to 200∞F (85
to 95∞C) and case temperature rises above ambient of 50 to 60∞C on 25 and
37.5-kVA transformers at 180% loadings and on a 50-kVA transformer at
150% continuous load (NRECA RER Project 90-8, 1993). The hottest temper-
atures were on the sides of the case where the oil was in contact with the
case (the top of the case was significantly cooler). While these temperatures
sound quite high, a person’s pain-withdrawal reflexes will normally protect
against burns for normal loadings that would be encountered. Reflexes will
protect against blistering and burning for case temperatures below 300∞F
(149∞C). Skin contacts must be quite long before blistering occurs. For a case
temperature of 239∞F (115∞C), NRECA reported that the skin-contact time to
blister is 6.5 sec (which is more than enough time to pull away). At 190∞F
(88∞C), the contact time to blister is 19 sec.
4.6 Losses
Transformer losses are an important purchase criteria and make up an appre-
ciable portion of a utility’s overall losses. The Oak Ridge National Laboratory
estimates that distribution transformers account for 26% of transmission and
TABLE 4.9
One Approach to a Transformer Replacement Program
Existing Transformer kVA Loading Estimate in kVA Recommended Size in kVA
25 10 or less 10
37.5 15 or less 10
50 20 or less 15
75 37.5 or less 37.5
100 50 or less 50
167 100 or less 100
75 or less 75 or 50
Source: Seevers, O. C., Management of Transmission and Distribution Systems, Penn Well
Publishing Company, Tulsa, OK, 1995.
1791_C04.fm Page 197 Thursday, August 7, 2003 11:18 AM
(C) 2004 by CRC Press LLC

198 Electric Power Distribution Handbook
distribution losses and 41% of distribution and subtransmission losses
(ORNL-6804/R1, 1995). At one utility, Grainger and Kendrew (1989) esti-
mated that distribution transformers were 55% of distribution losses and
2.14% of electricity sales; of the two main contributors to losses, 86% were
no-load losses, and 14% were load losses.
Load losses are also called copper or wire or winding losses. Load losses
are from current through the transformer’s windings generating heat
through the winding resistance as I
2
R.
No-load losses are the continuous losses of a transformer, regardless of
load. No-load losses for modern silicon-steel-core transformers average
about 0.2% of the transformer rating (a typical 50-kVA transformer has no-
load losses of 100 W), but designs vary from 0.15 to 0.4% depending on the
needs of the utility. No-load losses are also called iron or core losses because
they are mainly a function of the core materials. The two main components
of no-load losses are eddy currents and hysteresis. Hysteresis describes the
memory of a magnetic material. More force is necessary to demagnetize
magnetic material than it takes to magnetize it; the magnetic domains in the
material resist realignment. Eddy current losses are small circulating cur-
rents in the core material. The steel core is a conductor that carries an
alternating magnetic field, which induces circulating currents in the core.
These currents through the resistive conductor generate heat and losses.
Cores are typically made from cold-rolled, grain-oriented silicon steel lam-
inations. Manufacturers limit eddy currents by laminating the steel core in
9- to 14-mil thick layers, each insulated from the other. Core losses increase
with steady-state voltage.
Hysteresis losses are a function of the volume of the core, the frequency,
and the maximum flux density (Sankaran, 2000):
where
V
e
= volume of the core
f = frequency
B = maximum flux density
The eddy-current losses are a function of core volume, frequency, flux
density, lamination thicknesses, and resistivity of the core material (Sanka-
ran, 2000):
where
t = thickness of the laminations
r = resistivity of the core material
PV f B
h
e
.
µ
16
P VB f t r
ee
µ
222
1791_C04.fm Page 198 Thursday, August 7, 2003 11:18 AM
(C) 2004 by CRC Press LLC

Transformers 199
Amorphous core metals significantly reduce core losses — as low as one
quarter of the losses of silicon-steel cores — on the order of 0.005 to 0.01%
of the transformer rating. Amorphous cores do not have a crystalline struc-
ture like silicon-steel cores; their iron atoms are randomly distributed. Amor-
phous materials are made by rapidly cooling a molten alloy, so crystals do
not have a chance to form. Such core materials have low hysteresis loss.
Eddy current-losses are very low because of the high resistivity of the mate-
rial and very thin laminations (1-mil thick). Amorphous-core transformers
are larger for the same kVA rating and have higher initial costs.
Load losses, no-load losses, and purchase price are all interrelated.
Approaches to reduce load losses tend to increase no-load losses and vice
versa. For example, a larger core cross-sectional area decreases no-load losses
(the flux density core is less), but this requires longer winding conductors
and more I
2
R load losses. Table 4.10 shows some of the main tradeoffs.
Information from transformer load management programs can help with
transformer loss analysis. Table 4.11 shows typical transformer loading data
from one utility. The average load on most transformers is relatively low (25
to 30% of transformer rating), which highlights the importance of no-load
losses. The total equivalent losses on a transformer are
TABLE 4.10
Loss Reduction Alternatives
No-Load
Losses
Load
Losses Cost
To Decrease No-Load Losses
Use lower-loss core materials Lower No change
a
Higher
Decrease flux density by:
(1) increasing core CSA
b
Lower Higher Higher
(2) decreasing volts/turn Lower Higher Higher
Decrease flux path length by decreasing
conductor CSA
Lower Higher Lower
To Decrease Load Losses
Use lower-loss conductor materials No change Lower Higher
Decrease current density by increasing
conductor CSA
Higher Lower Higher
Decrease current path length by:
(1) decreasing core CSA Higher Lower Lower
(2) increasing volts/turn Higher Lower Higher
a
Amorphous core materials would result in higher load losses.
b
CSA=cross-sectional area
Source: ORNL-6847, Determination Analysis of Emergy Conservation Standards for
Distribution Transformers, Oak Ridge National Laboratory, U.S. Department of
Emergy, 1996.
1791_C04.fm Page 199 Thursday, August 7, 2003 11:18 AM
(C) 2004 by CRC Press LLC

200 Electric Power Distribution Handbook
where
L
total
= average losses, kW (multiply this by 8760 to find the annual kilo-
watt-hours)
P = peak transformer load, per unit
F
ls
= loss factor, per unit
L
no-load
= rated no-load losses, kW
L
load
= rated load losses, kW
Many utilities evaluate the total life-cycle cost of distribution transformers,
accounting for the initial purchase price and the cost of losses over the life
of the transformer (the total owning cost or TOC). The classic work done by
Gangel and Propst (1965) on transformer loads and loss evaluation provides
the foundation for much of the later work. Many utilities follow the Edison
Electric Association’s economic evaluation guidelines (EEI, 1981). To evalu-
ate the total owning cost, the utility’s cost of losses are evaluated using
transformer loading assumptions, including load factor, coincident factor,
and responsibility factor. Utilities typically assign an equivalent present
value for the costs of no-load losses and another for the cost of load losses.
Loss values typically range from $2 to $4/W of no-load losses and $0.50 to
$1.50/W of load losses (ORNL-6847, 1996). Utilities that evaluate the life
costs of transformers purchase lower-loss transformers. For example, a 50-
TABLE 4.11
Summary of the Loading of One Utility’s Single-Phase Pole-Mounted
Distribution Transformers
Size
(kVA)
No. of
Installed
Transformers
MWh/
Transformer
Annual PU
Avg. Load
Annual PU
Load Factor
Calculated
Loss Factor
10 59,793 21 0.267 0.405 0.200
15 106,476 34 0.292 0.430 0.221
25 118,584 60 0.309 0.444 0.234
37 77,076 96 0.329 0.445 0.235
50 50,580 121 0.308 0.430 0.222
75 24,682 166 0.281 0.434 0.225
100 8,457 220 0.280 0.463 0.252
167 3,820 372 0.283 0.516 0.304
250 592 631 0.320 0.568 0.360
333 284 869 0.331 0.609 0.407
500 231 1,200 0.304 0.598 0.394
667 9 1,666 0.317 0.476 0.264
833 51 2,187 0.333 0.629 0.431
Note: PU = per unit
Source: ORNL-6925, Supplement to the “Determination Analysis” (ORNL-6847) and Anal-
ysis of the NEMA Efficiency Standard for Distribution Transformers, Oak Ridge National
Laboratory, U.S. Department of Emergy, 1997.
LPFLL
total ls load no load
=+
-
2
1791_C04.fm Page 200 Thursday, August 7, 2003 11:18 AM
(C) 2004 by CRC Press LLC

Transformers 201
kVA single-phase, non-loss-evaluated transformer would have approxi-
mately 150 W of no-load losses and 675 W of load losses; the same loss-
evaluated transformer would have approximately 100 W of no-load losses
and 540 W of load losses (ORNL-6925, 1997). Nickel (1981) describes an
economic approach in detail and compares it to the EEI method. The IEEE
has developed a more recent guide (C57.12.33).
4.7 Network Transformers
Network transformers, the distribution transformers that serve grid and spot
networks, are large three-phase units. Network units are normally vault-
types or subway types, which are defined as (ANSI C57.12.40-1982):
• Vault-type transformers — Suitable for occasional submerged
operation
• Subway-type transformers — Suitable for frequent or continuous sub-
merged operation
Network transformers are often housed in vaults. Vaults are underground
rooms accessed through manholes that house transformers and other equip-
ment. Vaults may have sump pumps to remove water, air venting systems,
and even forced-air circulation systems. Network transformers are also used
in buildings, usually in the basement. In these, vault-type transformers may
be used (as long as the room is properly built and secured for such use).
Utilities may also use dry-type units and units with less flammable insulat-
ing oils.
A network transformer has a three-phase, primary-side switch that can
open, close, or short the primary-side connection to ground. The standard
secondary voltages are 216Y/125 V and 480Y/277 V. Table 4.12 shows stan-
dard sizes. Transformers up to 1000 kVA have a 5% impedance; above 1000
kVA, 7% is standard. X/R ratios are generally between 3 and 12. Lower
impedance transformers (say 4%) have lower voltage drop and higher sec-
ondary fault currents. (Higher secondary fault currents help on a network
to burn clear faults.) Lower impedance has a price though — higher circu-
lating currents and less load balance between transformers. Network trans-
TABLE 4.12
Standard Network Transformer Sizes
Standard Ratings, kVA
216Y/125 V 300, 500, 750, 1000
480Y/277 V 500, 750, 1000, 1500, 2000, 2500
1791_C04.fm Page 201 Thursday, August 7, 2003 11:18 AM
(C) 2004 by CRC Press LLC

202 Electric Power Distribution Handbook
formers may also be made out of standard single-phase distribution
transformers, but caution is warranted if the units have very low leakage
impedances (which could cause very high circulating currents and secondary
fault levels higher than network protector ratings).
Most network transformers are connected delta – grounded wye. By block-
ing zero sequence, this connection keeps ground currents low on the primary
cables. Then, we can use a very sensitive ground-fault relay on the substation
breaker. Blocking zero sequence also reduces the current on cable neutrals
and cable sheaths, including zero-sequence harmonics, mainly the third
harmonic. One disadvantage of this connection is with combination feeders
— those that feed network loads as well as radial loads. For a primary line-
to-ground fault, the feeder breaker opens, but the network transformers will
continue to backfeed the fault until all of the network protectors operate
(and some may stick). Now, the network transformers backfeed the primary
feeder as an ungrounded circuit. An ungrounded circuit with a single line-
to-ground fault on one phase causes a neutral shift that raises the line-to-
neutral voltage on the unfaulted phases to line-to-line voltage. The non-
network load connected phase-to-neutral is subjected to this overvoltage.
Some networks use grounded wye – grounded wye connections. This
connection fits better for combination feeders. For a primary line-to-ground
fault, the feeder breaker opens. Backfeeds to the primary through the net-
work still have a grounding reference with the wye – wye connection, so
chances of overvoltages are limited. The grounded wye – grounded wye
connection also reduces the change of ferroresonance in cases where a trans-
former has single-pole switching.
Most network transformers are core type, either a three- or five-legged
core. The three-legged core, either with a stacked or wound core, is suitable
for a delta – grounded wye connection (but not a grounded wye – grounded
wye connection because of tank heating). A five-legged core transformer is
suitable for either connection type.
4.8 Substation Transformers
In a distribution substation, power-class transformers provide the conver-
sion from subtransmission circuits to the distribution primary. Most are
connected delta – grounded wye to provide a ground source for the distri-
bution neutral and to isolate the distribution ground system from the sub-
transmission system.
Station transformers can range from 5 MVA in smaller rural substations to
over 80 MVA at urban stations (base ratings). Stations with two banks, each
about 20 MVA, are common. Such a station can serve about six to eight feeders.
Power transformers have multiple ratings, depending on cooling methods.
The base rating is the self-cooled rating, just due to the natural flow to the
1791_C04.fm Page 202 Thursday, August 7, 2003 11:18 AM
(C) 2004 by CRC Press LLC

Transformers 203
surrounding air through radiators. The transformer can supply more load
with extra cooling turned on. Normally, fans blow air across the radiators
and/or oil circulating pumps. Station transformers are commonly supplied
with OA/FA/FOA ratings. The OA is open air, FA is forced air cooling, and
FOA is forced air cooling plus oil circulating pumps.
The ANSI ratings were revised in the year 2000 to make them more con-
sistent with IEC designations. This system has a four-letter code that indi-
cates the cooling (IEEE C57.12.00-2000):
• First letter — Internal cooling medium in contact with the windings:
• O mineral oil or synthetic insulating liquid with fire point = 300˚C
• K insulating liquid with fire point > 300˚C
• L insulating liquid with no measurable fire point
• Second letter — Circulation mechanism for internal cooling medium:
• N natural convection flow through cooling equipment and in
windings
• F forced circulation through cooling equipment (i.e., coolant
pumps); natural convection flow in windings (also called nondi-
rected flow)
• D forced circulation through cooling equipment, directed from
the cooling equipment into at least the main windings
• Third letter — External cooling medium:
• A air
• W water
• Fourth letter — Circulation mechanism for external cooling medium:
• N natural convection
• F forced circulation: fans (air cooling), pumps (water cooling)
So, OA/FA/FOA is equivalent to ONAN/ONAF/OFAF. Each cooling
level typically provides an extra one-third capability: 21/28/35 MVA. Table
4.13 shows equivalent cooling classes in the old and new naming schemes.
Utilities do not overload substation transformers as much as distribution
transformers, but they do run them hot at times. As with distribution trans-
formers, the tradeoff is loss of life versus the immediate replacement cost of
the transformer. Ambient conditions also affect loading. Summer peaks are
much worse than winter peaks. IEEE Std. C57.91-1995 provides detailed
loading guidelines and also suggests an approximate adjustment of 1% of
the maximum nameplate rating for every degree C above or below 30∞C.
The hottest spot conductor temperature is the critical point where insulation
degrades. Above a hot-spot conductor temperature of 110∞C, life expectancy
decreases exponentially. The life halves for every 8∞C increase in operating
temperature. Most of the time, the hottest temperatures are nowhere near
1791_C04.fm Page 203 Thursday, August 7, 2003 11:18 AM
(C) 2004 by CRC Press LLC

204 Electric Power Distribution Handbook
this. Tillman (2001) provides the loading guide for station transformers
shown in Table 4.14.
The impedance of station transformers is normally about 7 to 10%. This
is the impedance on the base rating, the self-cooled rating (OA or ONAN).
The impedance is normally higher for voltages on the high-side of the trans-
former that are higher (like 230 kV). Transformer impedance can be specified
when ordering. Large stations with 50 plus MVA transformers are normally
provided with extra impedance to control fault currents, some as high as
30% on the transformer’s base rating.
The positive and zero-sequence impedances are the same for a shell-type
transformer, so the bolted fault currents on the secondary of the transformer
are the same for a three-phase fault and for a line-to-ground fault (provided
that both are fed from an infinite bus). In a three-legged core type trans-
former, the zero-sequence impedance is lower than the positive-sequence
impedance (typically ), so ground faults can cause higher cur-
rents. With a three-legged core transformer design, there is no path for zero-
sequence flux. Therefore, zero-sequence current will meet a lower-imped-
ance branch. This makes the core-type transformer act as if it had a delta-
connected tertiary winding. This is the magnetizing branch (from line to
ground), and this effectively reduces the zero-sequence impedance. In a
shell-type transformer, there is a path through the iron for flux to flow, so
the excitation impedance to zero sequence is high.
Because most distribution circuits are radial, the substation transformer is
a critical component. Power transformers normally have a failure rate
between 1 to 2% annually (CEA 485 T 1049, 1996; CIGRE working group
12.05, 1983; IEEE Std. 493-1997). Many distribution stations are originally
designed with two transformers, where each is able to serve all of the sub-
station’s feeders if one of the transformers fails. Load growth in some areas
has severely reduced the ability of one transformer to supply the whole
station. To ensure transformer reliability, use good lightning protection and
thermal management. Do not use reduced-BIL designs (BIL is the basic
lightning impulse insulation level). Also, reclosing and relaying practices
should ensure that excessive through faults do not damage transformers.
TABLE 4.13
Equivalent Cooling Classes
Year 2000 Designations
Designations Prior
to Year 2000
ONAN OA
ONAF FA
ONAN/ONAF/ONAF OA/FA/FA
ONAN/ONAF/OFAF OA/FA/FOA
OFAF FOA
OFWF FOW
Source: IEEE Std. C57.12.00-2000. Copyright
2000 IEEE. All rights reserved.
Z Z
0
1
085 = .
1791_C04.fm Page 204 Thursday, August 7, 2003 11:18 AM
(C) 2004 by CRC Press LLC