Stewart J. Calculus
Подождите немного. Документ загружается.

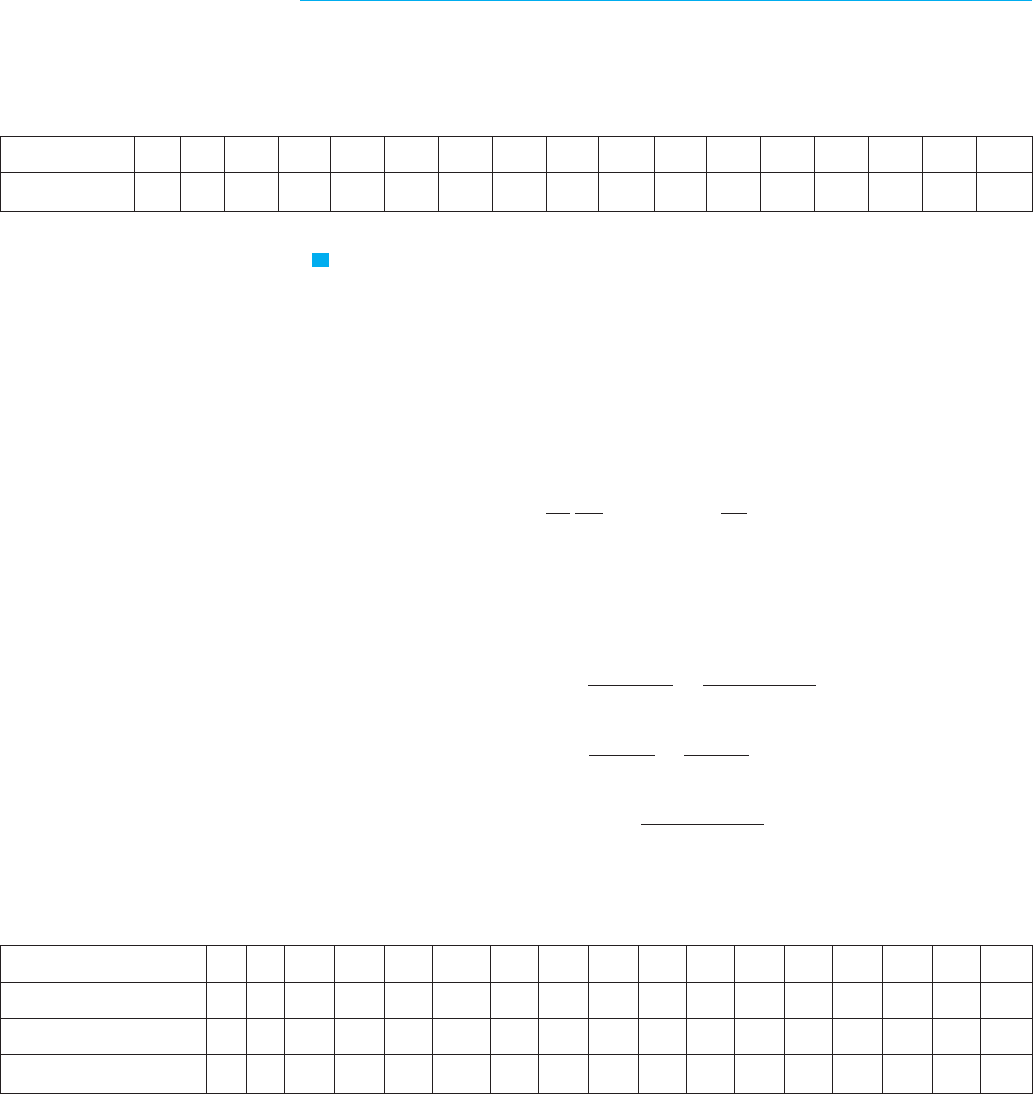
COMPARISON OF THE NATURAL GROWTH AND LOGISTIC MODELS
In the 1930s the biologist G. F. Gause conducted an experiment with the protozoan Para-
mecium and used a logistic equation to model his data. The table gives his daily count
of the population of protozoa. He estimated the initial relative growth rate to be 0.7944 and
the carrying capacity to be 64.
EXAMPLE 3 Find the exponential and logistic models for Gause’s data. Compare the
predicted values with the observed values and comment on the fit.
SOLUTION Given the relative growth rate and the initial population , the
exponential model is
Gause used the same value of k for his logistic model. [This is reasonable because
is small compared with the carrying capacity ( ). The equation
shows that the value of k for the logistic model is very close to the value for the expo-
nential model.]
Then the solution of the logistic equation in Equation 7 gives
where
So
We use these equations to calculate the predicted values (rounded to the nearest integer)
and compare them in the following table.
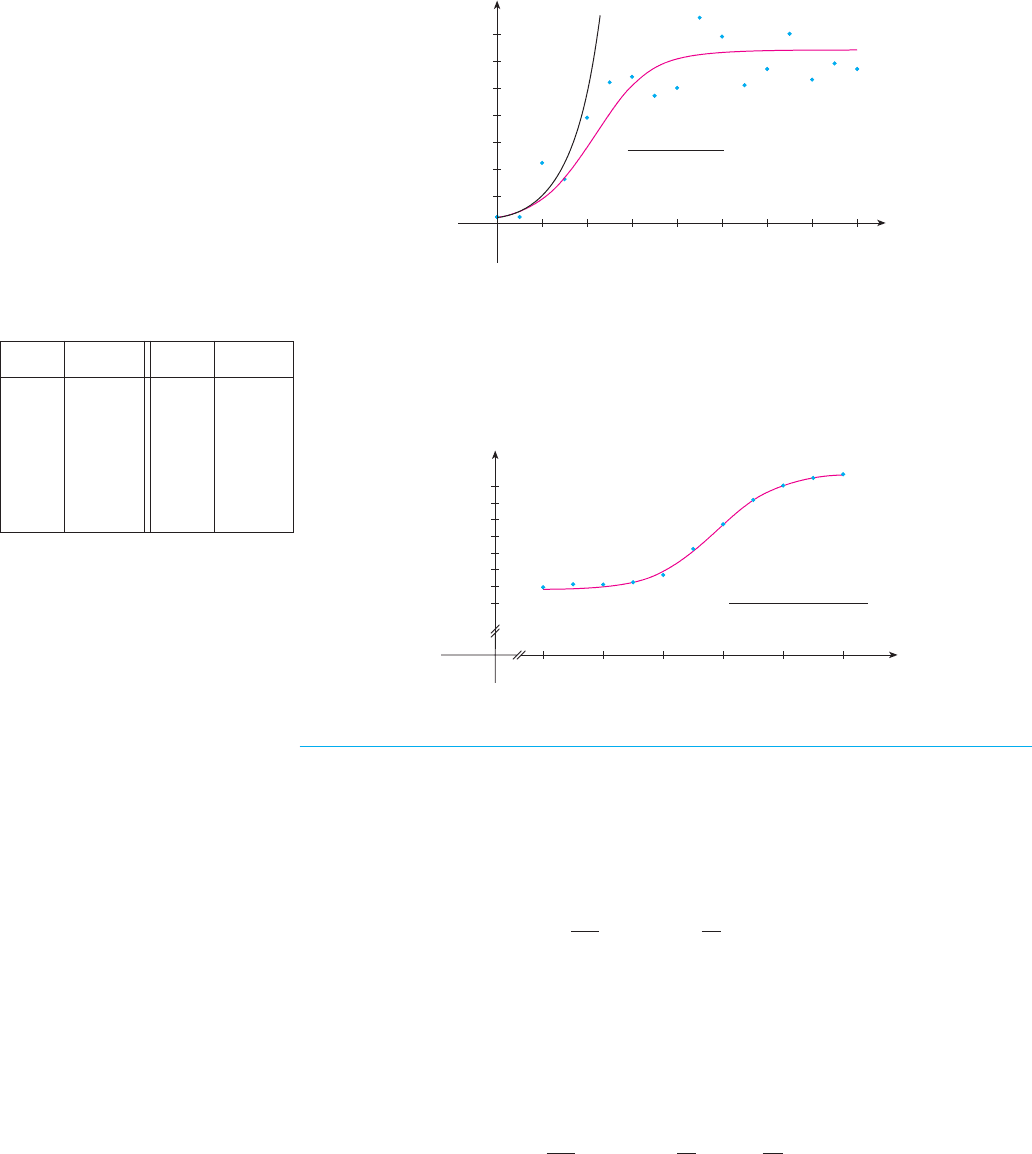
We notice from the table and from the graph in Figure 4 that for the first three or four
days the exponential model gives results comparable to those of the more sophisticated
logistic model. For , however, the exponential model is hopelessly inaccurate, but
the logistic model fits the observations reasonably well.
t ! 5
P!t" !
64
1 " 31e
#0.7944t
A !
K # P
0
P
0
!
64 # 2
2
! 31
P!t" !
K
1 " Ae
#kt
!
64
1 " Ae
#0.7944t
1
P
0
dP
dt
#
t!0
! k
$
1 #
2
64
%
& k
K ! 64P
0
! 2
P!t" ! P
0
e
kt
! 2e
0.7944t
P
0
! 2k ! 0.7944
V
632
|| ||
CHAPTER 10 DIFFERENTIAL EQUATIONS
t (days) 0 1 2 3 4 5 6 7 8 9 10 11 12 13 14 15 16
P (observed) 2 3 22 16 39 52 54 47 50 76 69 51 57 70 53 59 57
P (logistic model) 2 4 9 17 28 40 51 57 61 62 63 64 64 64 64 64 64
P (exponential model) 2 4 10 22 48 106
. . .
t (days) 0 1 2 3 4 5 6 7 8 9 10 11 12 13 14 15 16
P (observed) 2 3 22 16 39 52 54 47 50 76 69 51 57 70 53 59 57
M
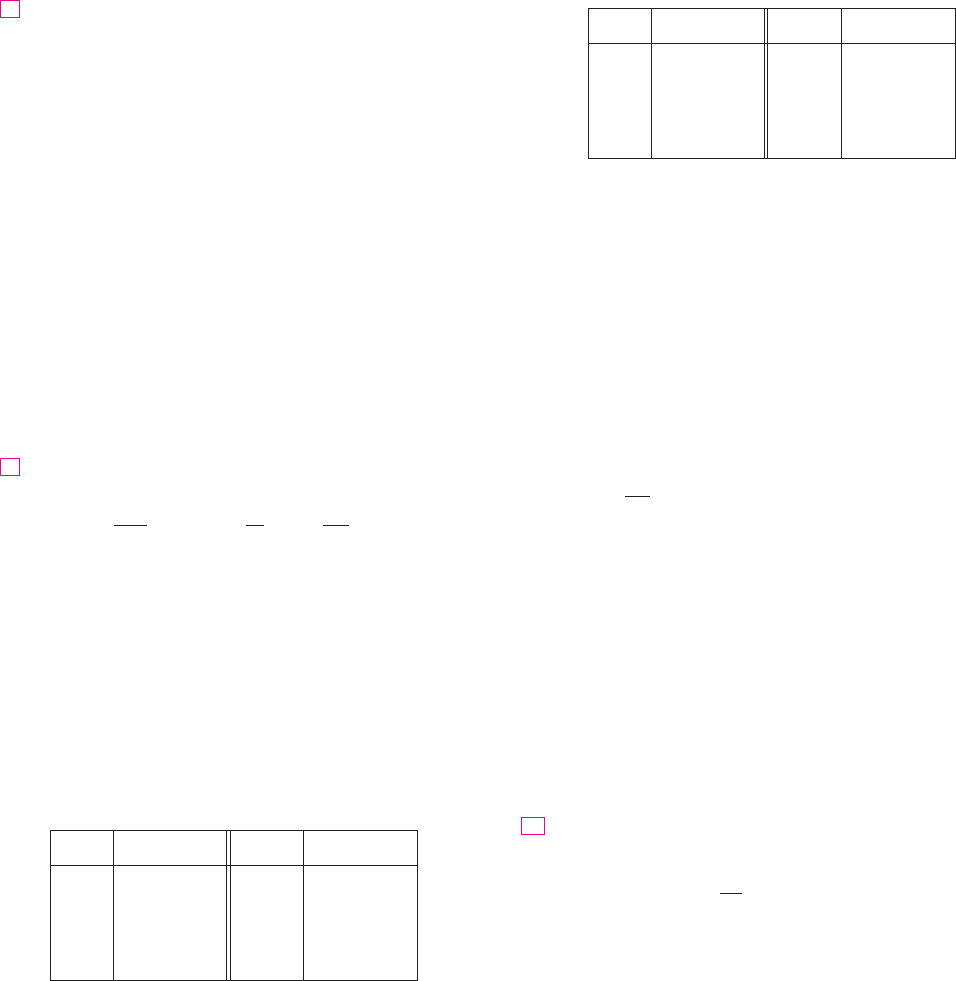
Many countries that formerly experienced exponential growth are now finding that their
rates of population growth are declining and the logistic model provides a better model.
The table in the margin shows midyear values of , the population of Belgium, in thou-
sands, at time , from 1980 to 2000. Figure 5 shows these data points together with a
shifted logistic function obtained from a calculator with the ability to fit a logistic function
to these points by regression. We see that the logistic model provides a very good fit.
OTHER MODELS FOR POPULATION GROWTH
The Law of Natural Growth and the logistic differential equation are not the only equa-
tions that have been proposed to model population growth. In Exercise 18 we look at the
Gompertz growth function and in Exercises 19 and 20 we investigate seasonal-growth
models.
Two of the other models are modifications of the logistic model. The differential
equation
has been used to model populations that are subject to harvesting of one sort or another.
(Think of a population of fish being caught at a constant rate.) This equation is explored
in Exercises 15 and 16.
For some species there is a minimum population level m below which the species tends
to become extinct. (Adults may not be able to find suitable mates.) Such populations have
been modeled by the differential equation
where the extra factor, , takes into account the consequences of a sparse popula-
tion (see Exercise 17).
1 # m'P
dP
dt
! kP
$
1 #
P
K
%$
1 #
m
P
%
dP
dt
! kP
$
1 #
P
K
%
# c
F I G U R E 5
Logistic model for
the population of Belgium
0 t
P
1980 1984 1988 1992 1996 2000
P=9840+
350
1+2.05e
_0.48(t-1990)
9,800
9,900
10,000
10,100
t
B!t"
F I G U R E 4
The exponential and logistic
models for the Paramecium data
0 t
P
16
1284
60
40
20
P=
64
1+31e
_0.7944t
P=2e
0.7944t
SECTION 10.4 MODELS FOR POPULATION GROWTH
|| ||
633
t t
1980 9,847 1992 10,036
1982
9,856 1994 10,109
1984 9,855 1996 10,152
1986 9,862 1998 10,175
1988 9,884 2000 10,186
1990 9,962
B!t"B!t"

634
|| ||
CHAPTER 10 DIFFERENTIAL EQUATIONS
where is the biomass (the total mass of the members of
the population) in kilograms at time (measured in years), the
carrying capacity is estimated to be , and
per year.
(a) If , find the biomass a year later.
(b) How long will it take for the biomass to reach ?
4. The table gives the number of yeast cells in a new laboratory
culture.
(a) Plot the data and use the plot to estimate the carrying
capacity for the yeast population.
(b) Use the data to estimate the initial relative growth rate.
(c) Find both an exponential model and a logistic model for
these data.
(d) Compare the predicted values with the observed values,
both in a table and with graphs. Comment on how well
your models fit the data.
(e) Use your logistic model to estimate the number of yeast
cells after 7 hours.
5. The population of the world was about 5.3 billion in 1990.
Birth rates in the 1990s ranged from 35 to 40 million per year
and death rates ranged from 15 to 20 million per year. Let’s
assume that the carrying capacity for world population is
100 billion.
(a) Write the logistic differential equation for these data.
(Because the initial population is small compared to the
carrying capacity, you can take to be an estimate of the
initial relative growth rate.)
(b) Use the logistic model to estimate the world population in
the year 2000 and compare with the actual population of
6.1 billion.
(c) Use the logistic model to predict the world population in
the years 2100 and 2500.
(d) What are your predictions if the carrying capacity is
50 billion?
6. (a) Make a guess as to the carrying capacity for the US
population. Use it and the fact that the population was
250 million in 1990 to formulate a logistic model for the
US population.
(b) Determine the value of in your model by using the
fact that the population in 2000 was 275 million.
(c) Use your model to predict the US population in the years
2100 and 2200.
k
k
4 $ 10
7
kg
y!0" ! 2 $ 10
7
kg
k ! 0.71
K ! 8 $ 10
7
kg
t
y!t"
Suppose that a population develops according to the logistic
equation
where is measured in weeks.
(a) What is the carrying capacity? What is the value of ?
(b) A direction field for this equation is shown. Where are
the slopes close to 0? Where are they largest? Which
solutions are increasing? Which solutions are decreasing?
(c) Use the direction field to sketch solutions for initial popu-
lations of 20, 40, 60, 80, 120, and 140. What do these
solutions have in common? How do they differ? Which
solutions have inflection points? At what population
levels do they occur?
(d) What are the equilibrium solutions? How are the other
solutions related to these solutions?
;
2. Suppose that a population grows according to a logistic
model with carrying capacity 6000 and per year.
(a) Write the logistic differential equation for these data.
(b) Draw a direction field (either by hand or with a computer
algebra system). What does it tell you about the solution
curves?
(c) Use the direction field to sketch the solution curves for
initial populations of 1000, 2000, 4000, and 8000. What
can you say about the concavity of these curves? What is
the significance of the inflection points?
(d) Program a calculator or computer to use Euler’s method
with step size to estimate the population after
50 years if the initial population is 1000.
(e) If the initial population is 1000, write a formula for the
population after years. Use it to find the population after
50 years and compare with your estimate in part (d).
(f) Graph the solution in part (e) and compare with the solu-
tion curve you sketched in part (c).
The Pacific halibut fishery has been modeled by the differen-
tial equation
dy
dt
! ky
$
1 #
y
K
%
3.
t
h ! 1
k ! 0.0015
0 t
P
604020
150
100
50
k
t
dP
dt
! 0.05P # 0.0005P
2
1.
E X E R C I S E S
10.4
Time (hours) Yeast cells Time (hours) Yeast cells
0 18 10 509
2 39 12 597
4 80 14 640
6 171 16 664
8 336 18 672
;
12. The table gives the midyear population of Spain, in
thousands, from 1955 to 2000.
Use a graphing calculator to fit both an exponential function
and a logistic function to these data. Graph the data points
and both functions, and comment on the accuracy of the
models. [Hint: Subtract 29,000 from each of the population
figures. Then, after obtaining a model from your calculator,
add 29,000 to get your final model. It might be helpful to
choose to correspond to 1955 or 1975.]
13. Consider a population with constant relative birth
and death rates and , respectively, and a constant emigra-
tion rate , where , , and are positive constants. Assume
that . Then the rate of change of the population at time
is modeled by the differential equation
where
(a) Find the solution of this equation that satisfies the initial
condition
(b) What condition on will lead to an exponential expan-
sion of the population?
(c) What condition on will result in a constant population?
A population decline?
(d) In 1847, the population of Ireland was about 8 million
and the difference between the relative birth and death
rates was 1.6% of the population. Because of the potato
famine in the 1840s and 1850s, about 210,000 inhabitants
per year emigrated from Ireland. Was the population
expanding or declining at that time?
Let be a positive number. A differential equation of the
form
where is a positive constant, is called a doomsday equation
because the exponent in the expression is larger than
the exponent 1 for natural growth.
(a) Determine the solution that satisfies the initial condition
(b) Show that there is a finite time (doomsday) such
that .
(c) An especially prolific breed of rabbits has the growth term
. If 2 such rabbits breed initially and the warren has
16 rabbits after three months, then when is doomsday?
ky
1.01
lim
t
l
T
#
y!t" ! %
t ! T
y!0" ! y
0
.
ky
1"c
k
dy
dt
! ky
1"c
c
14.
m
m
P!0" ! P
0
.
k !
&
#
'
dP
dt
! kP # m
t
&
(
'
m
'
&
m
'
&
P ! P!t"
t ! 0
(d) Use your model to predict the year in which the US popu-
lation will exceed 350 million.
One model for the spread of a rumor is that the rate of spread
is proportional to the product of the fraction of the popula-
tion who have heard the rumor and the fraction who have not
heard the rumor.
(a) Write a differential equation that is satisfied by .
(b) Solve the differential equation.
(c) A small town has 1000 inhabitants. At 8
AM, 80 people
have heard a rumor. By noon half the town has heard it.
At what time will of the population have heard the
rumor?
8. Biologists stocked a lake with 400 fish and estimated the
carrying capacity (the maximal population for the fish of that
species in that lake) to be 10,000. The number of fish tripled
in the first year.
(a) Assuming that the size of the fish population satisfies the
logistic equation, find an expression for the size of the
population after years.
(b) How long will it take for the population to increase
to 5000?
(a) Show that if satisfies the logistic equation (4), then
(b) Deduce that a population grows fastest when it reaches
half its carrying capacity.
;
10. For a fixed value of (say ), the family of logistic
functions given by Equation 7 depends on the initial value
and the proportionality constant . Graph several members of
this family. How does the graph change when varies? How
does it change when varies?
;
11. The table gives the midyear population of Japan, in
thousands, from 1960 to 2005.
Use a graphing calculator to fit both an exponential function
and a logistic function to these data. Graph the data points
and both functions, and comment on the accuracy of the
models. [Hint: Subtract 94,000 from each of the population
figures. Then, after obtaining a model from your calculator,
add 94,000 to get your final model. It might be helpful to
choose to correspond to 1960 or 1980.]t ! 0
k
P
0
k
P
0
K ! 10K
d
2
P
dt
2
! k
2
P
$
1 #
P
K
%$
1 #
2P
K
%
P
9.
t
90%
y
y
7.
SECTION 10.4 MODELS FOR POPULATION GROWTH
|| ||
635
Year Population Year Population
1960 94,092 1985 120,754
1965 98,883 1990 123,537
1970 104,345 1995 125,341
1975 111,573 2000 126,700
1980 116,807 2005 127,417
Year Population Year Population
1955 29,319 1980 37,488
1960 30,641 1985 38,535
1965 32,085 1990 39,351
1970 33,876 1995 39,750
1975 35,564 2000 40,016

(d) Use the solution in part (c) to show that if , then
the species will become extinct. [Hint: Show that the
numerator in your expression for is 0 for some value
of .]
18. Another model for a growth function for a limited population
is given by the Gompertz function, which is a solution of
the differential equation
where is a constant and is the carrying capacity.
(a) Solve this differential equation.
(b) Compute .
(c) Graph the Gompertz growth function for ,
, and , and compare it with the logistic
function in Example 2. What are the similarities? What
are the differences?
(d) We know from Exercise 9 that the logistic function grows
fastest when . Use the Gompertz differential
equation to show that the Gompertz function grows fastest
when .
19. In a seasonal-growth model, a periodic function of time is
introduced to account for seasonal variations in the rate of
growth. Such variations could, for example, be caused by
seasonal changes in the availability of food.
(a) Find the solution of the seasonal-growth model
where , , and are positive constants.
;
(b) By graphing the solution for several values of , , and ,
explain how the values of , , and affect the solution.
What can you say about ?
20. Suppose we alter the differential equation in Exercise 19 as
follows:
(a) Solve this differential equation with the help of a table of
integrals or a CAS.
;
(b) Graph the solution for several values of , , and . How
do the values of , , and affect the solution? What can
you say about in this case?
21. Graphs of logistic functions (Figures 2 and 3) look suspi-
ciously similar to the graph of the hyperbolic tangent function
(Figure 3 in Section 7.7). Explain the similarity by showing
that the logistic function given by Equation 7 can be written
as
where . Thus the logistic function is really just
a shifted hyperbolic tangent.
c ! !ln A"'k
P!t" !
1
2
K
[
1 " tanh
(
1
2
k!t # c"
)
]
lim
t
l
%
P!t"
)
rk
)
rk
P!0" ! P
0
dP
dt
! kP cos
2
!rt #
)
"
lim
t
l
%
P!t"
)
rk
)
rk
)
rk
P!0" ! P
0
dP
dt
! kP cos!rt #
)
"
P ! K'e
P ! K'2
c ! 0.05P
0
! 100
K ! 1000
lim
t
l
%
P!t"
Kc
dP
dt
! c ln
$
K
P
%
P
t
P!t"
P
0
*
m
Let’s modify the logistic differential equation of Example 1
as follows:
(a) Suppose represents a fish population at time ,
where is measured in weeks. Explain the meaning of the
term .
(b) Draw a direction field for this differential equation.
(c) What are the equilibrium solutions?
(d) Use the direction field to sketch several solution curves.
Describe what happens to the fish population for various
initial populations.
(e) Solve this differential equation explicitly, either by using
partial fractions or with a computer algebra system. Use
the initial populations 200 and 300. Graph the solutions
and compare with your sketches in part (d).
16. Consider the differential equation
as a model for a fish population, where is measured in
weeks and is a constant.
(a) Use a CAS to draw direction fields for various values
of .
(b) From your direction fields in part (a), determine the
values of for which there is at least one equilibrium
solution. For what values of does the fish population
always die out?
(c) Use the differential equation to prove what you dis-
covered graphically in part (b).
(d) What would you recommend for a limit to the weekly
catch of this fish population?
There is considerable evidence to support the theory that for
some species there is a minimum population such that the
species will become extinct if the size of the population falls
below . This condition can be incorporated into the logistic
equation by introducing the factor . Thus the mod-
ified logistic model is given by the differential equation
(a) Use the differential equation to show that any solution is
increasing if and decreasing if .
(b) For the case where , , and ,
draw a direction field and use it to sketch several solu-
tion curves. Describe what happens to the population for
various initial populations. What are the equilibrium
solutions?
(c) Solve the differential equation explicitly, either by using
partial fractions or with a computer algebra system. Use
the initial population .P
0
m ! 200K ! 1000k ! 0.08
0
*
P
*
mm
*
P
*
K
dP
dt
! kP
$
1 #
P
K
%$
1 #
m
P
%
!1 # m'P"
m
m
17.
c
c
c
c
t
dP
dt
! 0.08P
$
1 #
P
1000
%
# c
CAS
CAS
#15
t
tP!t"
dP
dt
! 0.08P
$
1 #
P
1000
%
# 15
15.
636
|| ||
CHAPTER 10 DIFFERENTIAL EQUATIONS
In this project we explore three of the many applications of calculus to baseball. The physical
interactions of the game, especially the collision of ball and bat, are quite complex and their
models are discussed in detail in a book by Robert Adair, The Physics of Baseball, 3d ed.
(New York: HarperPerennial, 2002).
1. It may surprise you to learn that the collision of baseball and bat lasts only about a thou-
sandth of a second. Here we calculate the average force on the bat during this collision by
first computing the change in the ball’s momentum.
The of an object is the product of its mass and its velocity , that is,
. Suppose an object, moving along a straight line, is acted on by a force
that is a continuous function of time.
(a) Show that the change in momentum over a time interval is equal to the integral
of from to ; that is, show that
This integral is called the impulse of the force over the time interval.
(b) A pitcher throws a 90-mi'h fastball to a batter, who hits a line drive directly back
to the pitcher. The ball is in contact with the bat for 0.001 s and leaves the bat with
velocity 110 mi'h. A baseball weighs 5 oz and, in US Customary units, its mass is
measured in slugs: where .
(i) Find the change in the ball’s momentum.
(ii) Find the average force on the bat.
2. In this problem we calculate the work required for a pitcher to throw a 90-mi'h fastball by
first considering kinetic energy.
The kinetic energy of an object of mass and velocity is given by . Sup-
pose an object of mass , moving in a straight line, is acted on by a force that
depends on its position . According to Newton’s Second Law
where and denote the acceleration and velocity of the object.
(a) Show that the work done in moving the object from a position to a position is equal
to the change in the object’s kinetic energy; that is, show that
where and are the velocities of the object at the positions and .
Hint: By the Chain Rule,
(b) How many foot-pounds of work does it take to throw a baseball at a speed of 90 mi'h?
3. (a) An outfielder fields a baseball 280 ft away from home plate and throws it directly to the
catcher with an initial velocity of 100 ft's. Assume that the velocity of the ball after
seconds satisfies the differential equation because of air resistance. How
long does it take for the ball to reach home plate? (Ignore any vertical motion of the
ball.)
(b) The manager of the team wonders whether the ball will reach home plate sooner if it
is relayed by an infielder. The shortstop can position himself directly between the out-
fielder and home plate, catch the ball thrown by the outfielder, turn, and throw the ball to
dv'dt ! #
1
10
vt
v!t"
m
d
v
dt
! m
d
v
ds
ds
dt
! m
v
dv
ds
s
1
s
0
v
1
! v!s
1
"v
0
! v!s
0
"
W !
y
s
1
s
0
F!s" ds !
1
2
mv
1
2
#
1
2
mv
0
2
s
1
s
0
va
F!s" ! ma ! m
d
v
dt
s
F ! F!s"m
K !
1
2
mv
2
vmK
t ! 32 ft's
2
m ! w't
p!t
1
" # p!t
0
" !
y
t
1
t
0
F!t" dt
t
1
t
0
F
(t
0
, t
1
)
F ! F!t"p ! m
v
v
mmomentum p
CALCULUS AND B ASEBALL
A P P L I E D
P R O J E C T
APPLIED PROJECT C ALCULUS AND BASEBALL
|| ||
637
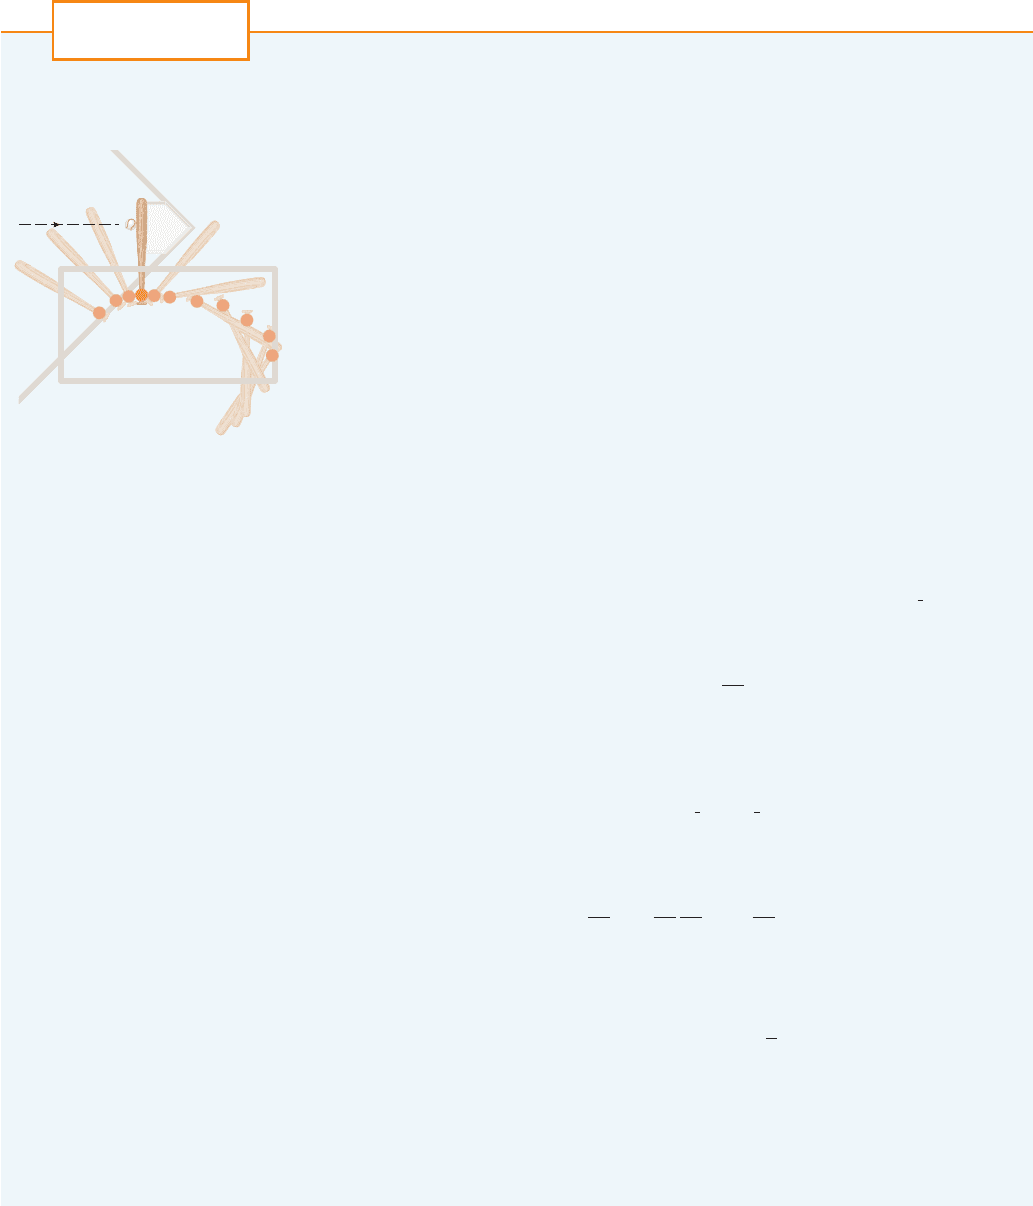
An overhead view of the position of a
baseball bat, shown every fiftieth of
a second during a typical swing.
(Adapted from The Physics of Baseball)
Batter’s box

the catcher with an initial velocity of 105 ft's. The manager clocks the relay time of the
shortstop (catching, turning, throwing) at half a second. How far from home plate should
the shortstop position himself to minimize the total time for the ball to reach home
plate? Should the manager encourage a direct throw or a relayed throw? What if the
shortstop can throw at 115 ft's?
;
(c) For what throwing velocity of the shortstop does a relayed throw take the same time as a
direct throw?
638
|| ||
CHAPTER 10 DIFFERENTIAL EQUATIONS
LINEAR EQUATIONS
A first-order linear differential equation is one that can be put into the form
where and are continuous functions on a given interval. This type of equation occurs
frequently in various sciences, as we will see.
An example of a linear equation is because, for , it can be written
in the form
Notice that this differential equation is not separable because it’s impossible to factor the
expression for as a function of x times a function of y. But we can still solve the equa-
tion by noticing, by the Product Rule, that
and so we can rewrite the equation as
If we now integrate both sides of this equation, we get
or
If we had been given the differential equation in the form of Equation 2, we would have
had to take the preliminary step of multiplying each side of the equation by x.
It turns out that every first-order linear differential equation can be solved in a similar
fashion by multiplying both sides of Equation 1 by a suitable function called an
integrating factor. We try to find so that the left side of Equation 1, when multiplied by
, becomes the derivative of the product :
If we can find such a function , then Equation 1 becomes
!I!x"y"+ ! I!x" Q!x"
I
I!x"!y+ " P!x"y" ! !I!x"y"+
3
I!x"yI!x"
I
I!x"
y ! x "
C
x
xy ! x
2
" C
!xy"+ ! 2x
xy+ " y ! !xy"+
y+
y+ "
1
x
y ! 2
2
x " 0xy+ " y ! 2x
QP
dy
dx
" P!x"y ! Q!x"
1
10.5

Integrating both sides, we would have
so the solution would be
To find such an , we expand Equation 3 and cancel terms:
This is a separable differential equation for , which we solve as follows:
where . We are looking for a particular integrating factor, not the most general
one, so we take and use
Thus a formula for the general solution to Equation 1 is provided by Equation 4, where
is given by Equation 5. Instead of memorizing this formula, however, we just remember
the form of the integrating factor.
To solve the linear differential equation , multiply both sides by
the integrating factor and integrate both sides.
EXAMPLE 1 Solve the differential equation .
SOLUTION The given equation is linear since it has the form of Equation 1 with
and . An integrating factor is
Multiplying both sides of the differential equation by , we get
or
d
dx
!e
x
3
y" ! 6x
2
e
x
3
e
x
3
dy
dx
" 3x
2
e
x
3
y ! 6x
2
e
x
3
e
x
3
I!x" ! e
x 3x
2
dx
! e
x
3
Q!x" ! 6x
2
P!x" ! 3x
2
dy
dx
" 3x
2
y ! 6x
2
V
I!x" ! e
x P!x" dx
y+ " P!x"y ! Q!x"
I
I!x" ! e
x P!x" dx
5
A ! 1
A ! ,e
C
I ! Ae
x P!x" dx
ln
*
I
*
!
y
P!x" dx
y
dI
I
!
y
P!x" dx
I
I!x" P!x" ! I+!x"
I!x"y+ " I!x" P!x"y ! !I!x"y"+ ! I+!x"y " I!x"y+
I
y!x" !
1
I!x"
+y
I!x" Q!x" dx " C
,
4
I!x"y !
y
I!x" Q!x" dx " C
SECTION 10.5 LINEAR EQUATIONS 639

Integrating both sides, we have
M
EXAMPLE 2 Find the solution of the initial-value problem
SOLUTION We must first divide both sides by the coefficient of to put the differential
equation into standard form:
The integrating factor is
Multiplication of Equation 6 by gives
Then
and so
Since , we have
Therefore the solution to the initial-value problem is
M
EXAMPLE 3 Solve .
SOLUTION The given equation is in the standard form for a linear equation. Multiplying by
the integrating factor
we get
or
Therefore e
x
2
y !
y
e
x
2
dx " C
(
e
x
2
y
)
+ ! e
x
2
e
x
2
y+ " 2xe
x
2
y ! e
x
2
e
x 2x dx
! e
x
2
y+ " 2xy ! 1
y !
ln x " 2
x
2 !
ln 1 " C
1
! C
y!1" ! 2
y !
ln x " C
x
xy !
y
1
x
dx ! ln x " C
!xy"+ !
1
x
orxy+ " y !
1
x
x
I!x" ! e
x !1'x" dx
! e
ln x
! x
x ( 0y+ "
1
x
y !
1
x
2
6
y+
y!1" ! 2x ( 0x
2
y+ " x y ! 1
V
y ! 2 " Ce
#x
3
e
x
3
y !
y
6x
2
e
x
3
dx ! 2e
x
3
" C
640
|| ||
CHAPTER 10 DIFFERENTIAL EQUATIONS
N The solution of the initial-value problem in
Example 2 is shown in Figure 2.
F I G U R E 2
(1,2)
5
_5
0 4
F I G U R E 1
6
_3
_1.5 1.8
C=2
C=1
C=_2
C=_1
C=0
N Figure 1 shows the graphs of several members
of the family of solutions in Example 1. Notice
that they all approach as .x l %2
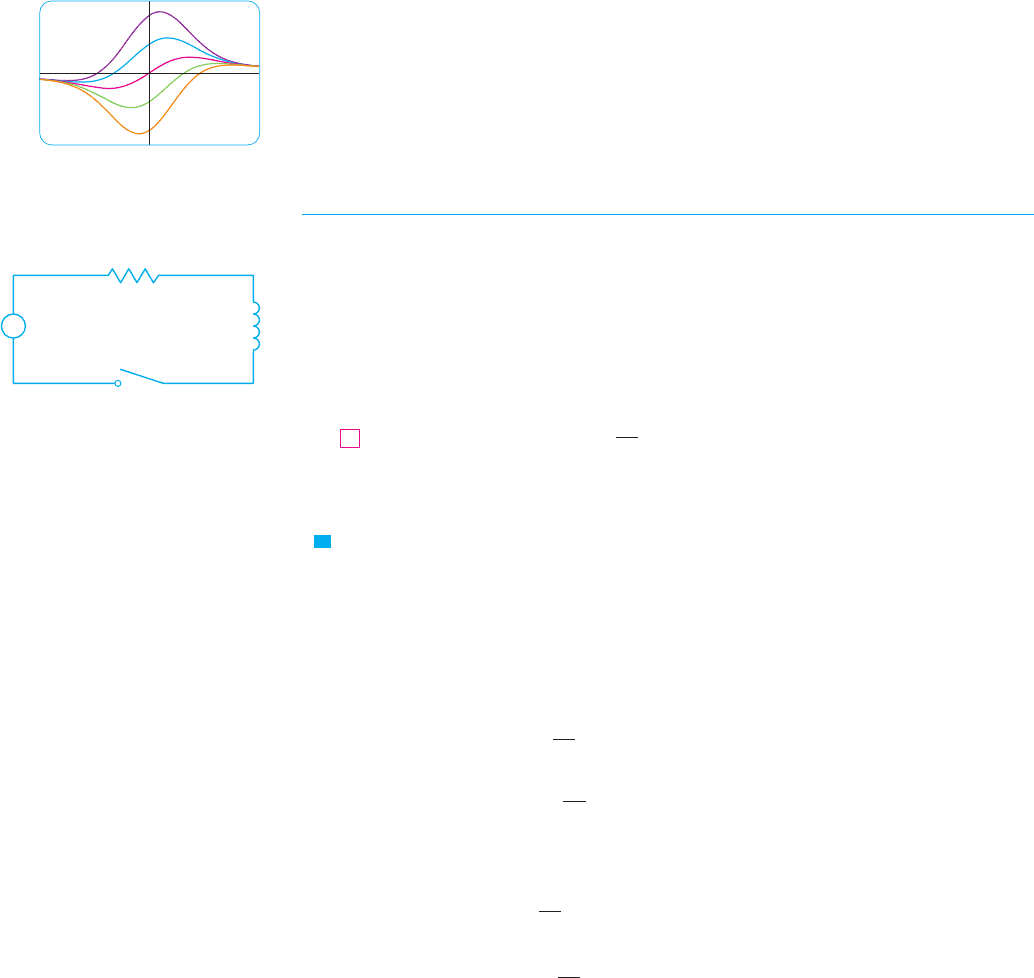
Recall from Section 8.5 that can’t be expressed in terms of elementary functions.
Nonetheless, it’s a perfectly good function and we can leave the answer as
Another way of writing the solution is
(Any number can be chosen for the lower limit of integration.) M
APPLIC ATION TO ELECTRIC CIRCUITS
In Section 10.2 we considered the simple electric circuit shown in Figure 4: An electro-
motive force (usually a battery or generator) produces a voltage of volts (V) and a cur-
rent of amperes (A) at time . The circuit also contains a resistor with a resistance of
ohms ( ) and an inductor with an inductance of henries (H).
Ohm’s Law gives the drop in voltage due to the resistor as . The voltage drop due to
the inductor is . One of Kirchhoff’s laws says that the sum of the voltage drops is
equal to the supplied voltage . Thus we have
which is a first-order linear differential equation. The solution gives the current at time .
EXAMPLE 4 Suppose that in the simple circuit of Figure 4 the resistance is and
the inductance is 4 H. If a battery gives a constant voltage of 60 V and the switch is
closed when so the current starts with , find (a) , (b) the current after
1 s, and (c) the limiting value of the current.
SOLUTION
(a) If we put , , and in Equation 7, we obtain the initial-value
problem
or
Multiplying by the integrating factor , we get
I!t" ! 5 " Ce
#3t
e
3t
I !
y
15e
3t
dt ! 5e
3t
" C
d
dt
!e
3t
I" ! 15e
3t
e
3t
dI
dt
" 3e
3t
I ! 15e
3t
e
x 3 dt
! e
3t
I!0" ! 0
dI
dt
" 3I ! 15
I!0" ! 0 4
dI
dt
" 12I ! 60
E!t" ! 60R ! 12L ! 4
I!t"I!0" ! 0t ! 0
12 -
V
tI
L
dI
dt
" RI ! E!t"
7
E!t"
L!dI'dt"
RI
L-R
tI!t"
E!t"
y ! e
#x
2
y
x
0
e
t
2
dt " Ce
#x
2
y ! e
#x
2
y
e
x
2
dx " Ce
#x
2
x e
x
2
dx
SECTION 10.5 LINEAR EQUATIONS
|| ||
641
N Even though the solutions of the differential
equation in Example 3 are expressed in terms of
an integral, they can still be graphed by a com-
puter algebra system (Figure 3).
F I G U R E 3
C=2
C=_2
2.5
_2.5
_2.5 2.5
F I G U R E 4
R
E
switch
L
N The differential equation in Example 4 is both
linear and separable, so an alternative method is
to solve it as a separable equation (Example 4 in
Section 10.3). If we replace the battery by a gen-
erator, however, we get an equation that is linear
but not separable (Example 5).