Torrieri D. Principles of Spread-Spectrum Communication Systems
Подождите немного. Документ загружается.

338
CHAPTER 6.
CODE-DIVISION MULTIPLE ACCESS
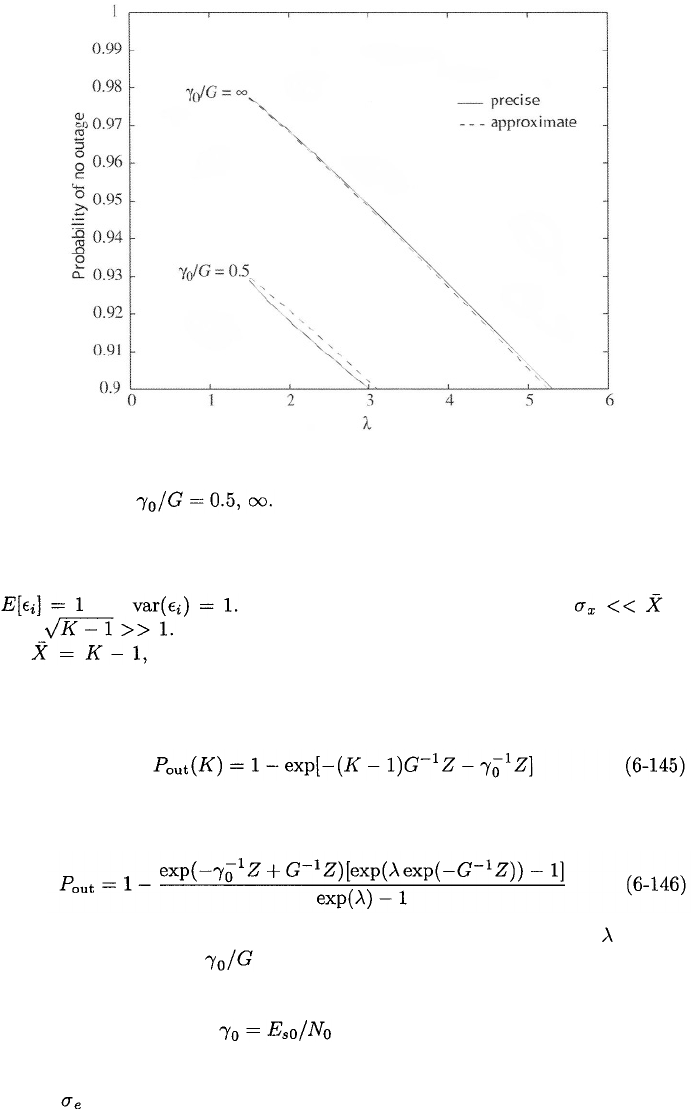
Figure 6.16: Probability of no outage for perfect local-mean power control,
G/Z
= 40, and
For perfect local-mean power control and Rayleigh fading, (6-138) gives
and Therefore, a sufficient condition for is
that If this condition is satisfied, then X is well approximated
by which is equivalent to ignoring the fading of the multiple-
access interference signals. With this approximation, the only remaining ran-
dom variable in (6-124) is exponentially distributed, and hence the conditional
probability of outage given K is
Substituting this equation into (6-136) and evaluating the sum, we obtain the
approximation
Figure 6.16 illustrates the probability of no outage as a function of for G/Z
= 40 and two values of using either the approximation(6-146) or the more
precise (6-144), (6-143), and (6-136). It is observed that neglecting the fading
of the interference signals and using the approximation makes little difference in
the results. The effect of is considerable. A comparison of Figures
6.15 and 6.14 indicates that when Rayleigh fading occurs, even perfect local-
mean power control is not as useful as imperfect instantaneous power control
unless is very large.
6.4.
CELLULAR NETWORKS AND POWER CONTROL
339
Since accurate power measurements require a certain amount of time, whether
a power-control scheme is instantaneous, local mean, or something intermedi-
ate depends on the fading rate. To reduce the fading rate so that the power
control is instantaneous and accurate, one might minimize the carrier frequency
or limit the size of cells if these options are available.
The second analysis of the effects of local-mean power control uses the pre-
ceding results to develop a simple approximation to alternative performance
calculations [19], [20]. This analysis has the advantages that the fading statis-
tics do not have to be explicitly defined and the effect of imperfect local-mean
power control is easily calculated. Let denote the local-mean energy per
symbol, which is defined as the average energy per symbol after averaging over
the fading. Similarly, let denote the total local-mean interference power in
the receiver, and let denote the local-mean received energy per symbol due
to interference signal The local-mean SINR is defined to be
For this analysis, a local-mean outage is said to occur if the local-mean SINR
is less than a specified threshold which may be adjusted to account for the
fading statistics and any diversity or rake combining. When the local-mean
power control is imperfect, and
where and are lognormally distributed random variables with the common
variance A derivation similar to that leading to (6-131) indicates that if
(6-130) is satisfied, then
and is calculated by using (6-136) and (6-137). The intercell interference
factor can be determined by setting since the fading statistics do not
affect the local-mean SINR. For adequate network performance in practical ap-
plications, must be set much higher than the threshold Z in (6-131) because
the local-mean SINR changes much more slowly than the instantaneous SINR.
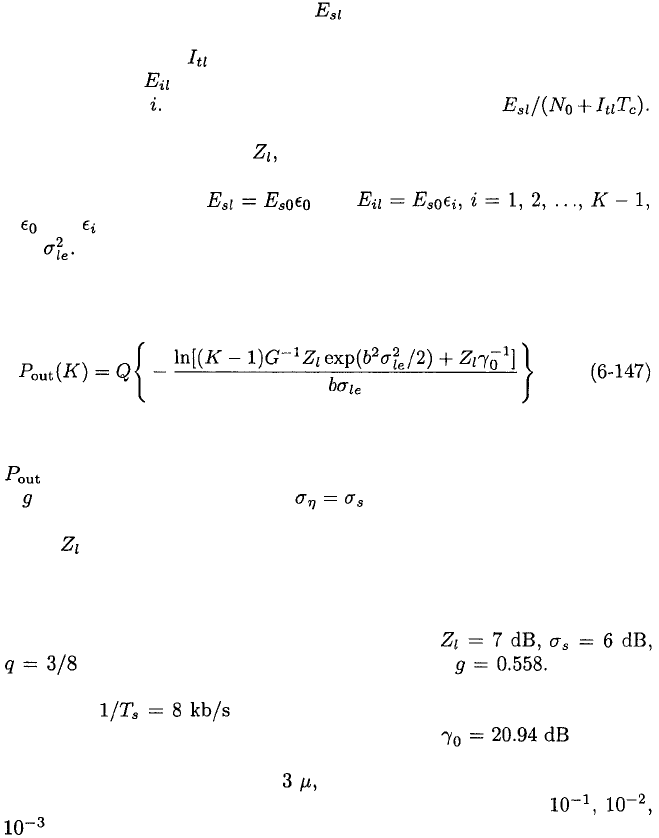
The following example is used to compare the results of evaluating (6-136),
(6-137), and (6-147) with the results obtained in a far more elaborate analysis
[20]. Consider a cellular network with three sectors,
and due to the voice activity. Table 6.1 gives A spectral
band of bandwidth W = 1.25 MHz is occupied by the DS/CDMA signals. The
symbol rate is so that the processing gain is G = 156.5. The
local-mean SNR before the despreading is –1 dB and after the
despreading. Figure 6.17 shows the local-mean outage probability versus the
average number of mobiles per cell, which is triple the average number of
mobiles per sector. The results of [20] for outage probabilities of
and are indicated by the open circles. The proximity of these points to the
graphs indicates that the simple equations (6-136), (6-137), and (6-147) closely
approximate the local-mean outage probability.
340
CHAPTER 6.
CODE-DIVISION MULTIPLE ACCESS
Figure 6.17: Local-mean outage probability for
G = 156.5, and with Other theoretical results
are indicated by the open circles.
Bit-Error-Probability Analysis
Uplink capacity is the number of mobiles per cell that can be accommodated
over the uplink at a specified information-bit error rate. Assuming a conven-
tional correlation receiver and typical conditions for cellular communications,
the subsequent results indicate that when imperfect power control causes the
standard deviation of the received power from each mobile to increase beyond
2 dB, the uplink capacity rapidly collapses. When the instantaneous signal
level cannot be tracked, one might consider measuring the local-mean power.
Accurate local-mean power control eliminates the near-far problem and shad-
owing effects, but not the effects of the fading. In the subsequent analysis, it is
confirmed that tracking the local-mean power is less useful than attempting to
track the instantaneous signal level even if the latter results in large errors.
Consider a CDMA cell or sector with K active mobiles. The direct-sequence
signals use QPSK modulation. Equation (6-86) indicates that the conditional
symbol error probability given and is approximately given by
It is assumed that the distribution of and and the values of and
are such that (6-85), which is used in the derivation of (6-86), is satisfied
6.4.
CELLULAR NETWORKS AND POWER CONTROL
341
with high probability in the subsequent analysis. We consider three models
for power control: perfect instantaneous power control (perfect ipc), imperfect
instantaneous power control (imperfect ipc) with lognormally distributed errors,
and perfect local-mean power control (perfect lmpc).
If the power control is instantaneous and perfect, then
and Equation (6-148) implies that the
conditional symbol error probability given K is
where is the energy-to-noise-density ratio when the power control
is perfect. If the power control is imperfect with lognormally distributed errors,
then
and (6-125) to (6-128) are applicable. If (6-130) is satisfied, then
and X is well-approximated by Since and has a Gaussian
density, (6-148) and an integration over this density yield
Suppose that instead of the instantaneous signal power, the local-mean
power averaged over the fast fading is tracked. If this tracking provides perfect
power control of the local-mean power at a specific level, then a received signal
still exhibits fast fading relative to this level. If the fast fading has a Rayleigh
distribution but the fading level is constant over a symbol interval, then the
received energy per symbol is where has the exponential prob-
ability density function given by (6-138). Therefore, (6-148) implies that the
conditional symbol error probability given is
where the integral is evaluated in the same way as (5-125). The total interfer-
ence energy is given by (6-150) and (6-125), where each is an independent,
exponentially distributed random variable with mean equal to unity. There-
fore, has a gamma probability density function given by (D-49) with
N = K – 1, and for _ the conditional symbol error probability given K is
342
CHAPTER 6.
CODE-DIVISION MULTIPLE ACCESS
Perfect symbol interleaving is defined as interleaving that causes independent
symbol errors in a codeword. Assuming that fast fading enables perfect sym-
bol interleaving, the information-bit error probability for hard-decision
decoding can be calculated by substituting (6-149), (6-151), or (6-153) into (1-
25), (1-26), and (1-27) or into (6-104)for a loosely packed binary code. If is
the code rate of a binary code and is the energy per bit that is available
when the channel symbols are uncoded, then in (6-149), (6-151),
and (6-153). As was done previously, the impact of the intercell interference is
modeled by replacing K with in the preceding equations, where is
obtained from Table 6.1. Averaging over K by using (6-135), we obtain
where the equivalent number of mobiles is given by (6-137).
Suppose that the fading is slow enough that the interleaving is ineffective
and, hence, the error in the instantaneous power control is fixed over a codeword
duration. Then an approximation similar to that preceding (6-151) implies that
the information-bit error probability for hard-decision decoding of a block code
given K is
where is given by (6-104) with replaced by
Equations (6-154) to (6-156) give the information-bit error probability for slow
fading.
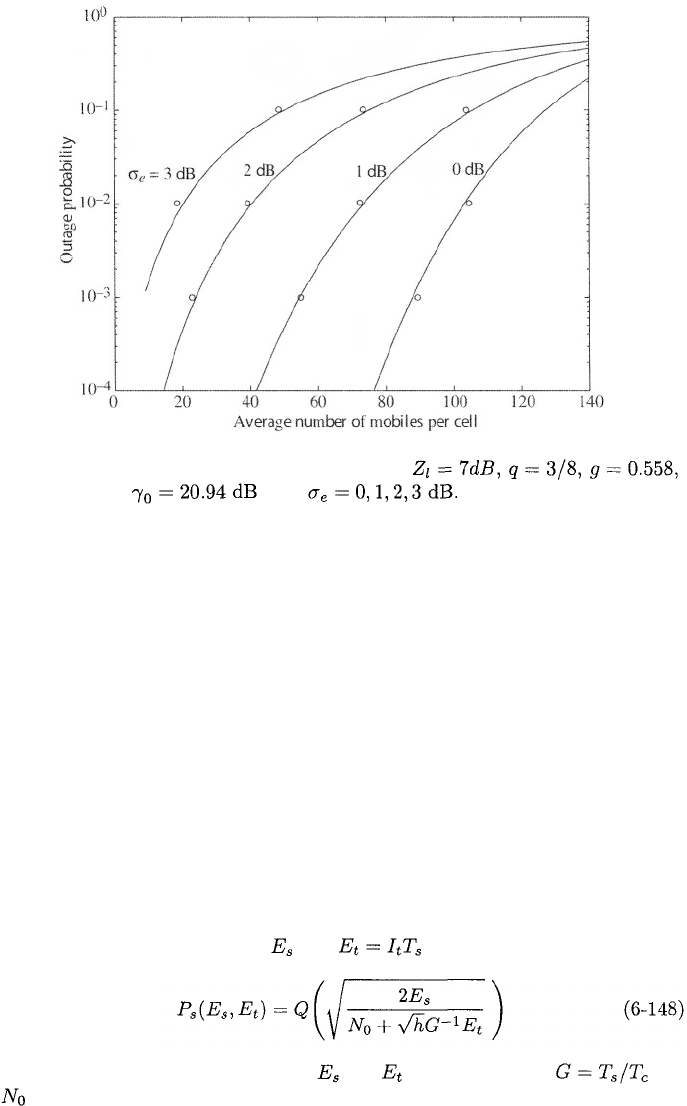
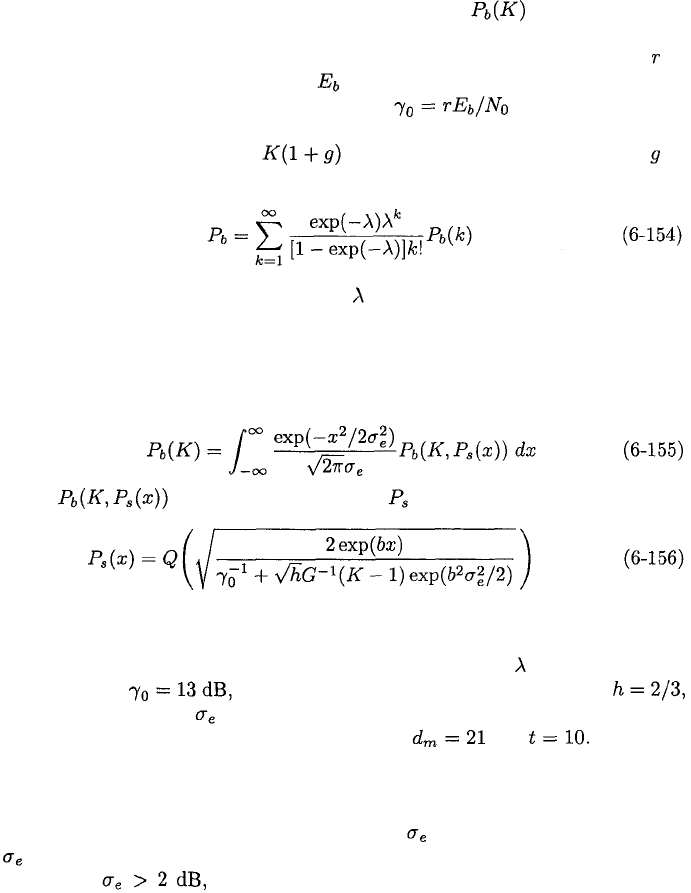
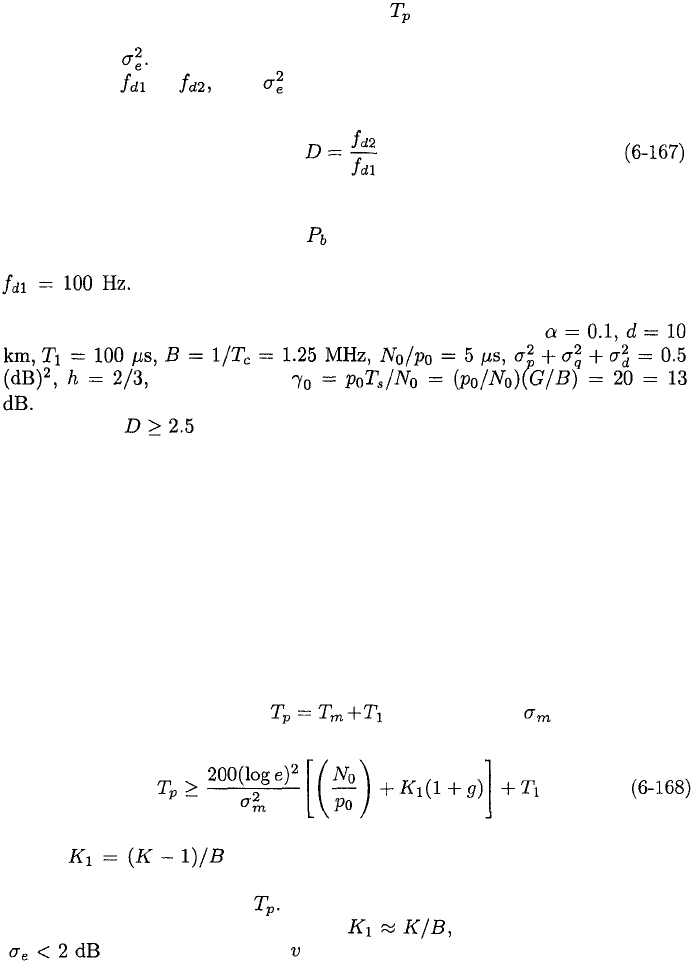
Graphs of the information-bit error probability versus for instantaneous
power control, G = 128, a rectangular chip waveform with
and various values of in decibels are illustrated in Figure 6.18. The block
code is the binary BCH (63,30) code, for which and Equations
(6-155) and (6-156) are used for slow fading, and (6-149), (6-151), and (6-
104) are used for fast fading. When the fading is slow and the interleaving is
ineffective, the coding is, as expected, less effective than when the fading is fast
and the interleaving is perfect, provided that remains the same. However,
increases with the fading rate, as shown subsequently. The figure indicates
that when there is a severe uplink capacity loss for slow fading
and a substantial one for fast fading. The results for other block codes are
qualitatively similar.
The use of spatial diversity or, in the presence of frequency-selective fading,
a rake receiver will improve the performance of a DS/CDMA system during
both slow and fast fading, but the improvement is much greater when the fad-
ing is slow. As the fading rate increases, the accuracy of the estimation of
the channel parameters used in the rake or diversity combiner becomes more
6.4.
CELLULAR NETWORKS AND POWER CONTROL
343
Figure 6.18: Information-bit error probability for instantaneous power control
and perfect local-mean power control, G = 128, and the BCH
(63,30) code with various values of in decibels.
difficult. When the channel-parameter estimation errors are too large to be
accommodated, the coherent maximal-ratio combiner must be replaced by the
suboptimal noncoherent equal-gain combiner, which does not require the esti-
mation of channel parameters.
In Figure 6.18, the information-bit error probability is depicted for perfect
local-mean power control with the same parameter values and coding as for
instantaneous power control. It is assumed that fast fading permits perfect
interleaving so that (6-153) and (6-104) are applicable. The figure confirms
that tracking of the local-mean power level is an inferior strategy for obtaining
a large capacity compared with tracking of the instantaneous power level unless
the inaccuracy of the latter is substantial. Another problem with local-mean
power control is that it requires time that may be unavailable for sporadic data.
Apart from power control, instantaneous power measurements can be used
to facilitate adaptive coding or adaptive transmit diversity. Both of these tech-
niques require timely information about the impact of the fading, and this
information is inherent in the instantaneous power measurements.
Impact of Doppler Spread on Power-Control Accuracy
When the received instantaneous power of the desired signal from a mobile is
tracked, there are four principal error components. They are the quantization
344
CHAPTER 6.
CODE-DIVISION MULTIPLE ACCESS
error due to the stepping of the transmitted power level, the error introduced
in the decoding of the power-control information at the mobile, the error in the
power measurement at the base station, and the error caused by the processing
and propagation delay. Let and denote the standard deviations
of these errors, respectively, expressed in decibels relative to the received power.
Usually, and are much larger than and [13]. The processing and
propagation delay is a source of error because the multipath propagation con-
ditions change during the execution of the closed-loop power-control algorithm.
Assuming that the error sources are independent, the variance of the power-
control error can be decomposed as
If is to be less than 2 dB and is typically more than 1.5 dB [13], then
even if and are small, is required. Let denote the maximum
speed of a mobile in the network, the carrier frequency of its direct-sequence
transmitted signal, and the speed of an electromagnetic wave. It is assumed
that this signal has a bandwidth that is only a few percent of so that the
effect of the bandwidth is negligible. The maximum Doppler shift or Doppler
spread is
which is proportional to the fading rate. To obtain requires
nearly constant values of the channel attenuation during the processing and
propagation delay. Thus, this delay must be much less than the coherence time,
which is approximately equal to as indicated in (5-40). Examination of
attenuation graphs for representative multipath scenarios indicates that this
delay must be less than where or less if is to be
attained. The propagation delay for closed-loop power control is where
is the distance between the mobile and the base station. Therefore, the
processing delay must satisfy
Since must be positive, this inequality and (6-158) imply that
is only possible if Thus, if the carrier frequency or maximum
vehicle speed is too high, then the propagation delay alone makes it impossible
for the system to attain the required throughout the network. If
and then (6-159) and (6-158) give
The IS-95 system, which must accommodate similar parameter
values, uses
Let denote the measured power level of a received signal in decibels;
thus, is an estimate of where is the average received signal
power from a mobile and the logarithm is to the base 10. Let denote the
variance of an estimate of the natural logarithm of It follows that the
variance of is
6.4.
CELLULAR NETWORKS AND POWER CONTROL
345
It is assumed that power variations in a received signal at the base station
are negligible during the measurement interval which is a large component
of the processing delay Errors in the power measurement occur because
of the presence of multiple-access interference and white Gaussian noise. A
lower bound on can be determined by assuming that the power control
is effective enough that the received powers from the mobiles in the cell or
sector are approximately equal. The multiple-access interference is modeled as
a Gaussian process that increases the one-sided noise power spectral density
from to
where is the common signal power of each mobile at the base station and B
is the bandwidth of the receiver.
The received signal from a mobile that is to be power-controlled has the
form where has unity power. Thus,
The received signal can be expressed as
where The Cramer-Rao bound [21] provides a lower bound on the
variance of any unbiased estimate or measurement of This bound and
(6-163) give
Evaluating (6-164) and using (6-160) and (6-161), we obtain
Let denote the part of the processing delay in excess of the
measurement interval. Substituting (6-157) and (6-159) into (6-165), we obtain
This lower bound indicates that increases with and, hence, the fading
rate when the power estimation is ideal.
Inequality (6-166) indicates that an increase in the Doppler spread can be
offset by an increase in the bandwidth B. This observation clarifies why third-
generation cellular CDMA systems such as WCDMA or cdma 2000 exhibit no
more sensitivity to power-control errors than the IS-95 system despite the sub-
stantial increase in the fading rate due to the increased carrier frequency. The
346
CHAPTER 6.
CODE-DIVISION MULTIPLE ACCESS
physical reason is that an expansion of the bandwidth of the direct-sequence
signals allows enough interference suppression to more than compensate for the
increased Doppler spread. Furthermore, the potential effect of power-control er-
rors on third-generation CDMA systems is mitigated by the use of convolutional
and turbo codes more powerful than the IS-95 codes.
Consider a network of CDMA systems that do not expand the bandwidth
when the Doppler spread changes, but adjust so that (6-159) provides a tight
bound. Ideal power estimation is assumed so that the lower bound in (6-166)
approximates If the other parameters are unchanged as the Doppler spread
changes from to then is only affected by the Doppler factor defined
as
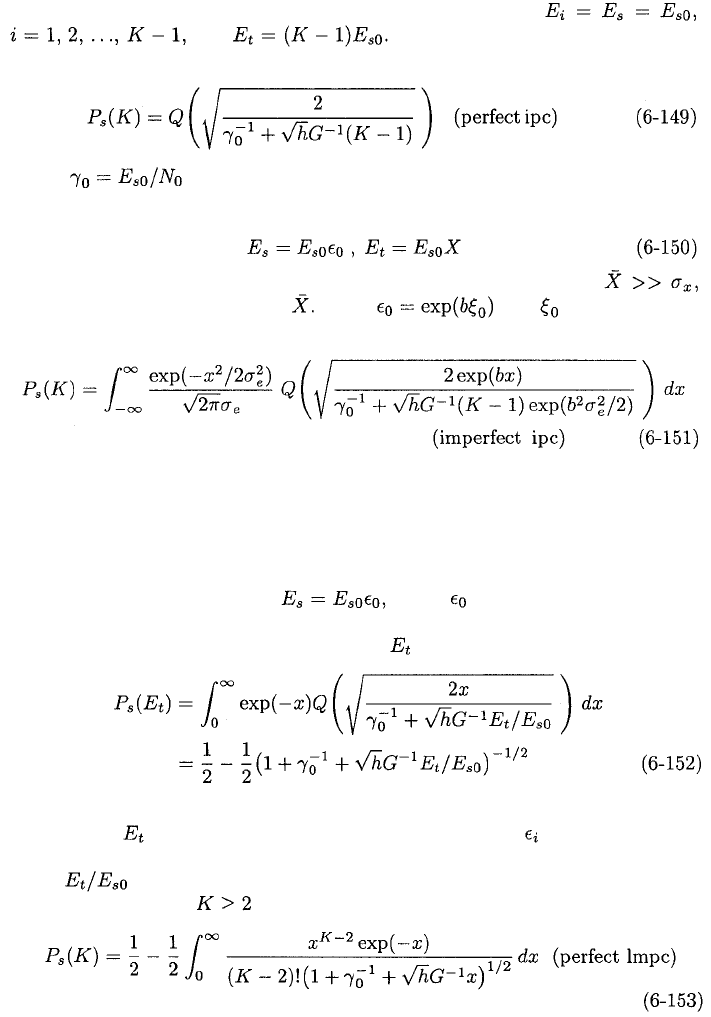
An example of the impact of the Doppler factor is illustrated in Figure 6.19,
which shows the upper bounds on for instantaneous power control and the
BCH (63,30) code. The network experiences slow fading and a Doppler spread
The Doppler factor is D = 1. When the Doppler factor is
D = 2, 3, or 4, perhaps because of increased vehicular speeds, the network is
assumed to experience fast fading. The parameter values are
G =
128,
and
The calculations use (6-166), (6-151), (6-104), and (6-154) to (6-156). In
this example, causes a significant performance degradation despite the
improved time diversity during the fast fading.
When fast fading causes large power-control errors, a DS/CDMA network
exhibits a significant performance degradation, notwithstanding the exploita-
tion of time diversity by interleaving and channel coding. Adopting long-term-
average instead of instantaneous power control will not cure the problem. A
better approach is to increase the bandwidth of the direct-sequence signals. If
the bandwidth cannot be increased enough, then the Doppler spread might be
reduced by minimizing the carrier frequency of the direct-sequence signals. An-
other strategy is to limit the size of cells so that the network must cope with the
more benign Ricean fading rather than Rayleigh fading, which is more likely to
cause large power-control errors.
It follows from (6-165) and that a specified can be attained
if
where is the number of interfering active mobiles per unit
bandwidth in the cell or sector. Inequalities (6-168) and (6-159) restrict the
range of feasible values for Combining (6-158), (6-159), and (6-168) and
assuming that K
is
large enough that we conclude that to attain
for vehicles at speed or less, an approximate upper bound on the
6.4.
CELLULAR NETWORKS AND POWER CONTROL
347
Figure 6.19: Information-bit error probability for slow fading and fast fading
with different Doppler factors D. Instantaneous power control and the BCH
(63,30) code are used.
uplink capacity per unit bandwidth in a cell or sector is given by
For typical parameter values, this upper bound is approximately inversely pro-
portional to both the carrier frequency and the maximum vehicle speed
Figure 6.20 illustrates the upper bound on the uplink capacity per megahertz
as a function of frequency for
and representative values of and Table 6.1 gives
The figure indicates the limitations on due to power control as the carrier
frequency increases if and the other parameters remain fixed. If exceeds
the upper bound, then the network performance will be severely degraded. The
uplink capacity can be maintained by expanding the bandwidth.
Downlink Power Control and Outage
Along with all the signals transmitted to mobiles associated with it, a base
station transmits a pilot signal over the downlinks. A mobile, which is usually
associated with the base station from which it receives the largest pilot signal,
uses the pilot to identify a base station or sector, to initiate uplink power control,
to estimate the attenuation, phase shift, and delay of each significant multipath