Torrieri D. Principles of Spread-Spectrum Communication Systems
Подождите немного. Документ загружается.

368
CHAPTER 6.
CODE-DIVISION MULTIPLE ACCESS
probability:
where and is the local-mean power of the desired
signal. A comparison of this equation with (5-135) and (5-169) when
so that verifies that MSK with discriminator demodulation and square-
law postdetection combining provides nearly the same as ideal DPSK. The
slowly varying shadowing in practical networks ensures that is almost al-
ways nearly constant over an interleaved codeword or constraint length. The
information-bit error rate following hard-decision decoding can be calculated
from with the equations of Chapter 1. The theoretical loss due to using
postdetection rather than predetection combining is less than a decibel [32].
Peer-to-Peer Networks
Consider a peer-to-peer network of independent, identical, frequency-hopping
systems that have L omnidirectional antennas, generate the same output power,
share the same carriers and frequency channels, and are nearly stationary in
location over a single symbol duration. The antennas are separated from each
other by several wavelengths, so that the fading of both the desired signal and
the interfering signals at one antenna is independent of the fading at the other
antennas. A few wavelengths are adequate because mobiles, in contrast to
base stations, tend to receive superpositions of reflected waves arriving from
many random angles. Because of practical physical constraints, spatial diver-
sity will ordinarily be effective only if the carrier frequencies exceed roughly 1
GHz. Polarization diversity and other forms of adaptive array processing are
alternatives.
Since for peer-to-peer communications it is assumed that an interfering mo-
bile may transmit in any frequency channel with equal probability, the probabil-
ity that power from an interferer enters the transmission channel of the desired
signal is
It is assumed that M is sufficiently large that we may neglect the fact that a
channel at one of the ends of the hopping band has only one adjacent channel
instead of two. Consequently, the probability that the power from an interferer
enters one of the two adjacent channels of the desired signal is
The probability that the power enters neither the transmission channel nor
the adjacent channels is These equations make it apparent that
the performance of a frequency-hopping system depends primarily on the ratio
This ratio is called the equivalent number of channels because any
decrease in the duty factor has the same impact as an increase in the number
of frequency channels; what matters most for performance is this ratio.
6.6.
FREQUENCY-HOPPING MULTIPLE ACCESS
369
Figure 6.28: Geometry of a peer-to-peer communication network.
In the simulation, the locations of the mobiles are assumed to be uniformly
distributed in a circular region surrounding a specific mobile receiver, as il-
lustrated in Figure 6.28. Therefore, the radial distance of a mobile from the
receiver has the probability distribution function
where R is the radius of the circle. The distance of the desired mobile is
randomly selected according to this distribution with where is
the maximum communication range and corresponds to a received area-mean
signal power equal to The distance of each interfering mobile is randomly
selected according to this distribution with The selected distance of
the desired mobile is substituted into (6-216) as the value of and then (6-
216) is used to randomly select the local-mean power of the desired signal at the
receiver. The probabilities given by (6-219) and (6-220) are used to determine
if an interfering mobile produces power in the transmission channel or in one of
the adjacent channels of the desired signal. If the power enters the transmission
channel, then the power level is randomly selected according to (6-216) with
the distance of the mobile substituted. If the power enters one of the adjacent
channels, then the potential local-mean power level is first randomly selected
via (6-216) and then multiplied by the adjacent-splatter ratio (Chapter 3) to
determine the net interference power that appears in (6-217). The effects of
and are determined solely by the minimum area-mean SNR, which occurs
at the maximum range of the desired signal and is equal to
370
CHAPTER 6.
CODE-DIVISION MULTIPLE ACCESS
Once the local-mean power levels and the noise power are calculated, the
symbol error probability is calculated with (6-217) and (6-218) subject to the
constraint that Each simulation experiment was repeated for 10,000
trials, with different randomly selected mobile locations in each trial. The
performance measure is the spatial reliability, which is defined as the fraction
of trials for which is less than a specified performance threshold E. The
appropriate value of the threshold depends on the desired information-bit error
probability and the error-control code. The spatial reliability is essentially the
probability that an outage does not occur.
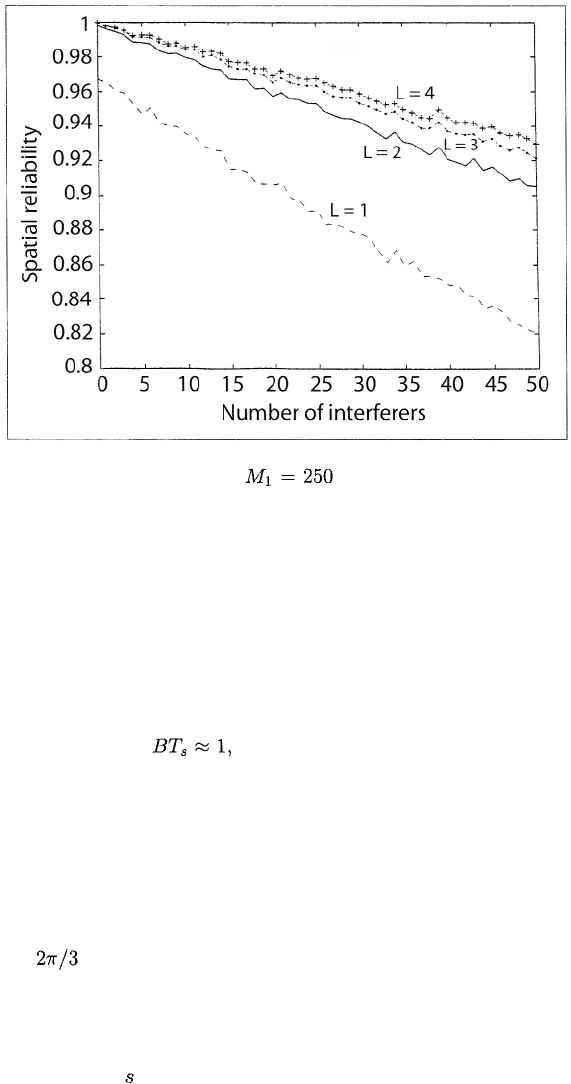
Figures 6.29 to 6.31 depict the results of three simulation experiments for
peer-to-peer networks. The figures plot the spatial reliability as a function of
K -1 for various values of L, assuming Rayleigh fading, MSK, and (6-218) with
the constraint that The parameter values are
E = 0.01, and The value of results
from assuming contiguous frequency channels with center frequencies separated
by B. The units of and are immaterial to the calculation of the spatial
diversity.
Figure 6.29 provides a baseline with which the other figures may be com-
pared. For this figure, the assumptions are that and the minimum
area-mean SNR = 20 dB. The number of equivalent frequency channels
could model voice communications with
M
= 90 channels and alter-
natively, it could model continuous data communications with
M
= 225 and
The figure illustrates the dramatic performance improvement provided
by dual spatial diversity when Rayleigh fading occurs. Further increases in
diversity yield diminishing returns. One can assess the impact of the spectral
splatter in this example by setting and observing the change in the
spatial reliability. The change is small, and nearly imperceptible if K < 25.
Figure 6.30 illustrates the effect of increasing the number of equivalent chan-
nels to Let the capacity of the network be defined as the maximum
number of interfering mobiles for which the spatial reliability exceeds 0.95. Fig-
ures 6.28 and 6.29 and other simulation results indicate that for the parameter
values selected, the capacity C for dual spatial diversity is approximately pro-
portional to specifically, for If E is
increased to 0.02, the capacity for dual spatial diversity increases by approxi-
mately 20 percent.
Figure 6.31 illustrates the sensitivity of the network to an increase in the
minimum area-mean SNR, which may be due to a change in or For
no spatial diversity or dual diversity, a substantial performance improvement
occurs when the minimum area-mean SNR = 25 dB. Other simulation results
indicate that a decrease in the minimum area-mean SNR below 20 dB severely
degrades performance.
Since (6-218) relates to the local-mean SINR, the spatial reliability
has an alternative and equivalent definition as the fraction of trials for which
the SINR exceeds a specified threshold Thus, the graphs labeled L = 1, 2,
3, and 4 in Figures 6.29 to 6.31 (and later in Figures 6.33 to 6.36) correspond
to 10.0 dB, 7.7 dB, and 6.5 dB, respectively.
6.6.
FREQUENCY-HOPPING MULTIPLE ACCESS
371
Figure 6.29: Spatial reliability for and minimum area-mean SNR =
20 dB.
Figure 6.30: Spatial reliability for and minimum area-mean SNR =
20 dB.
372
CHAPTER 6. CODE-DIVISION MULTIPLE ACCESS
Figure 6.31: Spatial reliability for and minimum area-mean SNR =
25 dB.
The performance of FH/CDMA communications in a mobile peer-to-peer
network is greatly improved by the use of spatial diversity, which usually re-
quires carrier frequencies in excess of 1 GHz. A crucial parameter is the number
of equivalent frequency channels, which can be increased not only by an increase
in the number of frequency channels, but also by a decrease in the duty factor
of the network mobiles. The data modulation method that is most suitable
appears to be MSK or some other form of CPM such as GMSK (Chapter 3).
For these modulations, and the scenario modeled, the spectral splat-
ter from adjacent channels, is not an important factor if the number of active
interferers is much smaller than the number of equivalent channels.
Cellular Networks
In a cellular network, each base station assigns separate directional sector an-
tennas or separate outputs of a phased array to cover disjoint angular sectors
in both the transmitting and receiving modes. Typically, there are three sec-
tors, and radians are in each angular sector. The mobile antennas are
assumed to be omnidirectional. Ideal sector antennas have uniform gain over
the covered sector and negligible sidelobes. With these antennas, only mobiles
in the covered sector can cause multiple-access interference on an uplink from
a mobile to a base station, and the number of interfering signals on the link is
reduced by a factor approximately equal to the number of sectors. Only the
antenna serving a cell sector oriented toward a mobile can cause multiple-access
6.6.
FREQUENCY-HOPPING MULTIPLE ACCESS
373
interference on a downlink from the controlling base station to a mobile. There-
fore, the number of interfering signals is reduced approximately by a factor on
both the uplinks and downlinks. Practical sector antennas have patterns with
sidelobes that extend into adjacent sectors, but the performance degradation
due to overlapping sectors is significant only for a small percentage of mobile
locations. Ideal sector antennas are assumed in the subsequent simulation.
Spatial diversity may be obtained through the deployment of L antennas
in each mobile and L antenna elements for each sector antenna of each base
station. The antennas are separated from each other enough that the fading of
both the desired signal and the interfering signals at one antenna is independent
of the fading at the other antennas. A few wavelengths are adequate for a mobile
because it tends to receive superpositions of reflected waves arriving from many
random angles. Many wavelengths separation may be necessary for a base
station located at a high position, and polarization diversity may sometimes be
a more practical means of obtaining diversity.
In a cellular network, the frequency-hopping patterns can be chosen so that
at any given instant in time, the frequencies of the mobiles within a cell sector
are all different and, hence, the received signals are all orthogonal if the mobile
transmissions are properly synchronized. Exact synchronization on a downlink
is possible because a common timing is available. The advancing or retarding of
the transmit times of the mobiles enables the arrival times at the base station
of the uplink signals to be synchronized. The switching time or guard time
between frequency-hopping pulses must be large enough to ensure that neither a
small synchronization error nor multipath signals can subvert the orthogonality.
The appropriate transmit times of a mobile can be determined from position
information provided by the Global Positioning System and the known location
of the base station. Alternatively, the transmit times can be determined from
arrival-time measurements at the base station that are sent to the mobile. These
measurements may be based on the adaptive thresholding [33] of the leading
and/or trailing edges of a sequence of frequency-hopping pulses.
Let denote the number of mobiles assigned to a cell sector. To ensure
orthogonality of received signals within a cell sector, a simple procedure is
to generate a periodic frequency-hopping pattern that does not repeat until all
the carrier frequencies in a hopset of size have been used. Mobile
is assigned this pattern with a delay of hop durations, where
If the patterns associated with different sectors are all drawn from a
set of one-coincidence sequences [34], then any two signals from different cells
or sectors will collide in frequency at a base station at most once during the
period of the hopping patterns. However, the use of one-coincidence sequences
throughout a network requires frequency planning, which may be too costly in
some applications.
It is possible to ensure not only the orthogonality of signals in a sector
but also that the received carrier frequencies in any two patterns are separated
by at least where is a positive integer, so that the spectral splatter is
greatly reduced or negligible. Let M–
1
label the hopset
frequencies in ascending order. Suppose that a frequency-hopping pattern is
374
CHAPTER 6.
CODE-DIVISION MULTIPLE ACCESS
generated that does not repeat until all the carrier frequencies in a hopset of
size have been used. When mobile 1 hops to frequency mobile
hops to frequency modulo
M
. Frequency-hopping signals that
use frequencies determined by this procedure are called separated orthogonal
signals. Choosing will generally be adequate because spectral splatter
from channels that are not adjacent will be nearly always insignificant if a
spectrally compact data modulation is used.
FH/CDMA networks largely avoid the near-far problem by continually chang-
ing the carrier frequencies so that frequency collisions become brief, unusual
events. Thus, power control in a FH/CDMA network is unnecessary, and all
mobiles may transmit at the same power level. When power control is used,
it tends to benefit signals from mobiles far from an associated sector antenna,
while degrading signals from mobiles close to it. Simulation results [35] indicate
that even perfect power control typically increases system capacity by only a
small amount. There are good reasons to forego this slight potential advantage
and not use power control. The required overhead may be excessive. If geolo-
cation of mobiles is done by using measurements at two or more base stations,
then the power control may result in significantly less signal power arriving at
one or more base stations and the consequent loss of geolocation accuracy.
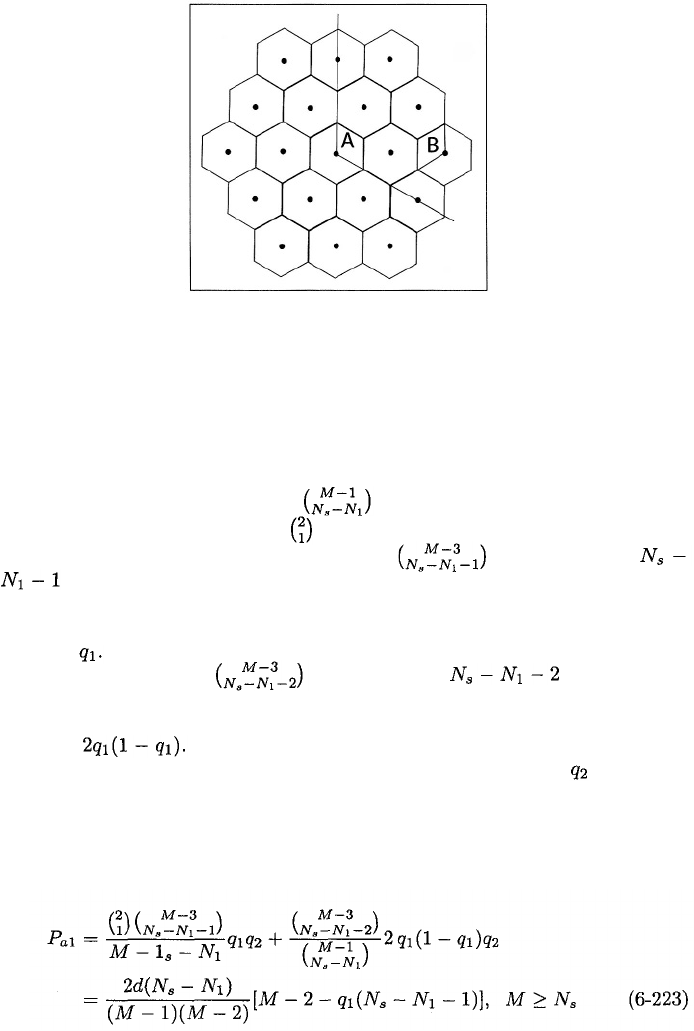
Conside
r
communications between a base station and a mobile assigned
to sector A of a particular cell, as illustrated in Figure 6.32 for a hexagonal
grid of cells. Because of orthogonality, no other signal in sector A will use
the same carrier frequency at the same time and thereby cause interference in
the transmission channel (current frequency channel) of either the uplink or
downlink. Consider another sector covered by the sector antenna of sector A;
an example is sector B. Assuming that an interfering signal may independently
use any frequency in the network hopset with equal probability, the probability
that a mobile in the covered sector produces interference in the transmission
channel of the uplink and degrades a particular symbol is
This equation also gives the probability that a sector antenna serving another
sector that is oriented toward the desired mobile degrades a symbol by pro-
ducing interference in the transmission channel of the downlink. Because of
orthogonality within each sector, no more than one signal from a sector will
produce interference in the transmission channel of either link. A sector with
mobiles that may interfere with communications over an uplink or a sector
with an antenna that may produce interference over a downlink is called an
interfering sector.
It is assumed that M is sufficiently large that we may neglect the fact that
a channel at one of the ends of the hopping band has only one adjacent channel
within the band instead of two. Let if a signal from an interfering sector
uses the transmission channel of communicators in sector A; let if it
does not. The probability that is The interference
signals from a sector that do not enter the transmission channel are assumed
6.6.
FREQUENCY-HOPPING MULTIPLE ACCESS
375
Figure 6.32: Hexagonal grid of cells. Communicators are in sector A. Sector B
is an interfering sector.
to be randomly distributed among the
M
– 1 frequency channels excluding the
transmission channel. There are ways to choose the channels with
interference signals. There are ways to choose one of the two adjacent
channels to have an interference signal and ways to choose
channels with interference signals out of the
M
– 3 channels excluding
both the transmission channel and the adjacent channels. The probability that
an adjacent channel with an interference signal actually receives interference
power is Similarly, there is one way to choose both adjacent channels with
interference signals and ways to choose channels with
interference signals out of
M
– 3 channels. The probability that exactly one of
the two adjacent channels with interference signals actually receives interference
power is Because of the sector synchronization, either all of the
signals from a sector overlap a desired symbol with probability or none of
them do. Therefore, the probability that a symbol is degraded by interference
in exactly one of the adjacent channels of the communicators is
Similarly, the probability that a symbol is degraded by interference in both
376
CHAPTER 6.
CODE-DIVISION MULTIPLE ACCESS
adjacent channels is
For adjacent-channel interference from within sector A, and are given
by the same equations with to reflect the fact that one of the mobiles
is the communicating mobile.
Suppose that separated orthogonal frequency-hopping patterns with
are used. There is no adjacent-channel interference from sector A. If a signal
from an interfering sector B uses the transmission channel so that
an event with probability then the carrier separation of the signals
generated in sector B ensures that there is no adjacent-channel interference
from sector B. Suppose that no signal from sector B uses the transmission
channel so that Interference in exactly one adjacent channel results if
the transmission channel of the desired signal in sector A, which may be any of
channels, is located next to one of the two end channels of a set of
separated channels being used in sector B, neglecting hopset end effects. It also
results if the transmission channel is located between two separated channels, of
which only one is currently being used in sector B, again neglecting hopset end
effects. Therefore, the probability that a symbol is degraded by interference in
exactly one of the adjacent channels of the communicators is
Interference in both adjacent channels results if the transmission channel is
located between two separated channels of sector B and both are being used,
neglecting hopset end effects. Therefore, the probability that a symbol is de-
graded by interference in both adjacent channels is
If then
In the simulation, the spatial configuration consists of a hexagonal grid of
cells with base stations at their centers. Each cell has a radius from its center
to a corner. A central cell is surrounded by an inner concentric tier of 6 cells
and an outer concentric tier of 12 cells, as depicted in Figure 6.32. Other tiers
are assumed to generate insignificant interference in the central cell. An equal
number of mobiles, each transmitting at the same power level, is located in each
sector and served by that sector’s antenna. This assumption is pessimistic since
slightly improved performance may be possible if a mobile is served by the sector
6.6.
FREQUENCY-HOPPING MULTIPLE ACCESS
377
antenna providing a signal with the least attenuation, and if hysteresis effects
during handoffs are not too severe. Each signal transmitted by a sector antenna
is allocated the same power. The set of frequency-hopping patterns used in each
secto
r
is assumed to be selected independently of the other sectors. Since the
parameter in (6-216) is equal to the maximum communication range, is
th
e
minimum received area-mean power of a desired signal. The location of
each mobile within a sector is assumed to be uniformly distributed.
In each simulation trial for communications in sector A of the central cell,
the location of the desired mobile is randomly selected according to the uniform
distribution. The selected distance of the desired mobile is substituted into (6-
216) as the value of and then (6-216) is used to randomly select the local-mean
power of the desired signal at the receiver. Each transmitting and receiving
beam produced by a sector antenna is assumed to have a constant gain over its
sector and zero gain elsewhere.
For an uplink of sector A, interference is assumed to arrive from mobiles
within sector A, mobiles in the 6 sectors of the two cells in the inner tier that
were covered by the beam of sector A, and mobiles in the 11 complete sectors
and 2 half-sectors of the five cells in the outer tier completely or partially covered
by the beam. The 2 half-sectors are approximated by an additional complete
sector in the outer tier. Equations (6-222) to (6-226) are used to determine if
a sector contains mobiles that produce power in the transmission channel or in
one or both of the adjacent channels. If the sector does, then the locations of
the three or fewer interfering mobiles are randomly selected according to the
uniform distribution, and their distances from the central cell’s base station are
computed.
For a downlink of sector A, interference is assumed to arrive from the facing
sector antenna of each cell in the two surrounding tiers. Equations (6-222)
to (6-226) are used to determine if a signal generated by an interfering sector
antenna produces power in the transmission channel or the adjacent channels
of the desired signal. If so, then the distance between the sector antenna and
the desired mobile is computed. The angular location of the desired mobile is
randomly selected from a uniform distribution over the radians spanning
sector A.
If the power from an interferer enters the transmission channel, then the
power level is randomly selected according to (6-216), with the appropriate dis-
tance substituted. If the power enters an adjacent channel, then the potential
local-mean power level is first randomly selected via (6-216) and then multiplied
by to determine the net interference power that appears in (6-217). The
shadowing parameter is assumed to be the same for all signals originating
from all cells. The effects of and are determined solely by the min-
imum area-mean SNR. Since only ratios affect the performance, the numerical
value of in the simulation is immaterial and is set equal to unity.
Once the local-mean power levels and the noise power are calculated, the
symbol error probability is calculated with (6-217) and (6-218) subject to the
constraint that Each simulation experiment was repeated for 20,000
trials, with different randomly selected mobile locations in each trial. The