Townsend C.R., Begon M., Harper J.L. Essentials of Ecology
Подождите немного. Документ загружается.

Chapter 3 Physical conditions and the availability of resources
79
Protoplasts per µlProportion patent infections
400
500
300
200
100
0
02
0.2
0
0.4
0.6
0.8
2
Hours over 38°C threshold
46810240
4 6 8 10 12
Time (days)
25°C
30°C
15°C
35°C
(a)
(b)
(c)
Exposure to 40°C (h day
–1
)
12
8
4
0
12
8
4
0
12
8
4
0
Watford City
North Dakota, 1988
Watford City
North Dakota, 1989
East Twin Butte
North Dakota, 1989
Jun 8
Jun 15
Jun 22
Jun 29
Jul 6
Jul 13
Jul 20
Jul 27
Jun 1
Date
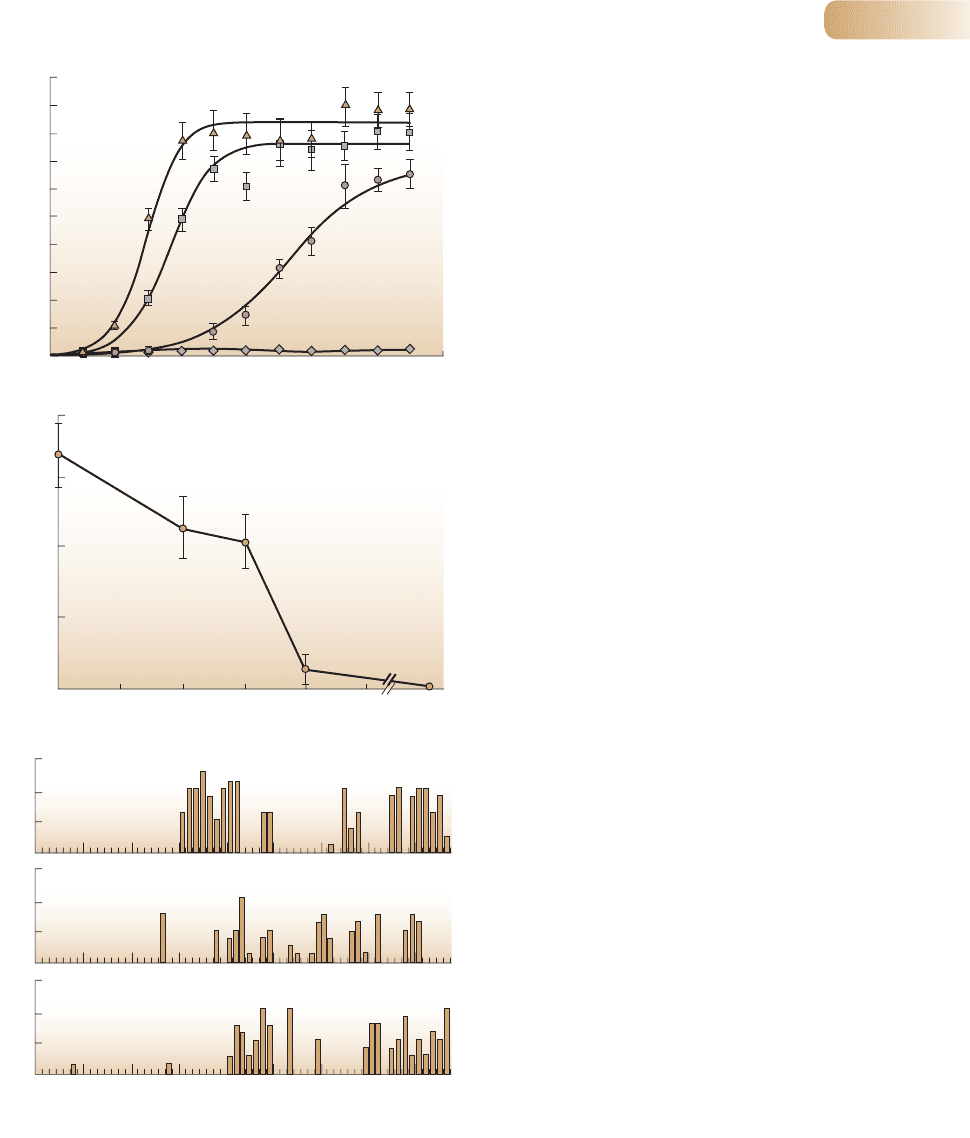
Figure 3.7
The effect of temperature on the interaction between the fungal
pathogen, Entomophaga grylli, and the grasshopper, Camnula
pellucida. (a) Growth curves over time of the pathogen (expressed
as protoplasts per µl) at a range of temperatures: growth ceases
at temperatures of around 38°C and higher. (b) The proportion of
grasshoppers with patent (i.e. observable) infection with the
pathogen drops sharply as grasshoppers spend more of their time
at such higher temperatures. (c) Grasshoppers at two sites over
2 years did frequently raise their body temperatures to such high
levels by basking.
AFTER CARRUTHERS ET AL., 1992
9781405156585_4_003.qxd 11/5/07 14:44 Page 79

Part II Conditions and Resources
80
1.0
0
Survival rate function
Experiment period (days)
100 200
0.5
0 100 2000
6°C 12°C
S. leucomaenis
S. malma
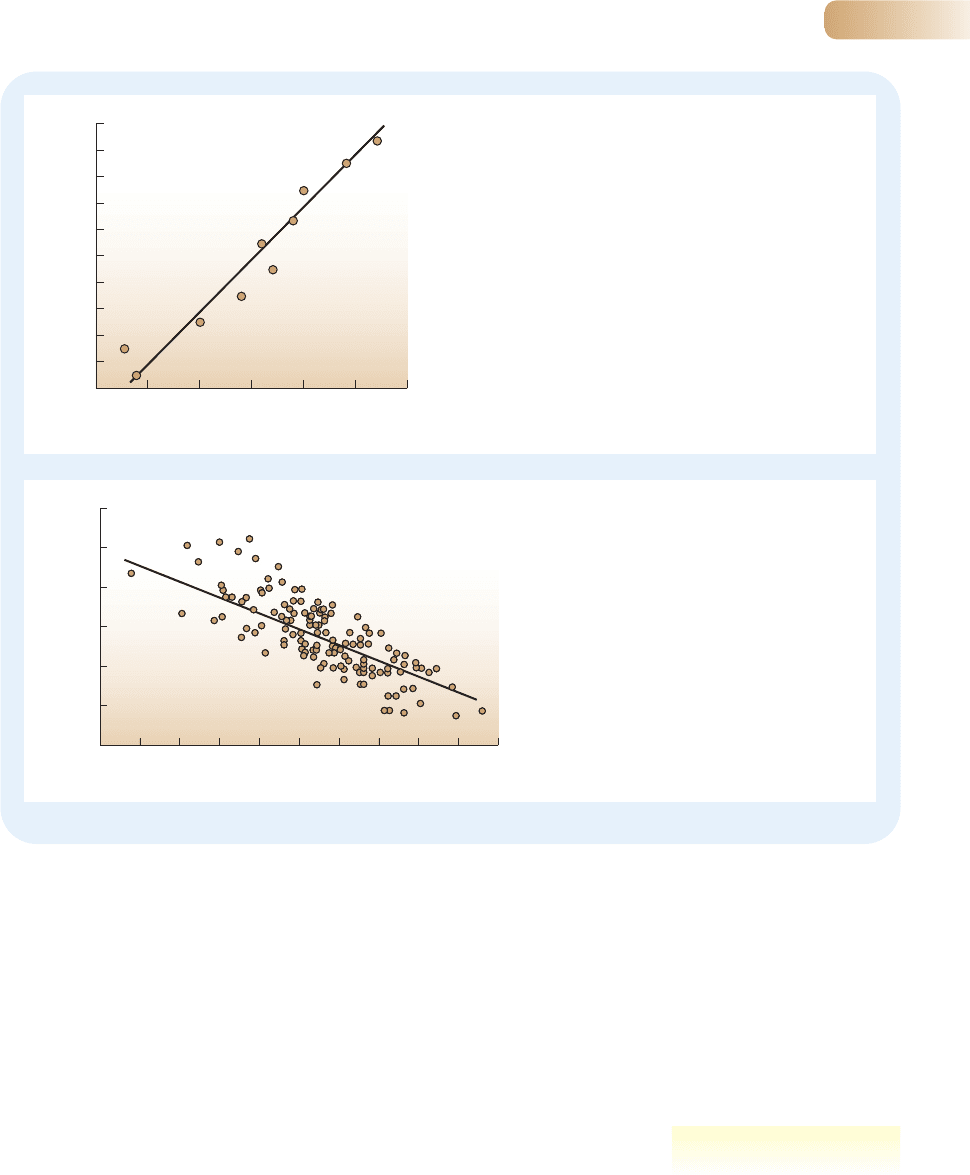
Figure 3.8
Changing temperature reverses the
outcome of competition. At low
temperature (6°C) on the left,
the salmonid fish Salvelinus
malma out-survives cohabiting
S. leucomaenis, whereas at 12°C,
right, S. leucomaenis drives
S. malma to extinction. Both
species are quite capable, alone,
of living at either temperature.
AFTER TANIGUCHI & NAKANO, 2000
3.1 HISTORICAL LANDMARKS
3.1 Historical landmarks
Recording the changing behavior of organisms
through the season (phenology) was essential before
agricultural activities could be intelligently timed. The
earliest phenological records were apparently the
Wu Hou observations made in the Chou and Ch’in
(1027–206
BC) dynasties. The date of the first flower-
ing of cherry trees has been recorded at Kyoto,
Japan, since
AD 812.
A particularly long and detailed record was started
in 1736 by Robert Marsham at his estate near the
city of Norwich, England. He called these records
‘Indications of the spring’. Recording was continued
by his descendants until 1947. Marsham recorded
27 phenological events every year: the first flowering
of snowdrop, wood anemone, hawthorn and turnip;
the first leaf emergence of 13 species of tree; and
various animal events such as the first appearance
of migrants (swallow, cuckoo, nightingale), the first
nest building by rooks, croaking of frogs and toads,
and the appearance of the brimstone butterfly.
Long series of measurements of environmental
temperature are not available for comparison with
the whole period of Marsham’s records, but they are
available from 1771 for Greenwich, about 160 km
away. There is surprisingly close agreement between
many of the flowering and leaf emergence events at
Marsham and the mean January–May temperature
at Greenwich (Figure 3.9). However, not surprisingly,
events such as the time of arrival of migrant birds
bears little relationship to temperature.
Analysis of the Marsham data for the emergence of
leaves on six species of tree indicates that the mean
date of leafing is advanced by 4 days for every 1°F
increase in the mean temperature from February to
May (Figure 3.10). Similarly, for the eastern United
States, Hopkins’ bioclimatic law states that the indi-
cators of spring such as leafing and flowering occur
4 days later for every 1° latitude northward, 5° longi-
tude westward or 400 feet (c. 120 m) of altitude.
Collecting phenological records has now been
transformed from the pursuit of gifted amateurs
to sophisticated programs of data collection and
analysis. At least 1500 phenological observation
posts are now maintained in Japan alone. The vast
accumulations of data have suddenly become excit-
ing and relevant as we try to estimate the changes
in floras and faunas that will be caused by global
warming.
Recording seasonal changes
9781405156585_4_003.qxd 11/5/07 17:15 Page 80
is for the morphological and physiological characteristics to keep changing with
the seasons (or even anticipating them, as in acclimatization). But change may be
costly: a deciduous tree may have leaves ideal for life in spring and summer but faces
the cost of making new ones every year. An alternative is to economize by having
long-lasting leaves like those of pines, heathers and the perennial shrubs of deserts.
Here, though, there is a cost to be paid in the form of more sluggish physiological
processes. Different species have evolved different compromise solutions.
3.2.6 Animal responses to environmental temperature
Most species of animals are, like plants, ectotherms: they rely on external sources
of heat to determine the pace of their metabolism. This includes the invertebrates
and also fish, amphibians and lizards. Others, mainly birds and mammals, are
endotherms: they can regulate their body temperature by producing heat within
their body.
Chapter 3 Physical conditions and the availability of resources
81
38
40
42
44
46
48
80 85 90 96
Mean days from Jan 1 when event occurred
100 106 110
Mean Jan–May temperature (°F)
Figure 3.9
The relationships between mean January–May temperatures and
the annual mean dates of 10 flowering and leafing events from the
classic Marsham records started in 1736.
FROM REDRAWN FIGURES OF MARGARY, IN FORD, 1982
40 42 44
Mean temperature for Feb–May (°F)
46 48
130
120
110
100
90
80
70
Days from Jan 1 when leaves emerged
Figure 3.10
The relationship between the mean temperature in
the 4-month period, February–May, and the average
date of six leafing events. The correlation coefficient
is –0.81.
FROM REDRAWN FIGURES OF KINGTON, IN FORD, 1982
ectotherms and endotherms
9781405156585_4_003.qxd 11/5/07 14:44 Page 81
The distinction between ectotherms and endotherms is not absolute. Some
typical ectotherms, some insects for example, can control body temperature through
muscle activities (e.g. shivering flight muscles). Some fish and reptiles can generate
heat for limited periods of time, and even some plants can use metabolic activity
to raise the temperature of their flowers. Some typical endotherms, on the other
hand, such as dormice, hedgehogs and bats, allow their body temperature to fall
and become scarcely different from that of their surroundings when they are
hibernating (Figure 3.11).
Despite these overlaps, endothermy is inherently a different strategy from
ectothermy. Over a certain narrow temperature range, an endotherm consumes
energy at a basal rate. But at environmental temperatures further and further
above or below that zone, endotherms expend more and more energy maintain-
ing their constant body temperature. This makes them relatively independent
of environmental conditions and allows them to stay longer at or close to peak
performance. It makes them more efficient in both searching for food and escap-
ing from predators. However, there is a cost – a high requirement for food to fuel
this strategy.
The idea that organisms are harmed (and limited in their distributions) by
environmental conditions not ‘directly’, but because of the energetic costs required
to tolerate those conditions, is illustrated by a study examining the effect of a
different condition: salinity. The freshwater shrimps Palaemonetes pugio and
P. vulgaris, for example, co-occur in estuaries on the eastern coast of the USA
at a wide range of salinities, but the former seems to be more tolerant of lower
salinities than the latter, occupying some habitats from which the latter is absent.
Figure 3.12 shows the mechanism likely to be underlying this. Over the low salinity
range (though not at the effectively lethal lowest salinity) metabolic expenditure
was significantly lower in P. pugio. P. vulgaris requires far more energy simply to
maintain itself, putting it at a severe disadvantage in competition with P. pugio.
Endotherms have morphological modifications that reduce their energetic costs.
In cold climates most have low surface area to volume ratios (short ears and limbs),
and this reduces heat loss through surfaces. Typically, endotherms that live in polar
environments are insulated from the cold with extremely dense fur (polar bears,
mink, foxes) or feathers and extra layers of fat. In contrast, desert endotherms
often have thin fur, and long ears and limbs, which help dissipate heat.
Part II Conditions and Resources
82
Temperature (°C)
30
0
Sep Oct Nov Dec Jan Feb Mar Apr
Month
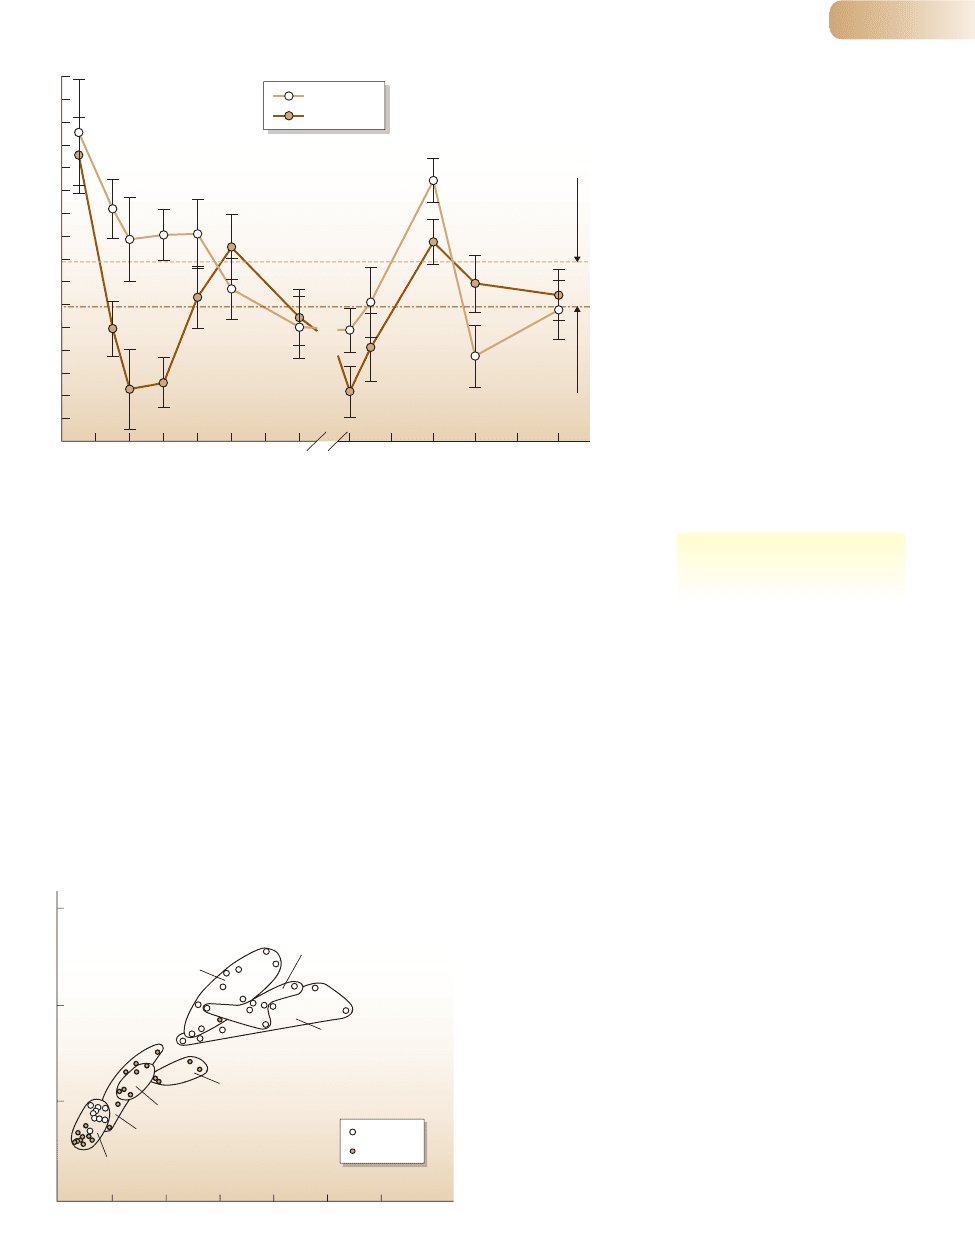
Figure 3.11
Changes in the body temperature over the 1996/97 winter of the European ground squirrel, Spermophilus
citellus (solid line) compared to ambient soil temperature (dotted line) at the same depth at which it was
hibernating. Note that during hibernation (early October to mid-March), body temperature was mostly
indistinguishable from ambient temperature, apart from repeated brief periods of activity accompanied
by ‘normal’ body temperatures.
AFTER HUT ET AL., 2002
9781405156585_4_003.qxd 11/5/07 14:44 Page 82
Chapter 3 Physical conditions and the availability of resources
83
AFTER ROWE, 2002
Standard metabolic expenditure (J day
–1
)
33
32
31
30
29
28
27
26
25
24
23
22
21
20
19
18
17
Salinity (ppt)
01234567 353025201510
Overall mean,
P. vulgaris (24.85)
Overall mean,
P. pugio (22.91)
P. pugio
P. vulgaris
Figure 3.12
Standard metabolic expenditure (estimated
through minimum oxygen consumption) in
two species of shrimp, Palaemonetes pugio
and P. vulgaris, at a range of salinities.
There was significant mortality of both
species over the experimental period at
0.5 ppt (parts per thousand), especially
P. vulgaris (75% compared to 25%).
Figure 3.13
Seasonal changes in the thickness of the insulating fur coats of
some Arctic and northern temperate mammals.
1.5
1.0
0.5
0
1.00 2.0 3.0 4.0 5.0 6.0
Thickness of fur (mm)
Winter
Polar bear
Red squirrel
Polar bear
Insulation (°C cal m
–2
h
–1
)
Wolverine
Summer
Wolverine
Wolf
Wolf
temperatures that vary seasonally
pose special problems
Variability of conditions can set biological challenges as great as extremes.
Seasonal cycles, for example, can expose an animal to summer heat close to its
thermal maximum, and winter chill close to its thermal minimum. Responses
to these changing conditions include the laying down of different coats in the
fall (thick and underlain by a thick fat layer) and in the spring (a thinner coat
and loss of the dense fat layer) (Figure 3.13). Some animals also take advantage
of each other’s body heat as a means to cope with cold weather by huddling
together. Hibernation – relaxing temperature control – allows some verte-
brates to survive periods of winter cold and food shortage (see Figure 3.11) by
avoiding the difficulties of finding sufficient fuel over these periods. Migration
is another avoidance strategy: the Arctic tern, to take an extreme example,
travels from the Arctic to the Antarctic and back each year, experiencing only
the polar summers.
9781405156585_4_003.qxd 11/5/07 14:44 Page 83

3.2.7 Microorganisms in extreme environments
Microorganisms survive and grow in all the environments that are lived in or
tolerated by animals and plants, and they show the same range of strategies –
avoid, tolerate or specialize. Many microorganisms produce resting spores that
survive drought, high temperature or cold. There are also some that are capable
of growth and multiplication in conditions far outside the range of tolerance of
higher organisms: they inhabit some of the most extreme environments on Earth.
Temperatures maintained higher than 45°C are lethal to almost all plants and
animals, but thermophilic (‘temperature loving’) microbes grow at much higher
temperatures. Although similar in many ways to heat-intolerant microbes, the
enzymes of these thermophiles are stabilized by especially strong ionic bonds.
Microbial communities that not only tolerate but grow at low temperatures are
also known; these include photosynthetic algae, diatoms and bacteria that have
been found on Antarctic sea ice. Microbial specialists have also been identified
from other rare or peculiar environments: for example acidophiles, which thrive
in environments that are highly acidic. One of them, Thiobacillus ferroxidans, is
found in the waste from industrial metal-leaching processes and tolerates pH 1.0.
At the other end of the pH spectrum, the cyanobacterium, Plectonema nostocorum,
from soda lakes can grow at pH 13. As noted previously, these oddities may be
relicts from environments that prevailed much earlier in Earth’s history. Certainly,
they warn us against being too narrow-minded when we consider the kind of
organism we might look for on other planets.
3.3 Plant resources
Resources may be either biotic or abiotic components of the environment: they are
whatever an organism uses or consumes in its growth and maintenance, leaving less
available for other organisms. When a photosynthesizing leaf intercepts radiation,
it deprives some of the leaves or plants beneath it. When a caterpillar eats a leaf,
there is less leaf material available for other caterpillars. By their nature, resources
are critical for survival, growth and reproduction and also inherently a potential
source of conflict and competition between organisms.
If an organism can move about, it has the potential to search for its food.
Organisms that are fixed and ‘rooted’ in position cannot search. They must rely
on growing toward their resources (like a shoot or root) or catching resources
that move to them. The most obvious examples are green plants, which depend
Part II Conditions and Resources
84
The thick, white winter coat and the
thinner, browner summer coat of
the Arctic fox.
resource requirements of
non-motile organisms
9781405156585_4_003.qxd 11/5/07 14:44 Page 84
on: (i) energy that radiates to them; (ii) atmospheric carbon dioxide that diffuses
to them; (iii) mineral cations that they obtain from soil colloids in exchange for
hydrogen ions; and (iv) water and dissolved anions that the roots absorb from the
soil. In the following sections, we concentrate on green plants. But it is important
to remember that many of the non-mobile animals, like corals, sponges and bivalve
mollusks, depend on resources that are suspended in the watery environment and
are captured by filtering the water or even just waiting for them open-mouthed.
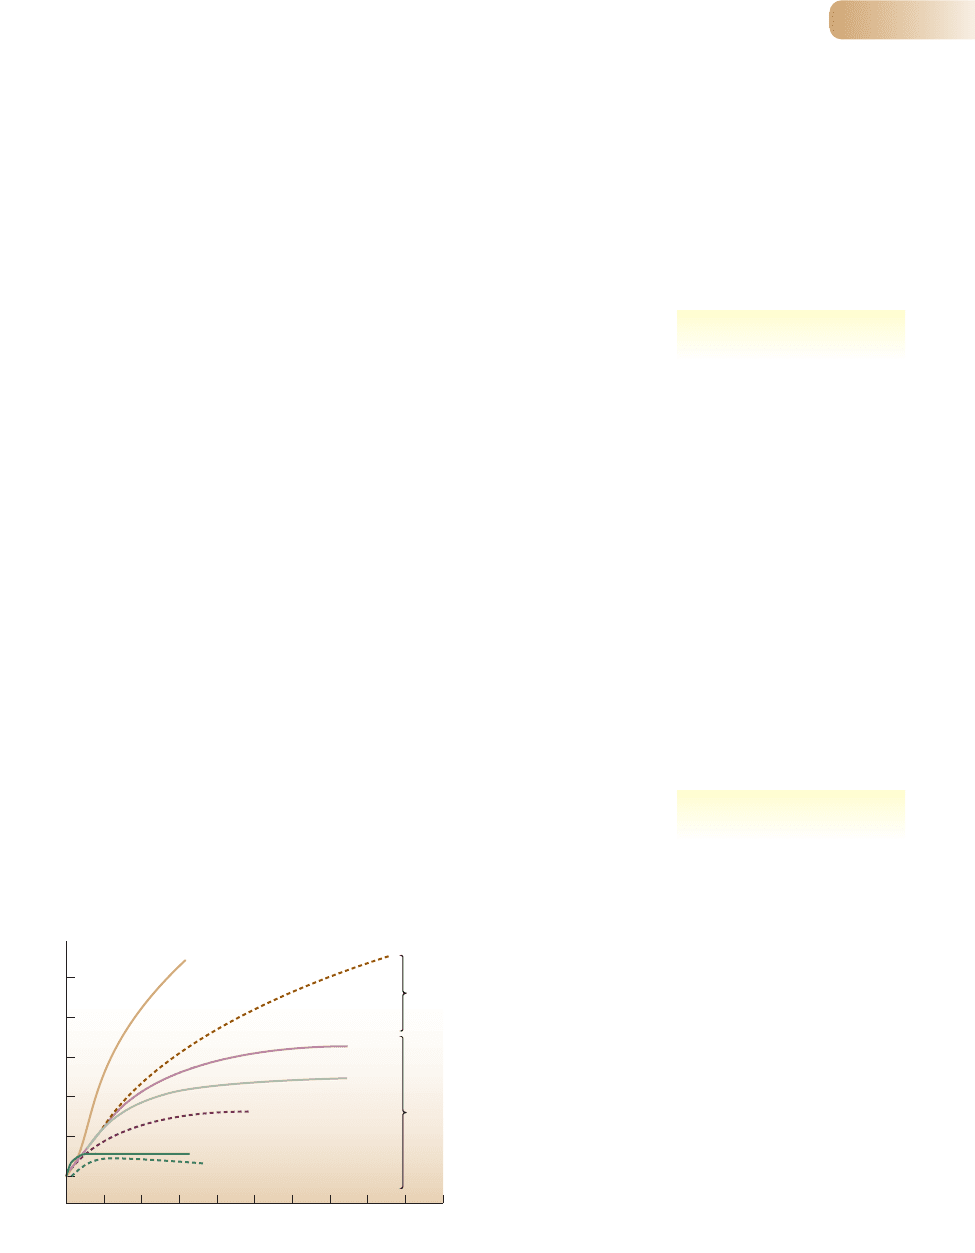
3.3.1 Solar radiation
Solar radiation is a critical resource for green plants. We often refer to it loosely
as ‘light’, but green plants actually use only about 44% of that narrow part of the
spectrum of solar radiation that is visible to us between infrared and ultraviolet.
The rate of photosynthesis increases with the intensity of the radiation that a leaf
receives, but with diminishing returns; and this relationship itself varies greatly
between species (Figure 3.14), especially between those that usually live in shaded
habitats (which reach saturation at low radiation intensities) and those that
normally experience full sunlight and can take advantage of it. Moreover, at high
intensities, photoinhibition of photosynthesis may occur, such that the rate of
fixation of carbon decreases with increasing radiation intensity. High intensities
of radiation may also lead to dangerous overheating of plants. Radiation is an
essential resource for plants, but they can have too much as well as too little.
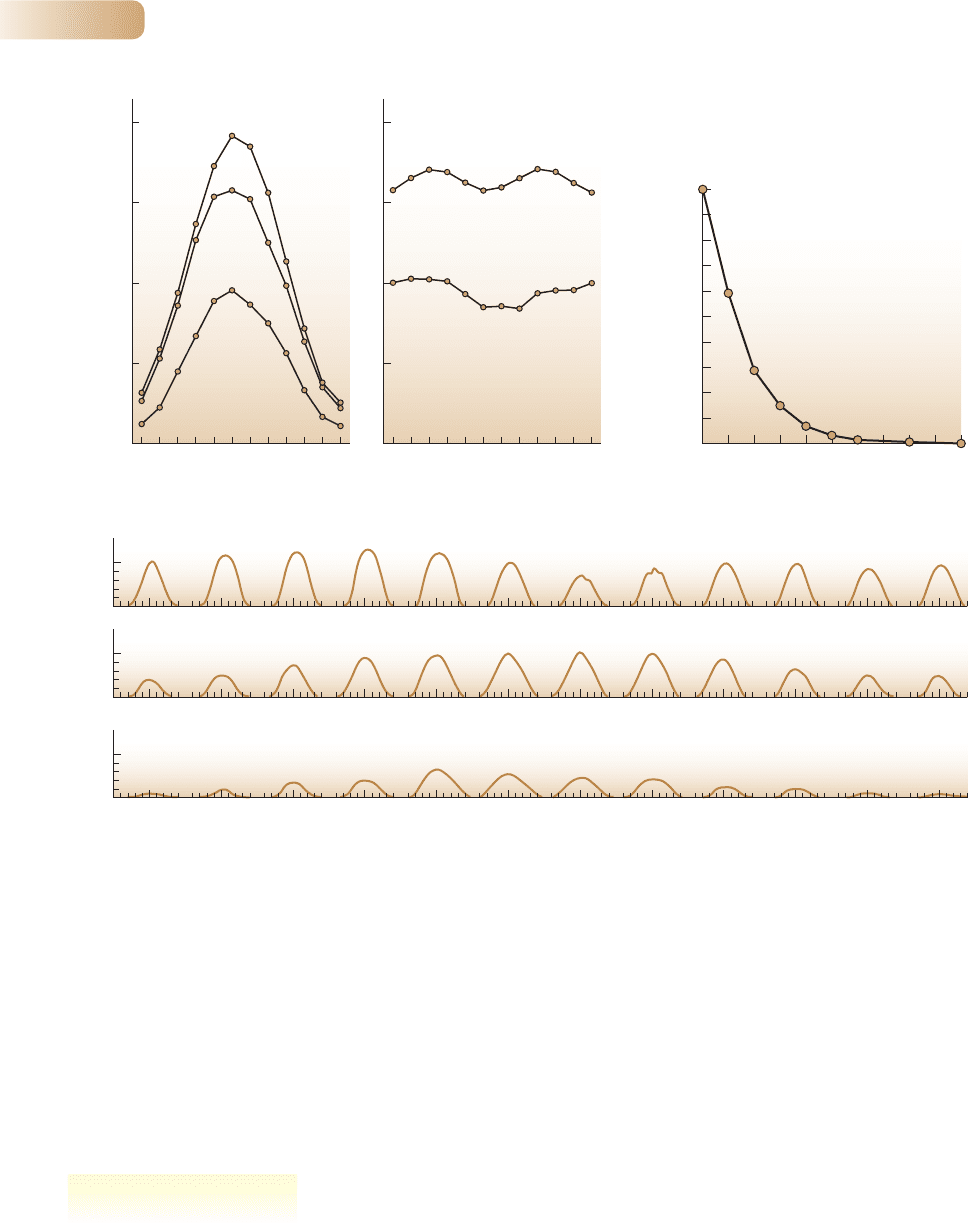
The solar radiation that reaches a plant is forever changing. Its angle and
intensity change in a regular and systematic way annually, diurnally and with depth
within the canopy or in a water body (Figure 3.15). There are also irregular,
unsystematic variations due to changes in cloud cover or shadowing by the leaves
of neighboring plants. As light flecks pass over leaves lower in the canopy, they
receive seconds or minutes of direct bright light and then plunge back into shade.
The daily photosynthesis of a leaf integrates these various experiences; the whole
plant integrates the diverse exposure of its various leaves.
There is enormous variation in the shapes and sizes of leaves. Most of the
heritable variation in shape has probably evolved under selection not primarily for
high photosynthesis, but rather for optimal efficiency of water use (photosynthesis
achieved per unit of water transpired) and minimization of the damage done by
foraging herbivores. Not all the variations in leaf shape are heritable, though:
Chapter 3 Physical conditions and the availability of resources
85
50
40
30
20
10
0
012345678910
Radiation intensity (100 J m
–2
s
–1
)
CO
2
uptake (mg CO
2
dm
–2
h
–1
)
Sorghum
Corn
Wheat
Sun
herbs
Beech
Shade herbs
Shade mosses,
planktonic algae
C4
C3
Figure 3.14
The response of photosynthesis by the leaves of various types of
green plant (measured as carbon dioxide uptake) to the intensity
of solar radiation at optimal temperatures and with a natural
supply of carbon dioxide. (The different physiologies of C3 and C4
plants are explained later in Section 3.3.2.)
AFTER LARCHER, 1980, AND OTHER SOURCES
sun and shade species
sun and shade leaves
9781405156585_4_003.qxd 11/5/07 14:44 Page 85
many are responses by the individual to its immediate environment. Many trees,
especially, produce different types of leaf in positions exposed to full sunlight
(‘sun leaves’) and in places lower in the canopy where they are shaded (‘shade
leaves’). Sun leaves are thicker, with more densely packed chloroplasts (which
process the incoming radiation) within cells and more cell layers. The more flimsy
shade leaves intercept diffused and filtered radiation low in the canopy but may
nonetheless supplement the main photosynthetic activity of the sun leaves high
in the canopy.
Among herbaceous plants and shrubs, specialist ‘sun’ or ‘shade’ species are
much more common. Leaves of sun plants are commonly exposed at acute angles
to the midday sun and are typically superimposed into a multilayered canopy,
Part II Conditions and Resources
86
(b)
0
5
0
5
201242012420124201242012420124201242012420124201242012420124
0
5
Jan Feb Mar Apr May Jun Jul Aug Sep Oct Nov Dec
D
0
J
500
1000
2000
1500
0
500
1000
2000
1500
NOSAJJMAMF
Kabanyolo
Perfectly
clear
DJNOSAJJMAMF
Clear
100
(c)
0
20
40
60
80
100123456789
Depth (m)
(a)
Solar radiation received (J cm
–2
day
–1
)
Wageningen
Perfectly
clear
Average
Average
Irradiance (% of subsurface value)
Monthly average of daily radiation (J cm
–2
min
–1
)
Coimbra (Portugal) 40°12′ N
Poona (India) 18°31′ N
Bergen (Norway) 60°22′ N
Time (h)
Month Month
(A, B) AFTER DE WIT, 1965, AND OTHER SOURCES; (C) AFTER KIRK, 1994
Figure 3.15
(a) The daily totals of solar radiation received throughout the year at Wageningen (the Netherlands) and Kabanyolo (Uganda). (b) The monthly
average of daily radiation recorded at Poona (India), Coimbra (Portugal) and Bergen (Norway). (c) Exponential diminution of radiation intensity with
water depth in a freshwater habitat (Burrinjuck Dam, Australia).
sun and shade plants
9781405156585_4_003.qxd 11/5/07 14:44 Page 86
where even the lower leaves may have a positive rate of net photosynthesis. The
leaves of shade plants are typically arranged in a single-layered canopy and angled
horizontally, maximizing their ability fully to capture the available radiation.
Other species develop as sun or shade plants, depending on where they grow.
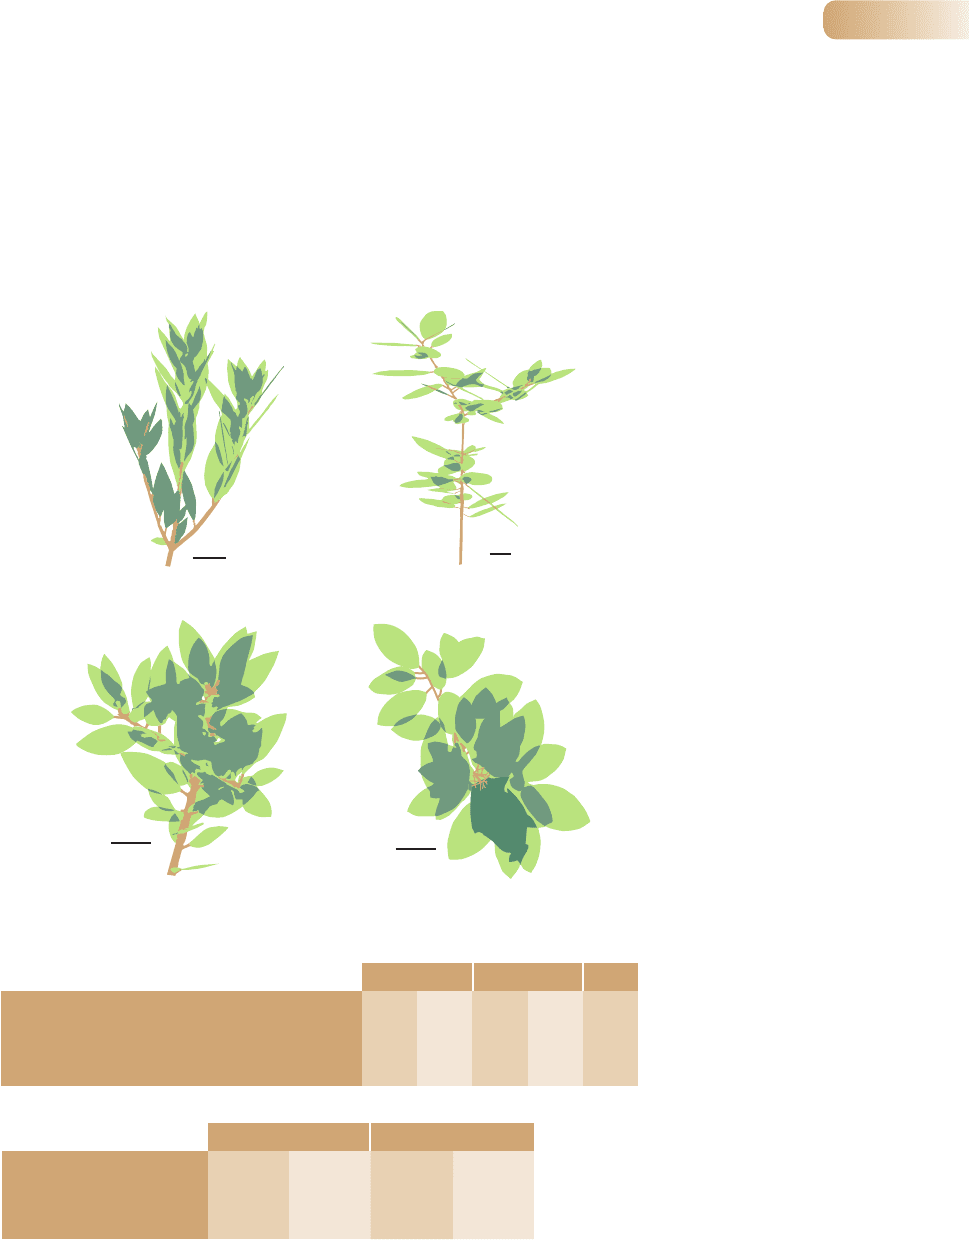
One such is the evergreen shrub, Heteromeles arbutifolia, which grows both in
chaparral habitats in California, where shoots in the upper crown are regularly
exposed to full sunlight and high temperatures, and also in shaded woodland
habitats, where it receives around one-seventh as much radiation. A detailed study
of this plant captures many of the points made above (Figure 3.16). As expected,
Chapter 3 Physical conditions and the availability of resources
87
AFTER VALLADARES & PEARCY, 1998
AC
BD
Sun plant
Early morning
Sun plant
Midday
Shade plant
Early morning
Shade plant
Midday
Leaf angle (degrees)
Leaf blade thickness (µm)
Photosynthetic capacity, area basis (µmol CO
2
m
–2
s
–1
)
Chlorophyll content, area basis (mg m
–2
)
Leaf nitrogen content, area basis (g m
–2
)
71.3
462.5
14.1
280.5
1.97
(16.3)
(10.9)
(2.0)
(15.3)
(0.25)
Sun
5.3
292.4
9.0
226.7
1.71
(4.3)
(9.5)
(1.7)
(14.0)
(0.21)
Shade
<0.01
<0.01
<0.01
<0.01
<0.05
P
(a)
(b)
Fraction self-shaded
Display efficiency
Absorption efficiency
Summer
0.22
a
0.33
a
0.28
a
Winter
0.42
b
0.38
a,b
0.44
b
Sun plants
Summer
0.47
b
0.41
b
0.55
c
Winter
0.11
a
0.43
b
0.53
c
Shade plants
(c)
Figure 3.16
(a) Computer reconstructions of stems of
typical sun (A, C) and shade (B, D) plants of
the evergreen shrub Heteromeles arbutifolia,
viewed along the path of the sun’s rays in the
early morning (A, B) and at midday (C, D).
Darker tones represent parts of leaves shaded
by other leaves of the same plant. Bars = 4 cm.
(b) Observed differences in the leaves of sun
and shade plants. Standard deviations are given
in parentheses; the significance of differences
are given following analysis of variance.
(c) Consequent whole-plant properties of sun
and shade plants. Letter codes indicate groups
that differed significantly in analyses of variance
(P < 0.05).
9781405156585_4_003.qxd 11/5/07 14:44 Page 87

the leaves of sun plants are thicker and have a greater photosynthetic capacity
(more chlorophyll and nitrogen) per unit leaf area than those of shade plants
(Figure 3.16b). As expected, too, sun-plant leaves are inclined at a much steeper
angle to the horizontal, and they therefore absorb the direct rays of the overhead
summer sun over a wider leaf area than the more horizontal shade-plant leaves.
The more angled leaves of sun plants, though, are also less likely than shade-plant
leaves to shade other leaves of the same plant from the overhead rays of the
summer sun (Figure 3.16c). But in winter, when the sun is much lower in the sky,
it is the shade plants that are much less subject to this ‘self-shading’. The overall
consequence of these differences is that ‘display efficiency’ – the proportion of
incident radiation intercepted per unit area of leaf – is higher in shade than in sun
plants, in summer because of the more horizontal leaves, but in the winter because
of the relative absence of self-shading.
The properties of whole plants of H. arbutifolia, then, reflect both plant archi-
tecture and the morphologies and physiologies of individual leaves. The efficiency
of light absorption per unit of biomass is massively greater for shade than for
sun plants (Figure 3.16c), reflecting leaf angles, self-shading and leaf thickness.
Overall, despite receiving only one-seventh of the radiation of sun plants, shade
plants reduce the differential in their daily rate of carbon gain from photosynthesis
to only a half. They successfully counterbalance their reduced photosynthetic
capacity at the leaf level with enhanced light-harvesting ability at the whole-plant
level. The sun plants, on the other hand, can be seen as striking a compromise
between maximizing whole-plant photosynthesis while avoiding photoinhibition
and overheating of individual leaves.
3.3.2 Water
Most plant parts are largely composed of water. In some soft leaves and fruits,
as much as 98% of the volume may be water. Yet this is a minute fraction of the
water that passes from the soil through a plant to the atmosphere during plant
growth. Photosynthesis depends on the plant absorbing carbon dioxide. This can
only happen across surfaces that are wet – most notably the walls of the photo-
synthesizing cells in leaves. If a leaf allows carbon dioxide to enter, it is almost
impossible to prevent water vapor from leaving. Likewise, any mechanism or pro-
cess that slows down the rate of water loss, such as closing the stomata (pores) on
the leaf surface, is almost bound to reduce the rate of carbon dioxide absorption
and hence reduce the rate of photosynthesis.
Green plants serve as wicks that conduct water from the soil and release it
to the atmosphere. If the rate of uptake falls below the rate of release, the body
of the plant starts to dry out. The cells lose their turgidity and the plant wilts.
This may just be temporary (though it may happen every day in summer), and
they may recover and rehydrate at night. But if the deficit accumulates, the
plant may die.
Species of green plants differ in the ways in which they survive in dry environ-
ments. One strategy is to avoid the problems. Avoiders such as desert annuals,
annual weeds and most crop plants have a short lifespan: their photosynthetic
activity is concentrated during periods when they can maintain a positive water
balance. For the remainder of the year, they remain dormant as seeds, a stage
that requires neither photosynthesis nor transpiration. Some perennial plants shed
Part II Conditions and Resources
88
water is lost from plants that
photosynthesize
wilting
plant life in water deficit:
avoiders and tolerators
9781405156585_4_003.qxd 11/5/07 14:44 Page 88