Tracy John A. Accounting for Dummies
Подождите немного. Документ загружается.


Chapter 7 explains that managers choose among alternative accounting meth-
ods for several important expenses (and for revenue as well). After making
these key choices, the managers should let the accountants do their jobs and
let the chips fall where they may. If bottom-line profit for the year turns out to
be a little short of the forecast or target for the period, so be it. This hands-off
approach to profit accounting is the ideal way. However, managers often use a
hands-on approach — they intercede (one could say interfere) and override
the normal accounting for sales revenue or expenses.
Both managers who do profit smoothing and investors who rely on financial
statements in which profit smoothing has been done must understand one
thing: These techniques have robbing-Peter-to-pay-Paul effects. Accountants
refer to these as compensatory effects. The effects next year offset and cancel
out the effects this year. Less expense this year is counterbalanced by more
expense next year. Sales revenue recorded this year means less sales revenue
recorded next year. Of course, the compensatory effects work the other way
as well: If a business depresses its current year’s recorded profit, its profit
next year benefits. In short, a certain amount of profit can be brought for-
ward into the current year or delayed until the following year.
Two profit histories
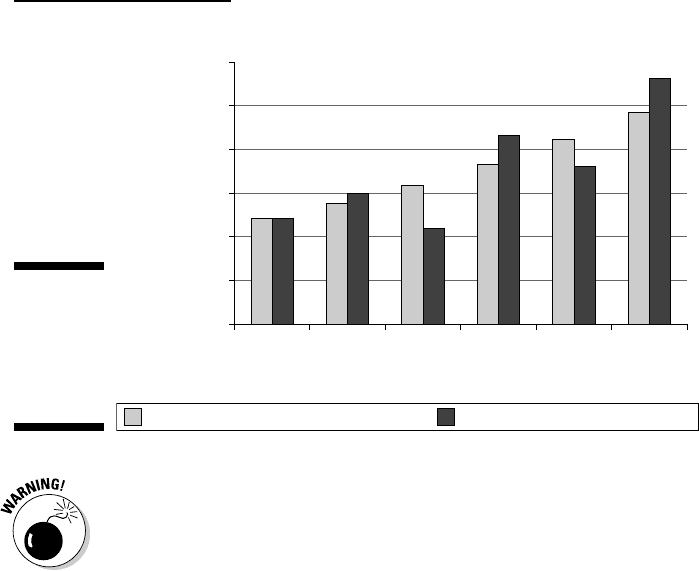
Figure 12-2 shows, side by side, the annual profit histories of two different
businesses over six years. Steady Flow, Inc. shows a nice smooth upward
trend of profit. Bumpy Ride, Inc., in contrast, shows a zigzag ride over the six
years. Both businesses earned the same total profit for the six years — in this
case, $1,050,449. Their total six-year profit performance is the same, down to
the last dollar. Which company would you be more willing to risk your money
in? I suspect that you’d prefer Steady Flow, Inc. because of the nice and
steady upward slope of its profit history.
I have a secret to share with you: Figure 12-2 is not really for two different
companies — actually, the two different profit figures for each year are for
the same company. The year-by-year profits shown for Steady Flow, Inc. are
the company’s smoothed profit amounts for each year, and the annual profits
for Bumpy Ride, Inc. are the actual profits of the same business — the annual
profits that were recorded before smoothing techniques were applied.
For the first year in the series, 2004, no profit smoothing occurred. The two
profit numbers are the same; there was no need for smoothing. For each of
the next five years, the two profit numbers differ. The difference between actual
profit and smoothed profit for the year is the amount that revenue and/or
expenses had to be manipulated for the year. For example, in 2005 actual profit
would have been a little too high, so the company accelerated the recording of
some expenses that should not have been recorded until the following year
(2006); it booked those expenses in 2005. In contrast, in 2008, actual profit was
running below the target net income for the year, so the business put off record-
ing some expenses until 2009 to make 2008’s profit look better. Does all this
make you a little uncomfortable? It should.
260
Part IV: Preparing and Using Financial Reports
19_246009 ch12.qxp 4/17/08 12:04 AM Page 260
A business can go only so far in smoothing profit. If a business has a particularly
bad year, all the profit-smoothing tricks in the world won’t close the gap. And if
managers are used to profit smoothing, they may be tempted in this situation to
resort to accounting fraud, or cooking the books.
Management discretion in the timing of revenue and expenses
Several smoothing techniques are available for filling the potholes and
straightening the curves on the profit highway. Most profit-smoothing tech-
niques require one essential ingredient: management discretion in deciding
when to record expenses or when to record sales.
When I was in public accounting, one of our clients was a contractor that
used the completed contract method for recording its sales revenue. Not until
the job was totally complete did the company book the sales revenue and
deduct all costs to determine the gross margin from the job (in other words,
from the contract). In most cases, the company had to return a few weeks
after a job was finished for final touch-up work or to satisfy customer com-
plaints. In the past, the company waited for this final visit before calling a job
complete. But the year I was on the audit, the company was falling short of
its profit goals. So the president decided to move up the point at which a job
was called complete. The company decided not to wait for the final visit,
which rarely involved more than a few minor expenses. Thus more jobs were
completed during the year, more sales revenue and higher gross margin were
recorded in the year, and the company met its profit goals.
$300,000
$0
2004
$250,000
$200,000
$150,000
$100,000
$50,000
2005 2006 2007
Year
Annual Profit
2008 2009
Steady Flow, Inc. (Smoothed Profit) Bumpy Ride, Inc. (Actual Profit)
Figure 12-2:
Comparison
of smoothed
and actual
profit
histories.
261
Chapter 12: Getting a Financial Report Ready for Release
19_246009 ch12.qxp 4/17/08 12:04 AM Page 261

A common technique for profit smoothing is to delay normal maintenance and
repairs, which is referred to as deferred maintenance. Many routine and recur-
ring maintenance costs required for autos, trucks, machines, equipment, and
buildings can be put off, or deferred, until later. These costs are not recorded
to expense until the actual maintenance is done, so putting off the work means
recording the expense is delayed.
Here are a few other techniques used:
A business that spends a fair amount of money for employee training
and development may delay these programs until next year so the
expense this year is lower.
A company can cut back on its current year’s outlays for market
research and product development.
A business can ease up on its rules regarding when slow-paying cus-
tomers are written off to expense as bad debts (uncollectible accounts
receivable). The business can, therefore, put off recording some of its
bad debts expense until next year.
A fixed asset out of active use may have very little or no future value to a
business. But instead of writing off the undepreciated cost of the impaired
asset as a loss this year, the business may delay the write-off until next
year.
Keep in mind that most of these costs will be incurred next year, so the effect is
to rob Peter (make next year absorb the cost) to pay Paul (let this year escape
the cost).
262
Part IV: Preparing and Using Financial Reports
Financial reporting on the Internet
Most public companies put their financial reports
on their Web sites. For example, you can go to
www.cat.com and navigate to Caterpillar’s
investors section, where you can locate its SEC
filings and its annual report to stockholders. Each
company’s Web site is a little different, but usu-
ally you can figure out fairly easily how to down-
load its annual and quarterly financial reports.
Alternatively, you can go to the EDGAR
(Electronic Data Gathering, Analysis, and
Retrieval) database, maintained by the
Securities and Exchange Commission (SEC).
Finding particular filings with the SEC is rela-
tively easy, but each company makes many fil-
ings with the SEC so you have to know which
one you want to see. (The annual financial
report is form 10-K.) Go to the EDGAR company
search site at http://www.sec.gov/
edgar/searchedgar/companysearch.
html.
19_246009 ch12.qxp 4/17/08 12:04 AM Page 262

Clearly, managers have a fair amount of discretion over the timing of some
expenses, so certain expenses can be accelerated into this year or deferred
to next year in order to make for a smoother year-to-year profit trend. But a
business does not divulge in its external financial report the extent to which
it has engaged in profit smoothing. Nor does the independent auditor com-
ment on the use of profit-smoothing techniques by the business — unless the
auditor thinks that the company has gone too far in massaging the numbers
and that its financial statements are downright misleading.
Going Public or Keeping Things Private
Suppose you had the inclination (and the time!) to compare 100 annual finan-
cial reports of publicly owned corporations with 100 annual reports of privately
owned businesses. You’d see many differences. Public companies are generally
much larger (in terms of annual sales and total assets) than private companies,
as you would expect. Furthermore, public companies generally are more
complex — concerning employee compensation, financing instruments,
multinational operations, federal laws that impact big business, legal
exposure, and so on.
Private and public businesses are bound by the same accounting rules for mea-
suring profit and for valuing assets, liabilities, and owners’ equity, and for dis-
closures in their financial reports. (To be more precise, private companies are
exempt from a couple of accounting rules.) But most of the accounting and
financial reporting standards that have been issued over the last two or three
decades are directed mainly to public companies; by and large private com-
panies do not have these accounting issues. As I mention in Chapter 2, the
accounting profession has taken initiatives with the goal of better recognizing
the different needs of private companies and the constituents of financial
reporting by private companies. Well, this is the party line. In my view, the
main purpose is to lighten the accounting and financial reporting burden on
private companies, which generally don’t have the time or the accounting
expertise to comply with the large number of complex standards on the books.
Reports from publicly owned companies
Around 10,000 corporations are publicly owned, and their stock shares are
traded on the New York Stock Exchange, NASDAQ, or other stock markets.
Publicly owned companies must file annual financial reports with the SEC —
the federal agency that makes and enforces the rules for trading in securities
(stocks and bonds). These filings are available to the public on the SEC’s
EDGAR database (see the sidebar “Financial reporting on the Internet”).
263
Chapter 12: Getting a Financial Report Ready for Release
19_246009 ch12.qxp 4/17/08 12:04 AM Page 263

The annual financial reports of publicly owned corporations include all or
most of the disclosure items I list earlier in the chapter (see the section “Making
Sure Disclosure Is Adequate”). As a result, annual reports published by large
publicly owned corporations run 30, 40, or 50 pages (or more). The large major-
ity of public companies put their annual reports on their Web sites. Many public
companies also present condensed versions of their financial reports — see the
section “Recognizing condensed versions” later in this chapter.
Annual reports from public companies generally are very well done — the
quality of the editorial work and graphics is excellent; the color scheme,
layout, and design have very good eye appeal. But be warned that the volume
of detail in their financial reports is overwhelming. (See the next section for
advice on dealing with the information overload in annual financial reports.)
While private companies are cut some slack when it comes to reporting certain
financial information — such as earnings per share — the requirements for pub-
licly owned businesses are more stringent. Publicly owned businesses live in a
fish bowl. When a company goes public with an IPO (initial public offering of
stock shares), it gives up a lot of the privacy that a closely held business enjoys.
A public company is required to have its annual financial report audited by an
outside, independent CPA firm. In doing an audit, the CPA passes judgment on
the company’s accounting methods and adequacy of disclosure.
Reports from private businesses
Compared with their public brothers and sisters, private businesses gener-
ally provide few additional disclosures in their annual financial reports. Their
primary financial statements with the accompanying footnotes are pretty
much it. Often, their financial reports may be printed on plain paper and sta-
pled together. A privately held company may have very few stockholders,
and typically one or more of the stockholders are active managers of the
business, who already know a great deal about the business. I suppose that a
private company could e-mail its annual financial report to its lenders and
shareowners, although I haven’t seen this yet.
Private corporations could provide all the disclosures I mention in this chapter —
there’s certainly no law against doing so. But they generally don’t. Investors
in private businesses can request confidential reports from managers at the
annual stockholders’ meetings (which is not practical for a stockholder in a
large public corporation). And major lenders to a private business can demand
that certain items of information be disclosed to them as a condition of the
loan.
264
Part IV: Preparing and Using Financial Reports
19_246009 ch12.qxp 4/17/08 12:04 AM Page 264

A private business may have its financial statements audited by a CPA firm
but generally is not required by law to do so. Frankly, CPA auditors cut private
businesses a lot of slack regarding disclosure. I don’t entirely disagree with
enforcing a lower standard of disclosure for private companies. The stock
share market prices of public corporations are extremely important, and full
disclosure of information should be made publicly available so that market
prices are fairly determined. On the other hand, the ownership shares of pri-
vately owned businesses are not traded, so there’s no urgent need for a com-
plete package of information.
Dealing with Information Overload
As a general rule, the larger a business, the longer its annual financial report.
I’ve seen annual financial reports of small, privately owned businesses that
you could read in 30 minutes to an hour. In contrast, the annual reports of
large, publicly owned business corporations are typically 30, 40, or 50 pages
(or more). You would need two hours to do a quick read of the entire annual
financial report, without trying to digest its details.
If you did try to digest the details of an annual financial report, which is a long,
dense document not unlike a lengthy legal contract, you would need many
hours (perhaps the whole day) to do so. (Also, to get the complete picture, you
should read the company’s filings with the SEC in conjunction with its annual
financial report. Tack on a few more hours for that!) For one thing, there are
many, many numbers in an annual financial report. I’ve never taken the time to
count the number of numbers in an average annual financial report, but I can
guarantee there are at least hundreds, and reports for large, diversified, global,
conglomerate businesses must have over a thousand.
Browsing based on your interests
How do investors in a business deal with the information overload of annual
financial reports? Very, very few persons take the time to plow through every
sentence, every word, every detail, and every number on every page — except
for those professional accountants, lawyers, and auditors directly involved in
the preparation and review of the financial report. It’s hard to say how most
managers, investors, creditors, and others interested in annual financial reports
go about dealing with the massive amount of information — very little research
has been done on this subject. But I have some observations to share with you.
265
Chapter 12: Getting a Financial Report Ready for Release
19_246009 ch12.qxp 4/17/08 12:04 AM Page 265

An annual financial report is like the Sunday edition of a large city newspaper,
such as The New York Times or the Chicago Tribune. Hardly anyone reads every
sentence on every page of these Sunday papers, much less every word in the
advertisements — most people pick and choose what they want to read. They
browse their way through the paper, stopping to read only the particular arti-
cles or topics they’re interested in. Some people just skim through the paper.
Some glance at the headlines. I think most investors read annual financial
reports like they read Sunday newspapers. The complete information is there if
you really want to read it, but most readers pick and choose which information
they have time to read.
Annual financial reports are designed for archival purposes, not for a quick read.
Instead of addressing the needs of investors and others who want to know
about the profit performance and financial condition of the business — but have
only a very limited amount of time available — accountants produce an annual
financial report that is a voluminous financial history of the business.
Accountants leave it to the users of annual reports to extract the main points.
So financial statement readers use relatively few ratios and other tests to get a
feel for the financial performance and position of the business. (Chapters 13 and
17 explain how readers of financial reports get a fix on the financial performance
and position of a business.)
Recognizing condensed versions
Here’s a well-kept secret: Many public businesses and nonprofit organizations
don’t send a complete annual financial report to their stockholders or members.
They know that few persons have the time or the technical background to read
thoroughly the full-scale financial statements, footnotes, and other disclosures
in their comprehensive financial reports. So, they present relatively brief sum-
maries that are boiled-down versions of their complete financial reports. For
example, my retirement fund manager, TIAA-CREF, puts out only financial sum-
maries to its participants and retirees. Also, AARP issues condensed financial
reports to its members.
Typically, these summaries — called condensed financial statements — do not
provide footnotes or the other disclosures that are included in the complete
and comprehensive annual financial reports. If you really want to see the offi-
cial financial report of the organization, you can ask its headquarters to send
you a copy (or, for public corporations, you can go to the EDGAR database of
the SEC — see the sidebar “Financial reporting on the Internet”).
266
Part IV: Preparing and Using Financial Reports
19_246009 ch12.qxp 4/17/08 12:04 AM Page 266

Using other sources of
business information
Keep in mind that annual financial reports are only one of several sources of infor-
mation to owners, creditors, and others who have a financial interest in the busi-
ness. Annual financial reports, of course, come out only once a year — usually
two months or so after the end of the company’s fiscal (accounting) year. You
have to keep abreast of developments during the year by reading financial news-
papers or through other means. Also, annual financial reports present the sani-
tized version of events; they don’t divulge scandals or other negative news about
the business.
Not everything you may like to know as an investor is included in the annual
financial report. For example, information about salaries and incentive com-
pensation arrangements with the top-level managers of the business are dis-
closed in the proxy statement, not in the annual financial report. A proxy
statement is the means by which the corporation solicits the vote of stock-
holders on issues that require stockholder approval — one of which is com-
pensation packages of top-level managers. Proxy statements are filed with the
SEC and are available on its EDGAR database.
Statement of Changes in Owners’ Equity
In many situations, a business prepares a “mini” financial statement in addition
to its three primary financial statements (income statement, balance sheet, and
statement of cash flows). This additional schedule is called the statement of
changes in owners’ equity. You find this schedule in almost all public companies,
because most have relatively complex ownership structures and changes in
their equity accounts during the year. Many smaller private companies, on the
other hand, do not need to present this schedule.
Owners’ equity consists of two fundamentally different sources: capital invested
in the business by the owners, and profit earned by and retained in the busi-
ness. The specific accounts maintained by the business for its total owners’
equity depend on the legal organization of the business entity. One of the main
types of legal organization of a business is the corporation, and its owners are
stockholders. A corporation issues ownership shares called capital stock. The
title statement of changes in stockholders’ equity is used for corporations.
(Chapter 8 explains the corporation and other legal types of business entities.)
267
Chapter 12: Getting a Financial Report Ready for Release
19_246009 ch12.qxp 4/17/08 12:04 AM Page 267

Let’s consider a situation in which a business does not need to report this
statement, to make clearer why the statement is needed. Suppose a business
corporation has only one class of capital stock (ownership shares); it did not
issue any additional capital stock shares during the year; and it did not record
any gains or losses directly in its owners’ equity during the year (due to other
comprehensive income, which I explain in a moment). This business does not
need a statement of changes in stockholders’ equity. In reading the financial
report of this business you would see in its statement of cash flows (see Figure
6-1 or 6-2, for example) and its footnotes whether the business raised addi-
tional capital from its owners during the year, and how much cash dividends
(distributions from profit) were paid to the owners during the year. In other
words, the statement of cash flows and footnotes report all the activity in the
owners’ equity accounts during the year. Even so, a business may go ahead and
prepare the schedule in order to bring together everything affecting its owner’s
equity accounts in one place.
In contrast, many larger businesses — especially publicly traded corporations —
generally have complex ownership structures consisting of two or more classes
of capital stock shares; they usually buy some of their own capital stock shares;
and they have one or more technical types of gains or losses during the year. So
they prepare a statement of changes in stockholders’ equity to collect together
in one place all the changes affecting the owners’ equity accounts during the year.
This particular statement (that focuses narrowly on changes in owners’ equity
accounts) is where you find certain gains and losses that increase or decrease
owners’ equity but that are not reported in the income statement. This is a rather
sneaky way of bypassing the income statement.
Basically, a business has the option to skirt around the income statement
and, instead, report certain gains and losses in the statement of changes in
owners’ equity. In this way, the gains or losses do not affect the bottom-line
profit of the business reported in its income statement. You have to read this
financial summary of the changes in the owners’ equity accounts to find out
whether the business had any of these technical gains or losses, and the
amounts of the gains or losses.
The special types of gains and losses reported in the statement of stockholders’
equity (instead of the income statement) have to do with foreign currency trans-
lations, unrealized gains and losses from certain types of securities investments
by the business, and changes in liabilities for unfunded pension fund obligations
of the business. The term comprehensive income is used to describe the normal
content of the income statement plus the additional layer of these special types
of gains and losses. Being so technical in nature, these gains and losses fall into
a twilight zone, as it were, in financial reporting. The gains and losses can be
tacked on at the bottom of the income statement, or they can be put in the
statement of changes in owners’ equity — it’s up to the business to make the
choice. You see it done both ways in financial reports.
268
Part IV: Preparing and Using Financial Reports
19_246009 ch12.qxp 4/17/08 12:04 AM Page 268

The general format of the statement of changes in stockholders’ equity
includes
A column for each class of stock (common stock, preferred stock, and so on)
A column for any treasury stock (shares of its own capital stock that the
business has purchased and not cancelled)
A column for retained earnings
One or more columns for any other separate components of the business’s
owners’ equity
Each column starts with the beginning balance and then shows the increases
or decreases in the account during the year. For example, a comprehensive
gain is shown as an increase in retained earnings, and a comprehensive loss
as a decrease.
I have to admit that reading a statement of changes in stockholders’ equity
in a public company’s annual financial report can be heavy lifting. The
professionals — stock analysts, money and investment managers, and so
on — carefully read through and dissect this statement, or at least they should.
The average, nonprofessional investor should focus on whether the business
had a major increase or decrease in the number of stock shares during the year,
whether the business changed its ownership structure by creating or eliminating a
class of stock, and what impact stock options awarded to managers of the busi-
ness may have had.
269
Chapter 12: Getting a Financial Report Ready for Release
19_246009 ch12.qxp 4/17/08 12:04 AM Page 269