U.S. Army Corps of Engineers. Engineering and Design Slope Stability
Подождите немного. Документ загружается.

EM 1110-2-1902
31 Oct 03
F-21
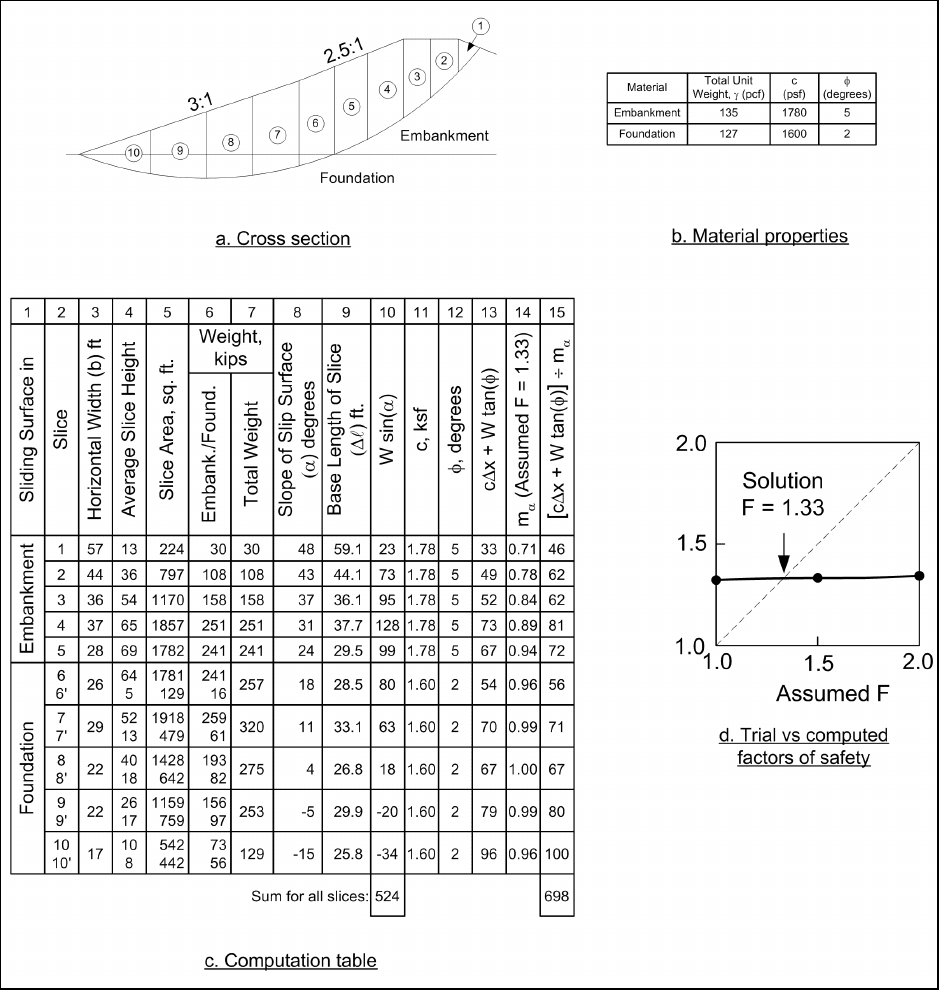
Figure F-11. End-of-construction example – Simplified Bishop Method
e. Modified Swedish Method – numerical solution. Calculations using numerical calculations for the
Modified Swedish Method for the same slope are summarized in Figure F-12. For this example the interslice
force inclination was assumed to be equal to the average embankment slope. The average embankment slope
is 2.8 (horizontal) to 1 (vertical). The side force inclination used in the calculations was θ = arctan(1/2.8)
= 19.7 degrees.

EM 1110-2-1902
31 Oct 03
F-22
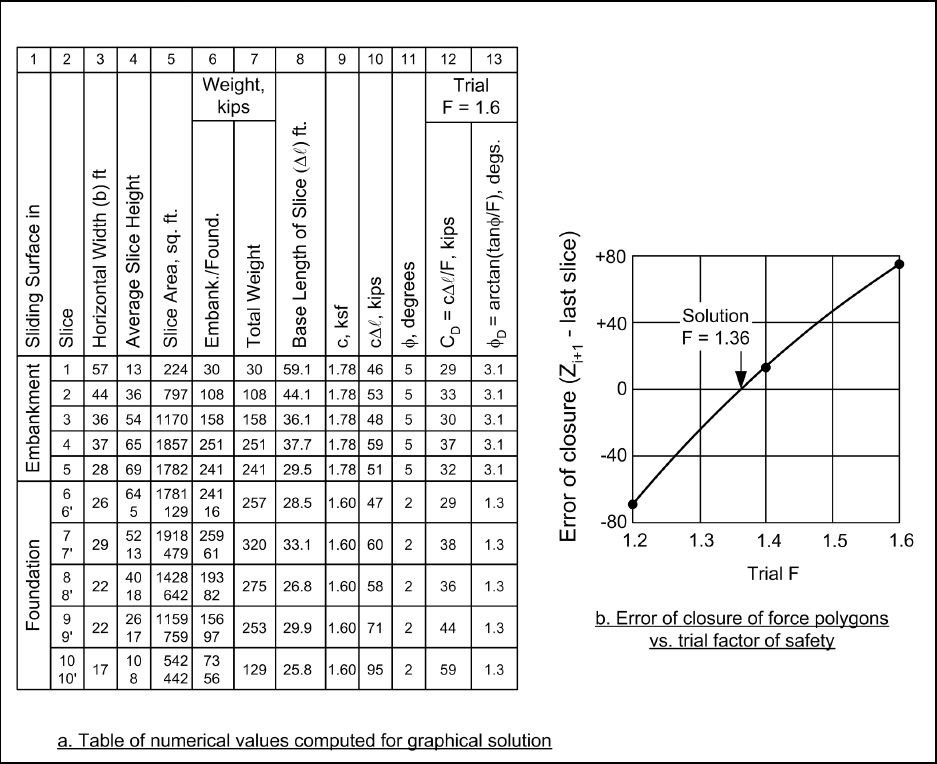
Figure F-12. Example calculations for end-of-construction stability condition – Modified Swedish Method –
numerical solution
(1) Many of the quantities shown in the table in Figure F-12a are the same as those for the Simplified
Bishop Method in Figure F-11c. Only the interslice forces Z
i
and Z
i+1
, in Columns 12 and 13 in Figure F-12a,
are different from the Simplified Bishop Method. The interslice forces were calculated by first assuming a
trial value for the factor of safety, and setting Z
1
for the first slice to zero. The value of Z
2
was then calculated
from Equation F-7. Values of the interslice forces were calculated successively for the remaining slices using
EM 1110-2-1902
31 Oct 03
F-23
Equation F-7. Calculations are shown in the table in Figure F-12a for an assumed value of factor of safety
equal to 1.6. The value of Z
i+1
on the last slice is 75 kips, which represents the force imbalance, or error of
closure, for this assumed factor of safety.
(2) Calculations were performed for three assumed values of factor of safety: F = 1.20, 1.40, and 1.60.
The force imbalances for these three factors of safety are plotted versus factor of safety in Figure F-12b. It
can be seen from this figure that the correct value satisfying force equilibrium with essentially zero imbalance
is approximately 1.36.
f. Modified Swedish Method – graphical solution. Calculations for the end-of-construction example
using the graphical solution for the Modified Swedish Method are illustrated in Figures F-13 and F-14. The
necessary numerical computations are shown in Figure F-13a. Most of the calculations and values shown in
this table are the same as those shown previously for the numerical solution in Figure F-12. In addition,
values for the force because of the developed cohesion, C
D
, and the developed friction angle, φ
D
, are shown in
Columns 12 and 13 of Figure F-13a. These values are shown for only one of the assumed values for the
factor of safety (F = 1.6). Three trial values (1.2, 1.4 and 1.6) were assumed for the factor of safety, and
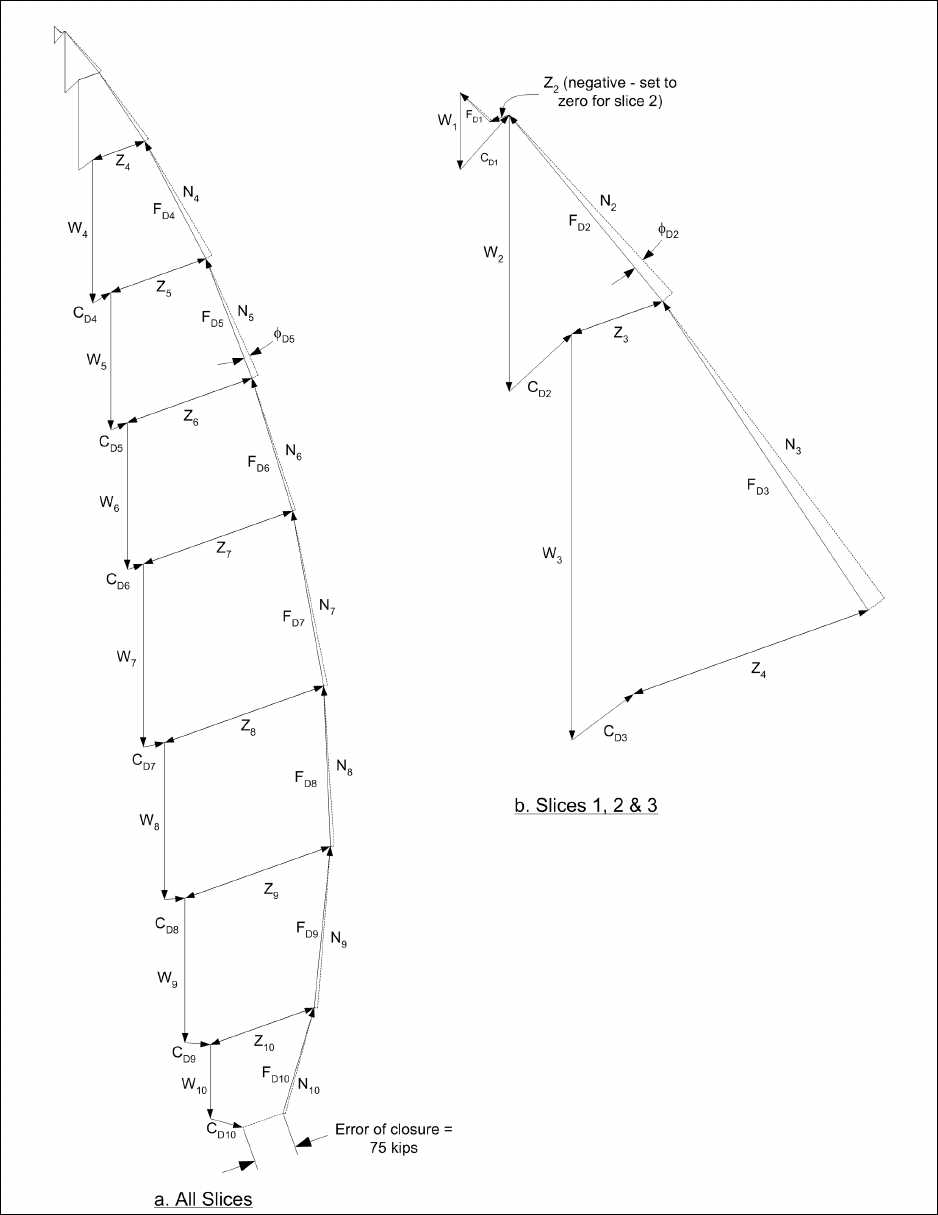
similar computations were made for each assumed value. The error of closure (Z
i+1
for the last slice) is
plotted versus the assumed value of factor of safety in Figure F-13b. The equilibrium force polygons are
shown in Figure F-14 for a trial value for the factor of safety of 1.6. For this assumed value the error of
closure is 75 kips. Note that the force polygons for the first three slices are shown twice in Figure F-14 to the
same force scale as for the other slices, and to an expanded scale for clearer illustration.
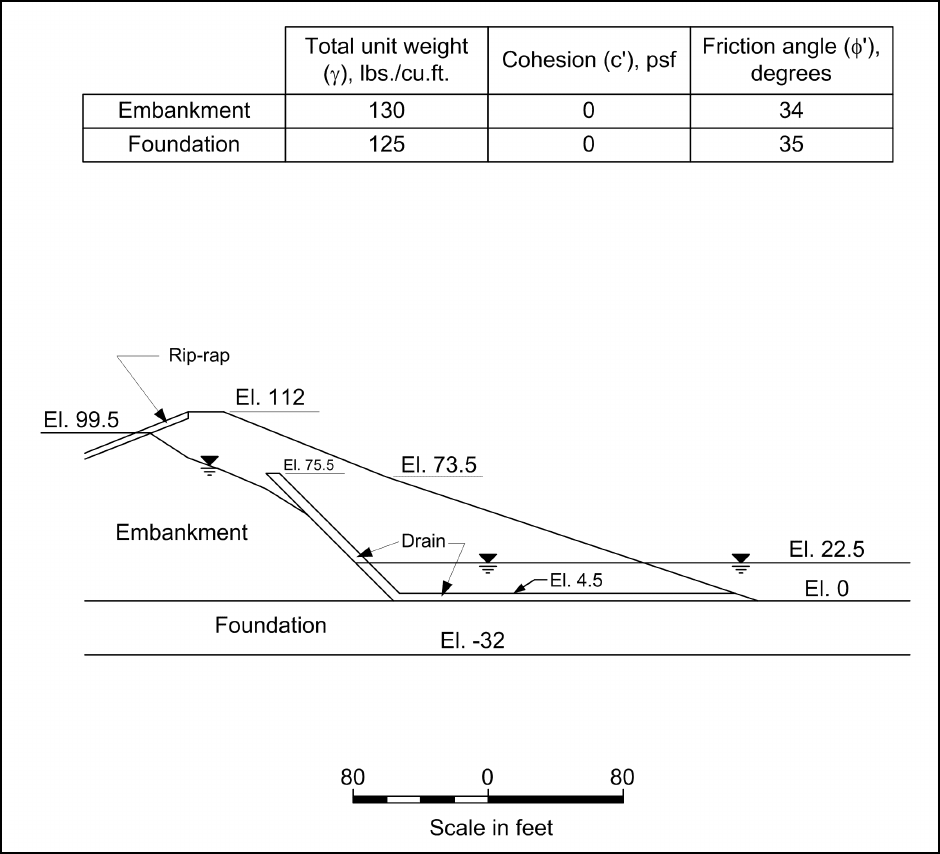
F-6. Steady Seepage (Long-Term Stability) Example
Figure F-15 shows an embankment with steady seepage. The cross section contains two principal zones -- the
embankment fill and the foundation. There are also three smaller zones of material in the embankment: an
upstream layer of rip-rap, an internal chimney drain and a horizontal drainage blanket. For these example
stability calculations, all of these smaller zones were treated as being the same as the embankment. The trial
slip surface used for the computations does not intersect any of the smaller zones, and their strength properties
therefore do not influence the results of the analyses.
a. Shear strengths. For steady-state seepage conditions, drained shear strengths characterized by c′ and
φ′ are appropriate for all soils. The effective stress shear strength parameters are determined using
consolidated-drained (CD or S) test procedures for testing coarse-grained soils, and consolidated-undrained
(CU or R) test procedures with pore water measurements for fine-grained soils. The shear strength
parameters used in this example are shown in the table at the top of Figure F-15. Samples of the embankment
materials would be prepared by compacting samples at appropriate densities and moisture contents. For the
natural foundation soils, test specimens would be obtained by undisturbed sampling.
b. Water pressures. The pore water pressures for the steady seepage condition were characterized by the
piezometric line shown in Figure F-15. The piezometric line begins at the reservoir surface at the point where
the reservoir intersects the fine-grained embankment soil (beneath the rip-rap), slopes downward to intersect
the inclined chimney drain, then follows along the bottom side of the chimney drain until it reaches the
elevation of the tailwater (el 22.5) and, finally, extends horizontally to the downstream face of the slope at the
tailwater level. Pore water pressures are calculated for each slice by multiplying the vertical distance between
the center of the base of the slice and the piezometric line by the unit weight of water. Alternatively, a more
rigorous seepage analysis could have been performed and the pore water pressure from this analysis used in
the computations. For the slip surface and slices illustrated in Figure F-16 there is only water on the external
surface of the slope above the last slice, Slice 9. The external water load on the last slice is calculated and
included in the computations for the factor of safety.
EM 1110-2-1902
31 Oct 03
F-24
Figure F-13. Example calculations for end of construction stability condition – Modified Swedish Method –
numerical computations for graphical solution
c. Unit weights. Total unit weights are used for all soils. Total unit weights should always be used
regardless of whether the shear strength is represented using total or effective stresses. The total unit weights
for the example problem are shown in the table at the top of Figure F-15.
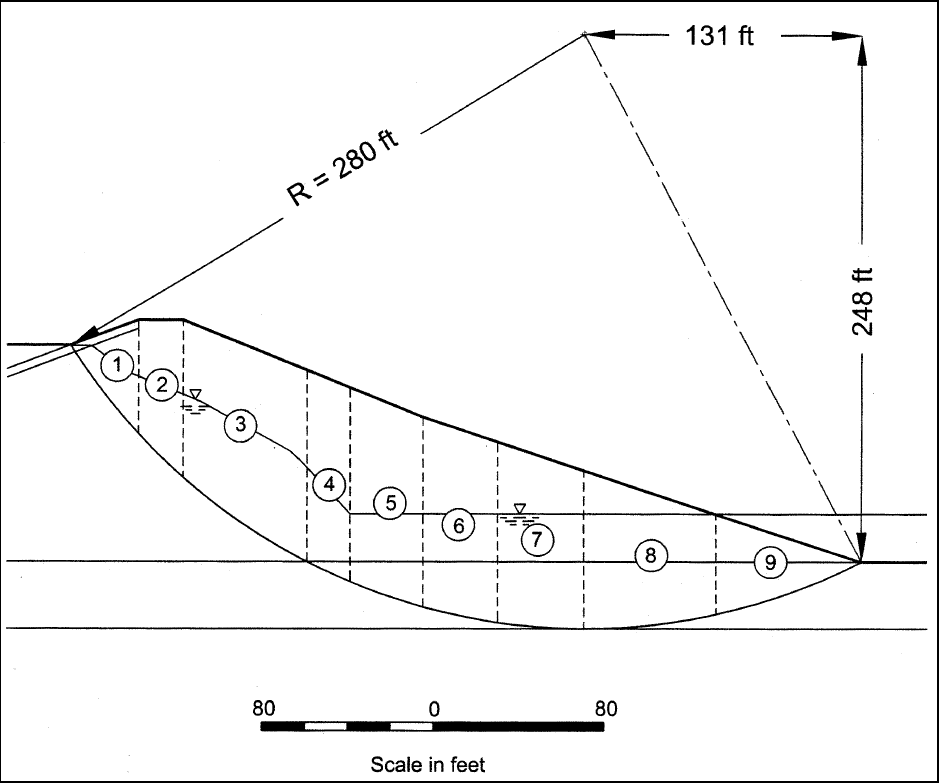
d. Slip surface and slices. The circular slip surface shown in Figure F-16 was used for the example
stability calculations. This surface is not the most critical slip surface. The factor of safety for an infinite
slope failure in the upper part of the slope (F = 1.68) is lower than the factor of safety (F = 2.01) for the slip
surface shown in Figure F-16. The infinite slope slip surface is very shallow, however, and the factor of
safety for that failure mechanism is of less significance with respect to the safety of the embankment than the
slip surface shown in Figure F-16. The soil above the slip surface is divided into the nine slices shown in
Figure F-16. The same circle and slices are used for both the Simplified Bishop and the Modified Swedish
Method analyses.
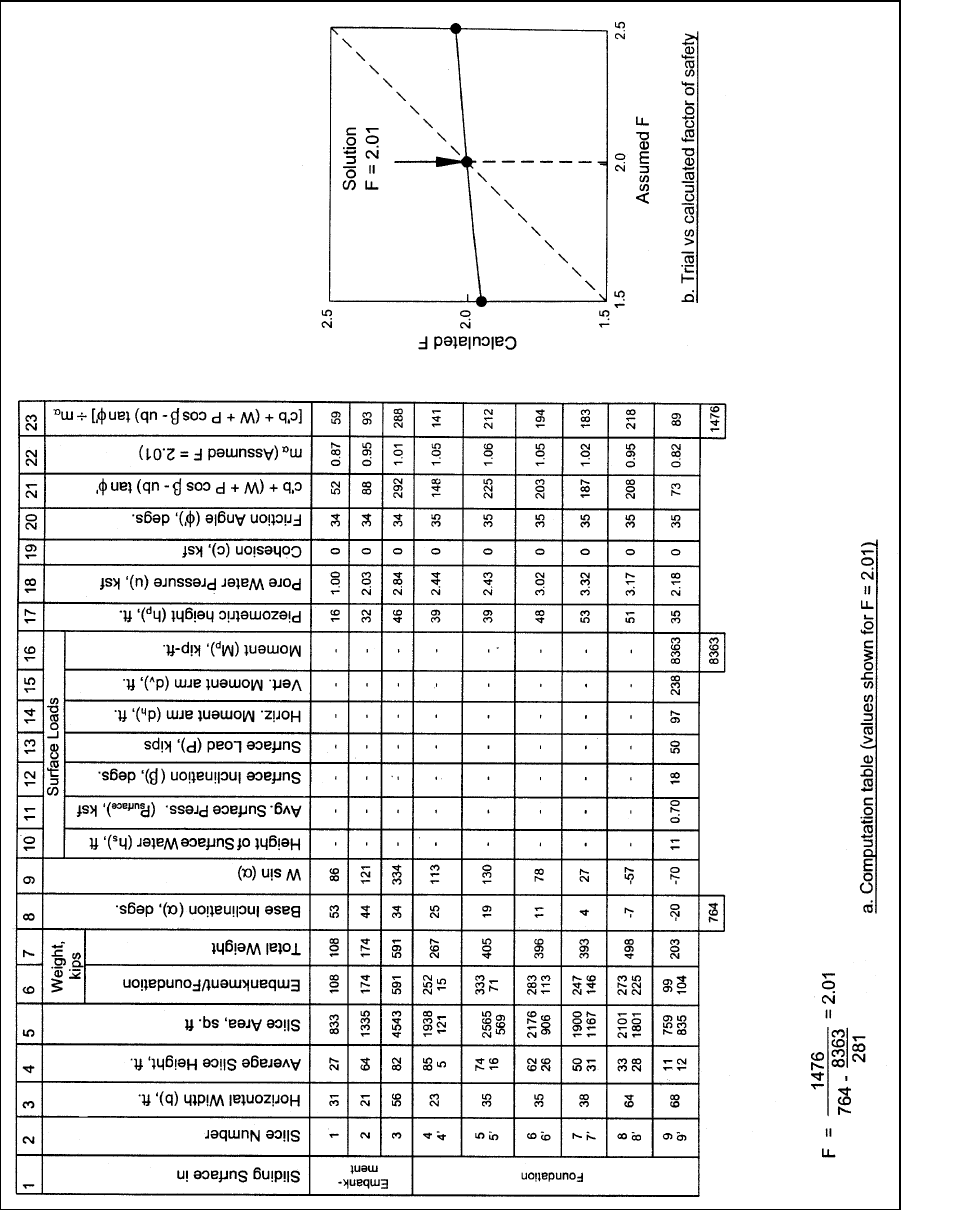
e. Simplified Bishop Method. Calculations performed using the Simplified Bishop Method are shown
in Figure F-17. Slices 4 through 9 contain both embankment and foundation soil and were divided into two
sections to calculate the slice weight. The average height in each soil was determined and used to compute
the area and weight for that portion of the slice. The weights of two parts of the slices were then added to
EM 1110-2-1902
31 Oct 03
F-25
Figure F-14. Example calculations for end of construction stability condition – Modified Swedish Method – force
polygons for graphical solution
EM 1110-2-1902
31 Oct 03
F-26
Figure F-15. Slope for example steady seepage computations
compute the total slice weight. The bottoms of Slices 1 through 3 are located in the embankment and these
slices were assigned the shear strength properties of the embankment soil (c' = 0, φ' = 34 degrees). The
bottoms of slices 4 through 9 are located in the foundation soil and these slices were assigned the shear
strength properties of the foundation (c' = 0, φ' = 35 degrees). Computations are shown in Columns 22 and 23
of the table in Figure F-17a for the final value of the factor of safety (F = 2.01). Computations were also
performed for trial values of the factor of safety of 1.5, 2.0, and 2.5. The computed values are plotted versus
the assumed values in Figure F-17b. The calculated values varied only slightly with the assumed value, as
shown in Figure F-17b.
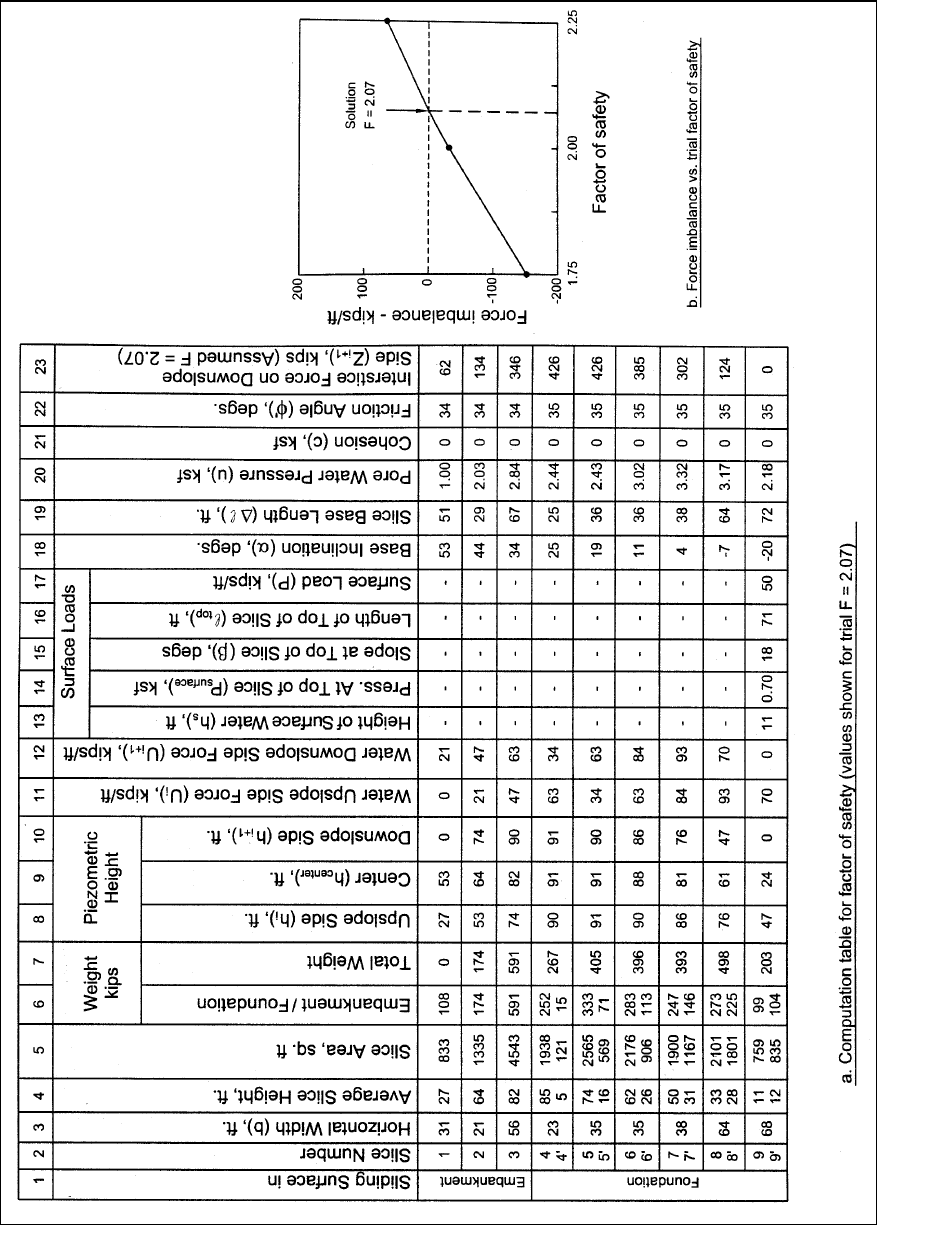
f. Modified Swedish Method – numerical solution. Calculations using the numerical solution for the
Modified Swedish Method are summarized in Figure F-18. For this example the interslice force inclination
was assumed to be equal to the average embankment slope. The average embankment slope is 2.8
(horizontal) to 1 (vertical). The side force inclination used in the calculations was θ = arctan (1/2.8)
= 19.7 degrees. Except for the forces from water pressures, most of the calculations and quantities shown in
EM 1110-2-1902
31 Oct 03
F-27
Figure F-16. Circular slip surface and slices used for example computations for steady-state seepage
the table in Figure F-18 are the same as the ones used previously for the Simplified Bishop Method. The
interslice forces, Z, are considered to be the effective forces and the water pressures on the sides of the slices
are calculated independently. The calculations for the water pressures on the sides and top of the slices are
shown in Columns 8 through 17 in the table in Figure F-18a. Calculation of the interslice forces is
summarized in Column 23 in Figure F-18a for the final value of the factor of safety (F = 2.07), which satisfies
force equilibrium. Calculations were also performed for three trial values of factor of safety F = 1.75, 2.00,
and 2.25. The force imbalance for each assumed value of factor of safety is plotted versus the factor of safety
in Figure F-18b. It can be seen that a value of F of 2.07 results in zero force imbalance.
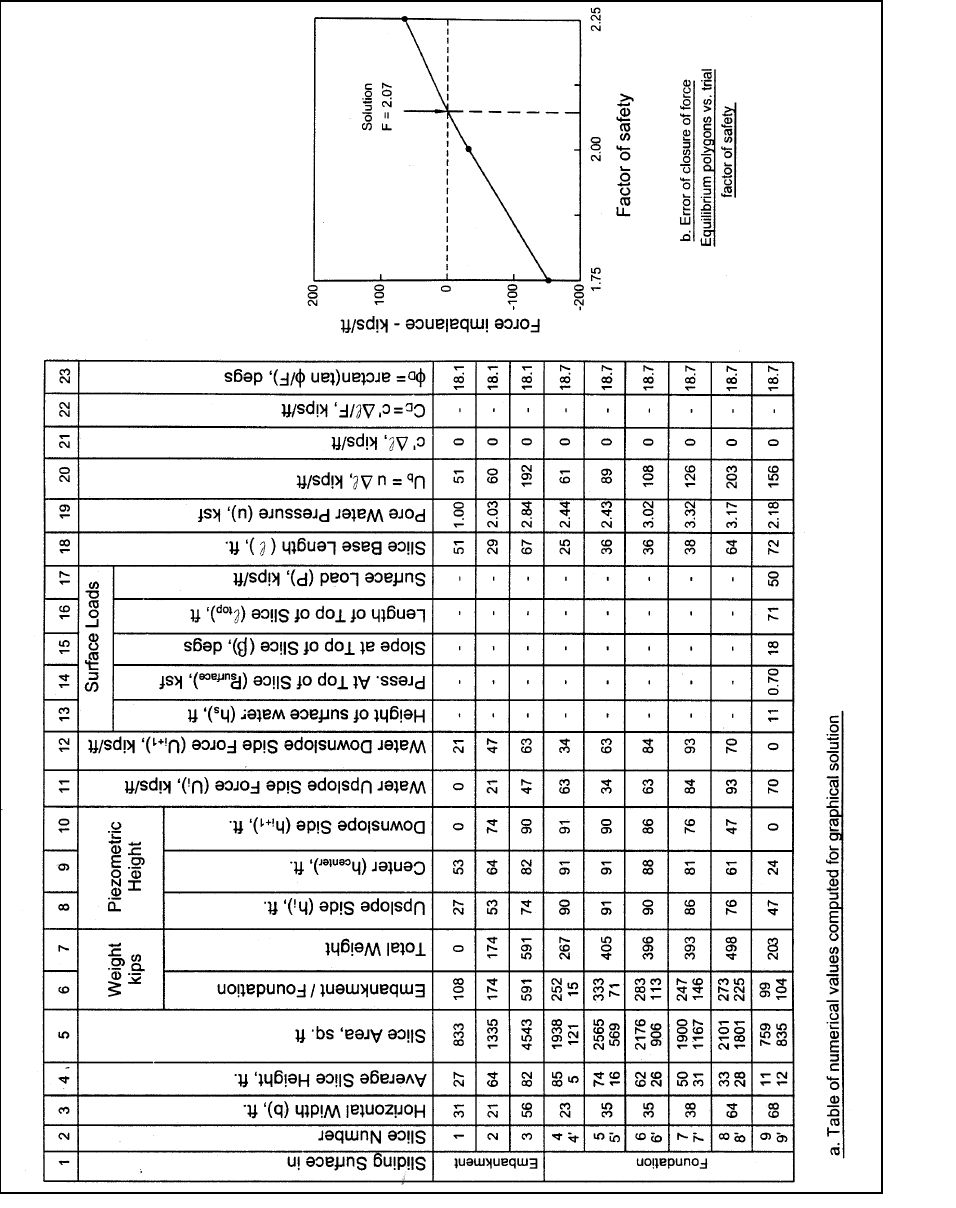
g. Modified Swedish Method – graphical solution
. Calculations using the graphical solution for the
Modified Swedish Method are shown in Figures F-19, F-20, and F-21. The necessary numerical
computations and the variation in error of closure with the assumed factor of safety are shown in Figure F-19.
The force vector diagrams for the resultants of the forces due to water pressures and the weight of the slice
(R
1
, R
2
, etc) are shown in Figure F-20. Finally, the equilibrium force polygons are shown in Figure F-21 for
the final solution (F = 2.07), where the force polygons close without significant force imbalance.
EM 1110-2-1902
31 Oct 03
F-28
Figure F-17. Sample calculations for steady-state seepage – Simplified Bishop Method
EM 1110-2-1902
31 Oct 03
F-29
Figure F-18. Sample calculations for steady-state seepage – Modified Swedish Method – numerical solution
EM 1110-2-1902
31 Oct 03
F-30
Figure F-19. Sample calculations for steady-state seepage – Modified Swedish Method – graphical solution - numerical values