Vij D.R. Handbook of Applied Solid State Spectroscopy
Подождите немного. Документ загружается.

15. Laser Raman Spectroscopy
terms concern frequency-shifted (i.e., inelastically scattered) light. These are
also known as anti-Stokes and the Stokes-Raman scattering. The above
equations can be generalized to the case where the molecular polarizabilities
are not isotropic and the induced dipole moment vector points in a direction
different from the electric field vector’s [21]. A quantum mechanical
scattering levels of the scattering system [21]. Similar to Rayleigh scattering,
in the absence of nonlinear effects, the intensity of the scattered Raman light
increases with the fourth power of the frequency of the exciting radiation. The
intensity ratio of the anti-Stokes to Stokes line is given by a Boltzmann factor,
exp( / )kT=
, where = is Planck’s number and k the Boltzmann constant.
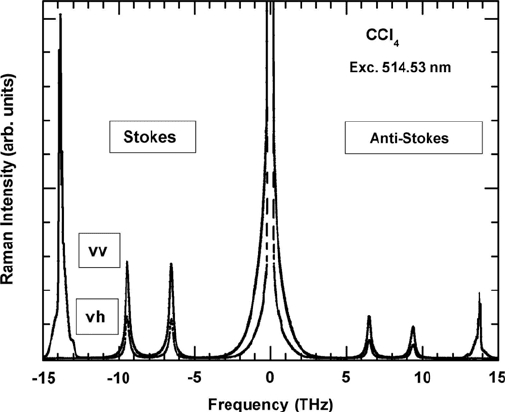
This is illustrated by the Raman spectrum of carbon tetrachloride in Figure
15.1. Note the strong polarization-dependence of the totally symmetric mode
at 13.8 THz (or 459 cm
1
). Both the polarized scattering (vv) and depolarized
(vh) scattering intensities are shown. Here, the first v means that the incoming
polarization is perpendicular to the scattering plane and that the polarization
of the scattered light is selected either in the scattering plane (vh) or
perpendicular to it (vv). Due to its higher intensity in spontaneous Raman
scattering, mostly the Stokes side of the spectrum is recorded.
Figure 15.1 Raman spectrum of CCl
4
measured with a double monochromator on the Stokes
THz | 1 cm
1
). Spectral resolution is 25 GHz.
Ȧ
664
treatment relates the polarizability tensor to the wavefunctions and the
and anti-Stokes side for two polarizations. Vibrational frequencies are given in Terahertz (0.03
In general, excitations modulate the electric susceptibility and
consequently the induced polarization through fluctuations in their dynamical
variables [. Such dynamical variables can include vibrational displacement
for phonons, magnetization for spin waves and spin fluctuations, and electron
(quasiparticle) density for electronic (superconducting) excitations.
The modulation of the susceptibility by [ adds an additional term to the
o
(
ȤȤȟ
)
P
EE
c
H
(15.3)
where
ȤȤ
/
ȟ
dd
c
is the susceptibility derivative with respect to the
dynamical variable
ȟ
. The first term in equation (15.3) drives the polarization
at the incident field frequency, and therefore contributes to simple elastic
scattering. However, since
ȟ
is itself time-dependent, reflecting the
characteristic fluctuations of the excitation, the second term modulates the
induced polarization at frequencies different from the incident field. This term
therefore contributes inelastic features to the spectral response.
Within this framework the differential Raman-scattering cross-section
associated with an elementary excitation can be written as [23]
S
3
2
S
*
I
SSSS
2
24
Ȧ
S
oI
ȦȦ
ˆˆ
İİ
ȍȦ
(4ʌİ )
V
d
PP
dd
cE
V
(15.4)
where
S
*
SSSS
Ȧ
ˆˆ
İİPP
the light-scattering volume, c is the speed of light, and
S
İ
is the polarization
of the scattered light.
The power spectrum due to polarization fluctuations is given by
3
2
2
S
*
I
SI
24
Ȧ
S
o
ȦȦ
(İ
Ȥ
İ )
ȟȟ
.
Ȧ
(4ʌİ)
V
d
dd
c
V
:
(15.5)
Here
S
İ
and
I
İ are the scattered and incident polarization directions, and
*
Ȧ
ȟȟ
is the thermally averaged correlation function for the dynamical
variable
ȟ
.
The light-scattering cross-section is related both to the correlation fuction
of the relevant dynamical variable [ and to the light-scattering volume
V .
Futhermore, the light scattering cross-section depends on the symmetry of the
susceptibility derivative tensor
F, and indeed one can obtain excitation
symmetry information by varying the scattering geometry defined by the
polarization directions H
I
and H
S
. This is an extremely powerful feature of
light-scattering techniques, since it allows identification of excitation
symmetries [23].
When light-scattering is used to probe relaxations in a liquid the spectrum
is mostly presented in the form of the susceptibility F(Z), which is obtained
from the scattered intensity (up to a constant) by division with the thermal
15.2 Spontaneous Raman Scattering
665
polarization:
is the spectral density of polarization fluctuations with
frequency , V is
S
Ȧ
15. Laser Raman Spectroscopy
population factor n(Q) + 1. Here, n(Q,T) = [exp (hQ/kT) – 1]
1
, Q is the
frequency, T the temperature, and h and k are Planck and Boltzmann constants
[24].
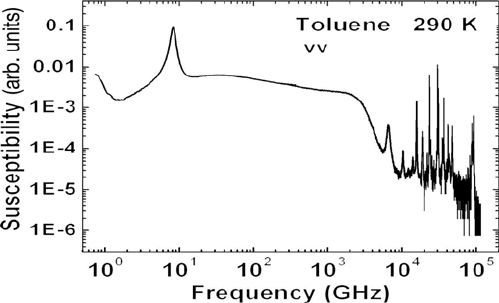
As an example, the light-scattering spectrum of toluene over a wide
frequency range is shown in Figure 15.2 on a double-logarithmic scale. The
molecular Raman active vibrations are visible as sharp bands over the
frequency range from 5 × 10
3
to 10
5
GHz. Below 5 × 10
3
GHz a broad band
due to structural relaxation in the liquid is discernible followed by the
Brillouin line near 10 GHz. Other spectral representations, which are in use
for low-frequency Raman spectroscopy but are related to the susceptibility,
are discussed in [25]. For a more extensive treatment of the theoretical back-
ground on light-scattering the reader is referred to the literature [23, 24].
Figure 15.2 Susceptibility of toluene showing signatures of molecular vibrations, structural
relaxation, and the Brillouin line. The horizontal axis displays the frequency of the excitation
relative to the Rayleigh on the Stokes side. The excitation wavelength is 514.53 nm. The
spectrum shown combines light-scattering data measured with a double monochromator and a
six-pass tandem Fabry-Perot interferometer.
15.3 EXPERIMENTAL APPROACHES
Over the past 15 years the development of efficient filters for Rayleigh
rejection and the availability of multichannel detectors have considerably
simplified the experimental setup with the additional benefits of increased
optical throughput and shorter acquisition time. The spectrometer can be
reduced to a single spectrograph stage with a notch [26, 27] or sharp cut-off
filter [28] selected for high extinction at the Rayleigh line [18]. Thus, Raman
spectroscopy has become even more accessible as a scientific tool.
From an analytical point of view it is often desirable to characterize
samples in nano- or picogram quantities. These requirements can be met by
combining an optical microscope with a Raman system. Then the excitation
spot has a dimension in the micron range, and Raman spectroscopy provides
666
15.3 Experimental Approaches
molecular compositional information with high spatial resolution. A
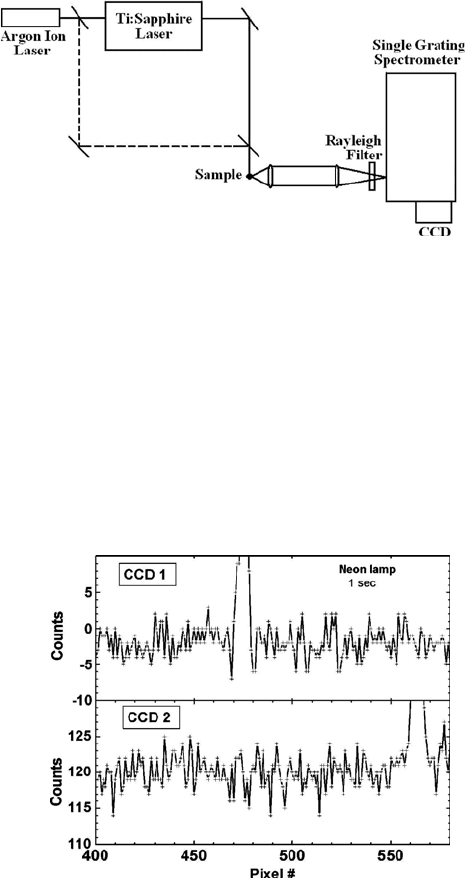
schematic of a Raman setup is shown in Figure 15.3. Raman scattering is
excited by either an Ar ion or a Ti:sapphire laser. The scattered light is
collected with a low f-number lens and focused with a second lens on the
entrance slit of a single-grating spectrograph (typical dispersion: 1.2 nm/mm
in the focal plane). Multichannel detection at the single photon level is
achieved with a backthinned charge-coupled device (CCD) detector.
Figure 15.3 Schematic of an experimental setup for Raman spectroscopy using a single-grating
spectrograph and Rayleigh rejection filter.
The CCD itself is a Si-based array detector. Absorbed photons are
converted to electron-hole pairs. The electrons are collected in potential wells
created by a depletion layer. The wells can be addressed individually and
digitized with the readout electronics. CCDs are characterized by a high
dynamic range (~10
5
), high quantum efficiency (~ 90%), wide spectral range
(4001050 nm) and low readout noise (~25 e
/pixel as seen in Figure 15.4).
Figure 15.4 Readout noise characteristics of two commercial CCD detectors.
Traditionally one works in the visible region of the spectrum, sometimes
also to exploit resonance enhancement to extract information on the
667
15. Laser Raman Spectroscopy
chromophore or the prosthetic group of a protein [29]. At the same time this
approach has drawbacks since strongly absorbing samples such as many
polymers and biological molecules can degrade or undergo undesired
photochemistry during exposure to the laser beam. More important, a
fluorescence background frequently obscures the Raman signal. One way to
overcome these problems is to shift the laser excitation into the near-infrared.
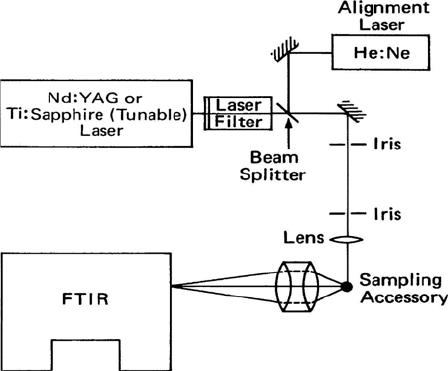
Fourier transform (FT) Raman spectroscopy [30, 31, 20, 3] has provided a
means of measuring the Raman spectrum of strong visible absorbers in the
absence of fluorescence and resonance enhancement. When using the 1064-
nm line of a Nd:YAG laser as an excitation source the Stokes-shifted Raman
spectrum occurs in the near infrared, typically between 6000 and 10000 cm
1
.
The scattered radiation is focused on the entrance port of a conventional FT-
IR spectrometer and effectively replaces the internal light source for
absorption spectroscopy. The analysis of the Raman spectrum via Fourier
transform benefits not only from the multiplex and throughput advantages, but
also from the inherently higher wavenumber accuracy of the interferometric
method.
Figure 15.5 Schematic diagram of a FT-Raman experiment.
In polymer science FT-Raman spectroscopy has been used to probe
conformation and side-chain packing in polysilanes and nonlinear optical
materials [32]. Applications to macromolecules of biological interest
concentrated on a synthetic polypeptide [33], polyene antibiotics, and lipid
bilayers [34]. Of particular interest in biology is the vibrational structure and
photochemistry of light-harvesting proteins such as bacteriorhodopsin and
visual pigments. Due to the photolabile nature of these compounds great care
has to be taken to avoid sample deterioration. FT-Raman spectroscopy using
excitation beyond a wavelength of 1 micron often can overcome these
668
15.3 Experimental Approaches
problems. For instance, high quality spectra of the retinal isomers and the
protein bacteriorhodopsin can be obtained within minutes.
FT-Raman spectra were measured in
a
90
o
scattering with excitation by the
1064-nm line from a cw Nd:YAG
laser
[35].
The scattered light was analyzed
with a Bomem model DA3.02
Fourier
transform interferometer, which was
equipped with a cooled (35
o
C)
indium-
gallium-arsenide photodiode detector.
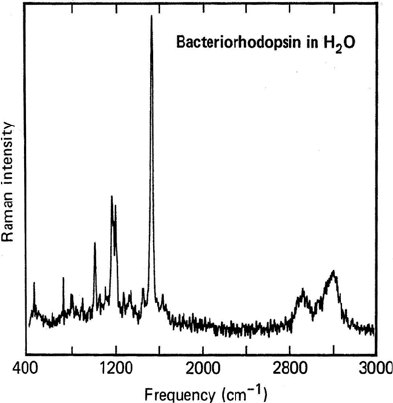
Figure 15.6 displays the FT-Raman spectrum of bacteriorhodopsin
between 400 and 3500 cm
1
[35].
The sample was in solution and no
enhanced Raman spectrum with excitation in the visible, rather
tedious sampling handling methods such as molecular flow or spinning cells
were required [36]. The CH stretch mode was near 2900 cm
1
. The most
intense band at 1531 cm
1
could be assigned to the C=C due to the polyene
part of the retinal. The chromophore vibrations dominated the spectrum. This
may have been caused by the high polarizability of the conjugated bonds in
the retinal. The FT-Raman technique referenced the measured frequencies to
the frequency of an internal He:Ne laser. Therefore, the absolute frequency
could be determined to better than 0.01 cm
1
and the band positions reported
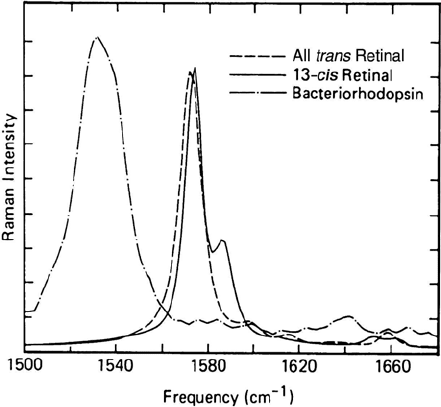
were limited by the collection parameters. Figure 15.7 displays the spectra in
the ethylenic mode region of bacteriorhodopsin, 13-cis, and all-trans retinal.
Some bands of the isomers differ by frequency shifts of a few wavenumbers
only, but are clearly resolved. The interaction with the protein causes a
frequency shift of the chromophore bands in bacteriorhodopsin.
Figure 15.6 FT-Raman spectrum of a bacteriorhodopsin solution obtained at 1064 nm with a
laser power of 700 mW.
669
smoothing or baseline correction was performed. To obtain the resonance
15. Laser Raman Spectroscopy
Figure 15.7 The ethylenic mode in bacteriorhodopsin, all-trans, and 13-cis retinal.
The examples presented above demonstrate the potential of FT-Raman
spectroscopy as a nondestructive technique for molecular characteri-zation of
photolabile chromophores and biopolymers. Among the limitations of FT-
Raman spectroscopy are the loss in signal intensity due to the dependence of
the scattering cross-section on the fourth power of the wavenumber and the
need for Rayleigh line rejection filters. By employing a tunable Ti:sapphire
laser in the range between 700 and 1000 nm the excitation can be shifted to
shorter wavelengths, yet the excitation wavelength can be chosen long enough
to avoid fluorescence or undesired photochemistry. An excellent long pass
filter can be realized by a semiconductor single crystal with a band gap in this
energy range [37]. The alignment can be performed in the visible before the
Ti:sapphire laser is tuned to the desired excitation wavelength in the near
infrared.
Another approach is to use a near-infrared laser source (most commonly a
diode laser at 785 nm or a tunable Ti:sapphire laser) and a backthinned CCD
detector in combination with a dispersive instrument [38, 28, 2]. Some
applications using this technique are included in the next section.
15.4 APPLICATIONS
In the following we illustrate recent applications of Raman spectroscopy to
materials of current technological interest. To begin with we discuss recent
examples of advanced materials for Raman gain applications. The elucidation
of structural properties in chalcogenides glass and the use of waveguide
Raman spectroscopy follows. Then, we describe experiments which use
670
Raman spectroscopy to probe conformational changes in heme proteins.
Finally, we touch on a few applications of micro-Raman spectroscopy.
15.4.1 Glasses for Raman Gain
One the most crucial components in optical communication systems is the
optical amplifier. Recent progress in the fabrication of glass fibers have
significantly increased the available transmission window for optical
communication [39]. The increase in bandwidth has caused researchers great
interest in the employment of Raman amplifiers. This is due to their
potentially much larger bandwidth as compared with erbium-doped fiber
amplifiers (EDFA). It is important, therefore, to find a material with wide
bandwidth for Raman gain. On theoretical grounds, the coefficient for Raman
gain depends linearly on the spontaneous Raman scattering cross-section [40].
Experimentally, a direct comparison between spontaneous and Raman gain
spectra in two TeO
2
-based glasses has recently shown a peak gain 30 times
that of fused silica and twice its spectral bandwidth. It was also demonstrated
that the Raman gain profile and intensity mimic that of the spontaneous
Raman spectrum. [41].
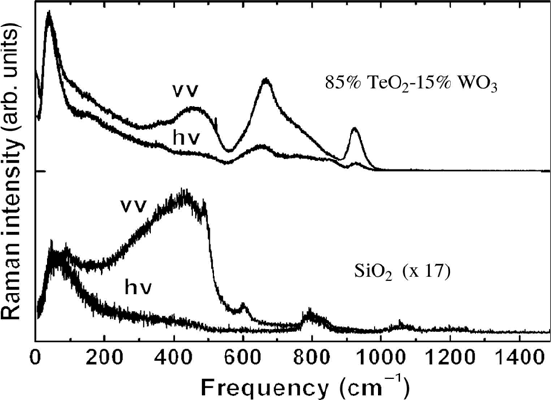
The Raman spectrum of a tellurite-based glass is shown over an extended
frequency range from 6–1500 cm
1
in Figure 15.8, together with the spectrum
of fused silica (SiO
2
). The spontaneous Raman spectra were measured using
514.53 nm excitation and a double monochromator. The top spectrum is that
of the glass with composition 85% TeO
2
-15% WO
3
. Note that the fused slica
spectrum has been multiplied by a factor of 17. Fused silica is employed as a
standard material to quantify Raman gain. The high intensity and large
bandwidth of the tellurite glass compared to fused silica predicts favorable
properties for Raman gain application.
Raman bands in the high frequency region originate from the vibrations of
molecular bonds. In the tellurium oxide system, increasing TeO
2
concentrations are determinants for the intensity of the main peaks. The
intensity of the bands between 610 and 670 cm
1
associated with trigonal
2
950 cm
1
, attributable to vibrations of distorted
WO
3
units. This band is
3
intermolecular coupling.
The depolarization ratio is indicative of the symmetry of the vibrations
involved in the scattering process. A highly symmetric vibration will have a
depolarization ratio close to zero. In the low frequency region, large Raman
scattering is observed. The intense band near 40 cm
1
(Figure 15.8) is
attributed to the Boson peak. The larger depolarization ratio in the frequency
15.4 Applications
671
bipyramides increases with TeO content.
highly polarized indicating
that WO
spectra are bands at 770 and
Significant features in the Raman
units are pre-
served with small
15. Laser Raman Spectroscopy
region below 400 cm
1
suggests that in this range Raman amplification is
much less polarization-dependent.
Figure 15.8 Polarized (vv) and depolarized (hQ) Raman spectra of a tellurite glass, and fused
silica measured with 1.5 cm
1
spectral resolution. The excitation wavelength is 514.53 nm.
Depolarized spectra are multiplied by factors between 2 and 5 due to lower intensity to allow
comparison. Note that the scale for the fused silica spectra has been expanded by a factor of 17.
In the low frequency range the scattered intensity needs to be corrected for
1
,Q
is the frequency, T the temperature, and h and k are Planck and Boltzmann
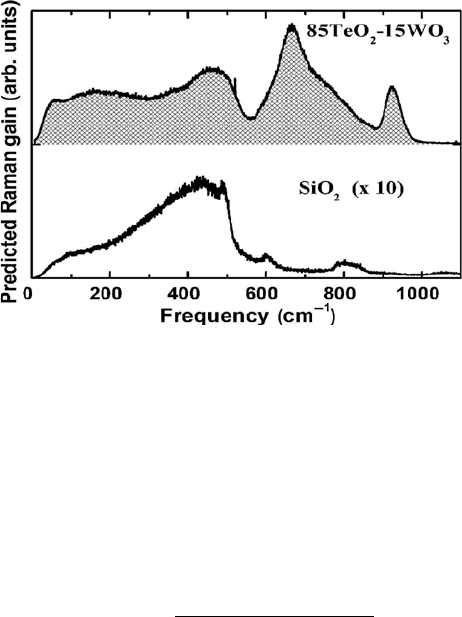
constants [2]. The vv polarized spectra divided by n(Q) + 1 are shown in
Figure 15.9 [42]. These correspond to the predicted Raman gain curves and
they show a very broad band in the low frequency region (50400cm
1
). This
indicates that in the tellurite glasses a flat Raman gain profile down to very
low wavenumber can be obtained while the gain is more than 10 times that of
fused silica. the bandwidths of both glasses are almost twice as wide as that of
fused silica, and the Raman intensity (which is proportional to the Raman
scattering cross-section) of the telluride glass is several times higher than that
of the fused silica [42].
A universal feature of the Raman spectrum of glasses is the so-called
Boson peak. We can see from Figure 15.9 that after correction for the thermal
occupation factor there is broad and intense Raman scattering in the low
frequency region due to excess vibrational excitations.
We know that, for crystals, the density of states follows the Debye’s law
(e.g.,
2
()g ZvZ) in the low frequency region, but there are deviations for
amorphous materials. For amorphous materials, there is an additional
contribution to the density of states as compared with the Debye’s law. This
the thermal population factor, n(Q) + 1 where n(Q, T) = [exp (h
Q
/kT) – 1]
672
representation
2
()/g ZZ
BP
.
Figure 15.9 Predicted Raman gain curves after correcting for the thermal population factor of
tellurite glass (85 TeO
2
-15 WO
3
) and fused silica. The fused silica spectrum has been multiplied
by a factor 10 to allow better comparison with the spectrum of 85 TeO
2
-15 WO
3
.
In amorphous materials the density of states g(Z) and the Raman spectrum
can be connected using a relation by Shuker and Gammon [43]:
(Ȧ)
(
Ȧ)(Ȧ)[ (Ȧ)1]
Ȧ
I
C
gn
(15.6)
where
(Ȧ)I denotes the Raman intensity for the Stokes side of the spectrum,
[n(Z) + 1] the Bose-Einstein factor, and C(Z) is the light-vibration coupling
coefficient. The density of states can be independently measured by neutron-
scattering. Based on such combined data it has been suggested that in many
glasses the coupling coefficient varies nearly linearly with frequency [44].
The origin of the Boson peak or excess of density of states in amorphous
materials is still under debate, and several models including localized
vibrational states and medium range disorder effects have been proposed [45].
Excess density of states due to disorder can be considered to arise from the
atomic positions or a distribution of force constants [46]. Computer
simulations have shown that force constant disorder alone can give rise to the
Boson peak [47].
15.4.2 Chalcogenide Glasses
Two characteristics of As-S-(Se) compounds—a large glass-forming region
and a wide optical transmission band, with potentially low loss for the 1.3–
1.55 mm telecommunications window—make them excellent candidates for
15.4 Applications
is chosen peaks at a frequency Z
excess density of states is characteristic for the Boson peak. Sometimes the
which
673